Square
Following
Hot
News
Profile
Share your thoughts
placeholder
Article
$JCT Quickly, quickly, open a short! This is a selling opportunity from the top,
I’ve already entered a short with 1 thousand—come on, let’s make profits!Target: 0.0020
post-image
JCT+51.60%
No complaints about this $AIOT trade.
Take it while the money is still there. Close here. ROI: 358% Funds: 2290 USDT Market watch: $BT : Current price 81,773.4 - 24-hour change: -1.73%
$Q : Current price 0.026155 - 24-hour change: +21.99%.
post-image
AIOT-12.10%
The entire sector is broadly up, so why is AMP more worth watching?
The answer lies in the mismatch between relative strength and volatility elasticity. $AM is up 17.65% over 24h, outperforming $PYTH at +14.11% and $AERO at +3.99%, yet its RSI is only 55.4, the lowest among the three—AERO has reached 60.9, while PYTH is as high as 66.5 and nearing the Bollinger upper band at 0.08389. AMP, meanwhile, is currently at 0.00068, still above the Bollinger middle band, with approximately 11% room remaining to the upper band at 0.00075698. This means AMP combines “leading gains with non-overheated
post-image
AERO+3.91%
  • 1
Some buyers have started stepping in for Bitcoin, but it’s still too early to say the decline is over.
BTC dropped as low as $80,394 yesterday and has now rebounded to around $81,900.
A few changes in this rebound are worth noting: open interest has declined significantly, buying demand is beginning to recover, and U.S. Treasury yields have also pulled back somewhat. Market pressure is lighter than it was yesterday.
But one question remains unanswered: Did large players actually enter the market to buy the dip, or did shorts simply take enough profit and start closing their positions, pushing
post-image
BTC-1.80%
$NEAR Current price is 4.51, down 15.46% over 24h, with trading volume surging to 304 million USDT. On the moving-average front, MA5=4.5278 has crossed below MA20=4.877, with a bearish alignment initially forming; RSI=32.3 is approaching the oversold zone, while the MACD histogram at -0.03631 remains negative, indicating momentum is still controlled by the bears. The key is the funding rate of -0.0052%—the negative rate means shorts are paying to hold positions. Although longs are being squeezed, there is not yet an extreme discount, indicating strong but not irrational bearish sentiment. The
post-image
HYPE-4.81%
Briefing | Middle East Situation Tracking (October 9)🔥
I. Situation Overview
✅Signs of de-escalation: Trump stated that he will not attack Iran before the midterm elections, and that the US and Iran are still engaged in effective negotiations; Iran also said it will not withdraw from the negotiating table and will respond to the US proposal in the coming days.
⚠️Risks remain unresolved:
1. Houthi forces attacked Riyadh Airport, setting a Saudi airline aircraft on fire; the Houthis warned that Saudi airspace would become a target, except for Mecca and Medina.
2. Senior Iranian officials said w
post-image
BTC-1.76%
ETH-3.63%
GLDX+0.76%
PAXG+0.78%
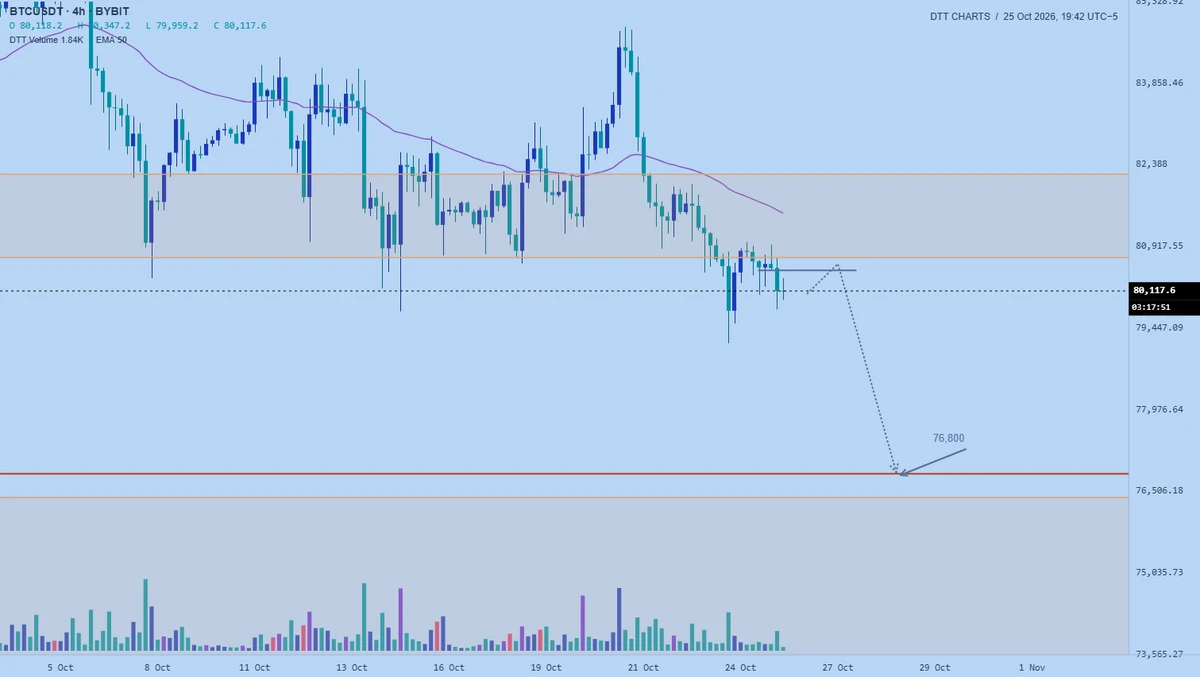
New DTT Journal is live. It automates 98% of the journaling processes. It works in combination with DTT chrome app and DTT charts. Also new DTT chrome app update is available for download inside of whop. I’ll make a new full walkthrough video soon covering how to use everything, it’s 1 streamline process.
  • 1
$CXMT My position was too large. Last night’s low was caused by my stop-loss sell-off, and I got stopped out at the very bottom. That’s how helpless it feels.
CXMT-10.74%
MUBARAK is currently above the 1-hour MA99, with the price trading around 0.07428; a constructive rebound has emerged from the low of 0.07026. The 15-minute RSI(12) is 53.00, and the price is consolidating near the MA25, making a retest of the 0.07830 resistance level the most likely short-term path. You can go long now $MUBARA ! 🔥
Entry: 0.0749 - 0.0753Take-profit target 1: 0.07872Take-profit target 2: 0.08162Risk level: 0.07265Trade here 👇👇👇 Also: $BT : Current price 81,792.7 - 24-hour change: -1.88%
$JCT : Current price 0.002514 - 24-hour change: +58.11%.
post-image
JCT+51.60%
Crypyo Market update
live-cover
LIVE50
$SOL has entered the oversold zone, but “it’s due for a rebound” and “it has bottomed” are completely different things.
I’m watching just one divergence: whether there is still buying support after breaking above 116.81. The current price is 110.33, with volume at 0.11x. The 1-hour and 4-hour trends are both weak, with RSI at 33 and 18, respectively.
If volume continues to expand after breaking above 116.81, control will favor the bulls; if it breaks below 105.71 and fails to reclaim it, the short-term outlook is invalidated. Stop trying to call the bottom for now and wait for a new support s
post-image
SOL-5.87%
$Lobster, awesome, stoic, taking off,
post-image
龙虾+24.59%
The Federal Reserve's September meeting minutes were released on October 7, and the market's interpretation of them has been far from straightforward. All nineteen officials supported the quarter-point hike that lifted the benchmark rate to 3.75%–4.00%, and most participants believed another increase by year-end could be appropriate. Yet within days, the implied probability of a hike at the October 27–28 meeting fell below 20%, down from roughly 70% in the period immediately after the September decision. That gap between the minutes' language and the market's pricing is the central fact shapin
post-image
User_any
When the Federal Reserve released the minutes from its September meeting, the immediate reading was that the central bank was still leaning toward tightening. All nineteen officials supported the quarter-point hike that lifted the benchmark rate to 3.75%–4.00%, and most participants believed another increase by year-end could be appropriate. Yet the market’s response over the following days told a different story. The odds of a hike at the October 27–28 meeting have fallen to roughly 17%–20%, down from nearly 70% in the days right after the September decision. That gap between what the minutes said and what traders are pricing is the central tension in the market right now.
Part of the explanation lies in the language the minutes used. While most officials saw another hike as potentially appropriate, the document also stressed that decisions would remain data-dependent and gave no indication that October was the intended venue. The phrasing “by year-end” rather than “at the next meeting” left room for interpretation, and the market chose to read it as a signal that the Fed is in no rush. Officials have reinforced that view in public remarks since the meeting. Fed Governor Christopher Waller said this week that further rate hikes are needed, but he also noted that the labor market is cooling and that the central bank can afford to be patient. That combination—a willingness to tighten, but without urgency—has kept October hike odds low.
The data that has come in since the September meeting has supported the patient approach. The August PCE price index, the Fed’s preferred inflation gauge, rose 3.4% year over year, below the 3.7% consensus estimate, while core PCE came in at 3.0%. The September jobs report, released on October 2, showed the economy added just 29,000 jobs, far below expectations, with the unemployment rate ticking up to 4.2%. Softer inflation and a cooling labor market give the Fed room to hold rates steady at the October meeting without risking a surge in price pressures. The market has interpreted that combination as reducing the case for an immediate hike.
That brings us to the October 14 CPI report, which is now the single most important data point on the calendar before the Fed meets. Forecasts point to headline inflation rising to around 3.6%–3.7% year over year, up from 3.4% in August. Core CPI, which strips out food and energy, will draw the most attention because it is a better gauge of underlying price pressures. If core CPI comes in at 0.3% month over month or higher, the case for an October hike will resurface, and the odds could climb back toward 40%–50%. A softer reading, closer to 0.2%, would confirm that inflation is continuing to cool and would likely keep October hike odds where they are—or push them lower still.
So how would a hotter-than-expected CPI print affect the Fed’s decision? The minutes already noted that inflation risks are skewed to the upside, with some participants concerned that energy prices and the AI buildout could keep price pressures elevated. A hot CPI reading would validate those concerns and give the hawks on the committee a stronger argument for acting in October rather than waiting until December. But it is worth remembering that the Fed has repeatedly emphasized its data-dependent approach. One inflation report alone is unlikely to force a hike if the broader trend still points toward gradual cooling. The bar for an October move is high, and it would likely take a combination of hot inflation and resilient jobs data to clear it.
For crypto and U.S. stocks, the transmission channel runs through rate expectations and the dollar. When hike odds fall, the opportunity cost of holding risk assets declines, which tends to support prices. Crypto investment products recorded $3.55 billion in inflows in the week after the September hike, the largest weekly figure of 2026, showing how sensitive digital asset flows are to the rate outlook. But the relationship is not one-directional. The 10-year Treasury yield is holding near 5.28%, and the 30-year is near 5.63%, both at multi-decade highs. Those elevated yields continue to weigh on valuations, particularly for high-growth sectors that depend on discounted future earnings. A softer CPI print would ease that pressure by reducing the probability of further tightening. A hotter print would do the opposite.
Is the current outlook already priced in? Largely, yes—but not entirely. The market has priced a pause for October and a hike for December, with December odds around 70%. Those expectations are reflected in current asset prices. What is not fully priced is the possibility of a meaningful surprise in the CPI data. If the report comes in significantly above or below expectations, the repricing could be sharp, because so much of the market’s positioning is built around the assumption that the Fed will hold in October. A hot print would force traders to reconsider that assumption, and the adjustment could ripple across bonds, currencies, equities, and crypto simultaneously.
My own view is that the Fed is unlikely to hike in October unless the CPI report delivers a genuine upside surprise. The labor market is cooling, inflation is trending in the right direction, and the committee has signaled that it sees no urgency to act. The December meeting remains the more likely venue for the next move, if there is one at all. But the October 14 CPI release is the variable that could change that calculus. Until it lands, the market is operating on incomplete information, and the gap between the hawkish minutes and the dovish pricing will remain unresolved.
This article is not investment advice. Analysis is based on publicly available information and does not guarantee future outcomes.
$BTC $ETH $GT
#ShareWeekly #FedSeptemberMinutesLeanHawkis
BTC-1.76%
ETH-3.63%
GT-2.32%
NVDA-2.86%
SNDK-4.91%
  • 1
  • 1
$ETH
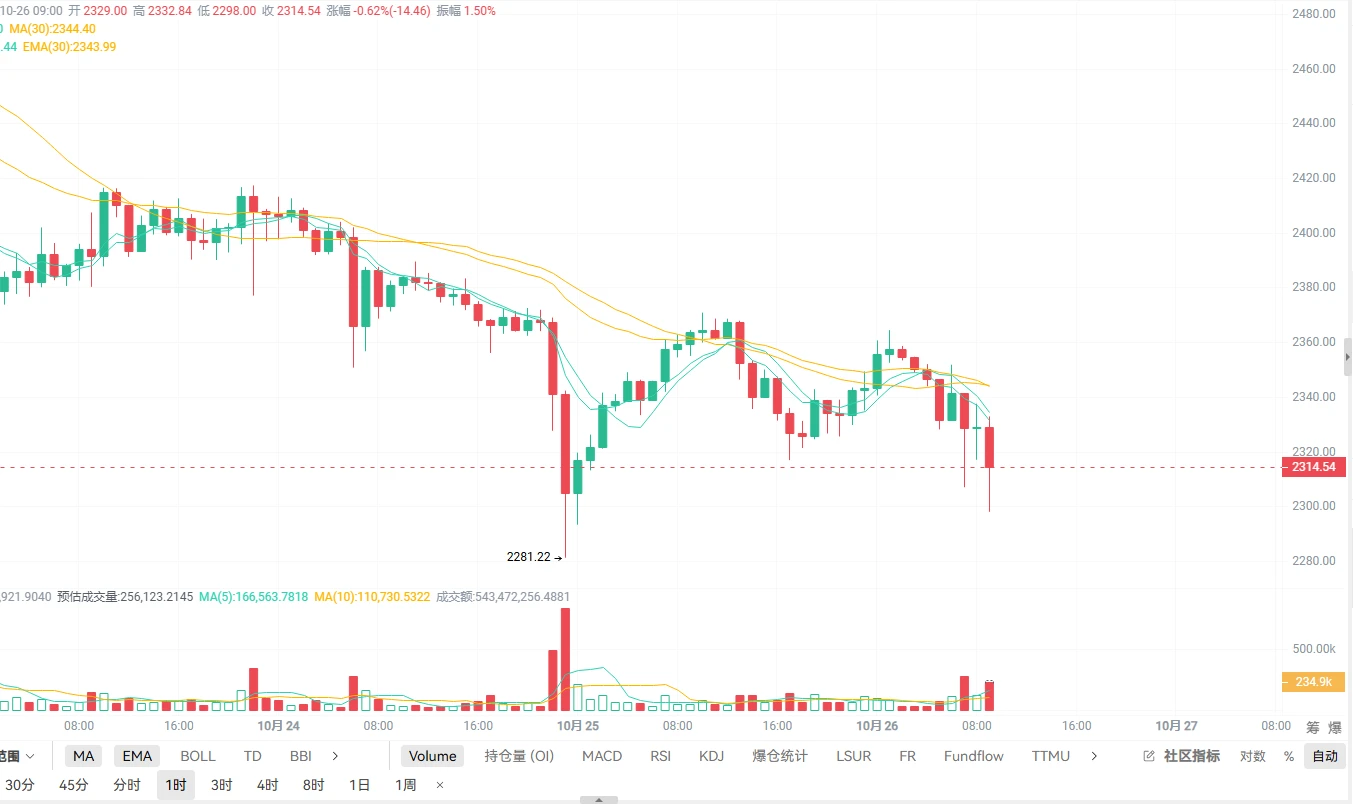
quietly increased its position by a little over one percentage point, while the funding rate is still negative. Are the shorts getting a free ride and paying on top of that? 77% of people are piled into longs, sharpening their knives right against resistance. I’ll hold on tight as long as 2405 doesn’t give way—don’t wait until it rallies to start kicking yourselves. 😏🔥
post-image
ETH-3.66%
Amid the broad decline across the sector, why is $ADA more worth watching?
The answer lies in relative strength: INJ is down 8.22% over 24h with a 16.82% trading range, while ADA is down 7.43% with a 14.61% range. Both the decline and volatility are more contained, indicating that selling pressure has been relatively well released. However, the technical picture has not yet turned bullish—MA5=0.23292 is below MA20=0.243225, showing a bearish alignment; RSI=36.5 is approaching the oversold zone, the MACD histogram at -0.0006026 remains negative, and the price is near the Bollinger lower band at
post-image
INJ-9.67%
The day before yesterday, someone said NVIDIA hit a new high, and many retail traders started fantasizing that the AI bull market would continue. How is that any different from FOMOing into BTC at $126k?
In many cases, the final subwave of Wave 5 has to set a new high,
This is not the bull market continuing, but a signal that the bull market has reached its highest point.
If you short it at this point, the win rate is absurdly high.
#NVDA #英伟达 #BTC
post-image
NVDA-2.86%
BTC-1.76%
$BNB
After finishing that book, I laughed and then froze. Even the big shots panic, but they dare to bet after calculating the worst-case scenario clearly. Policies change at midnight, and by dawn they’re already on a plane. Despite being criticized mercilessly, they still wear affordable clothes and ride bikes. If the logic hasn’t changed, don’t move; when it’s time to go, go. This wave isn’t about price, only the bigger picture. 😏
post-image
BNB-4.68%
Financial News, Crypto Updates, Real Trading Strategies
live-cover
LIVE880
The past few days I've been off the charts, really sick and had to spend some time with family (you know the feeling). I should be back better and active from this weekend or Monday at most.
post-image
$BOME — A potential short-term opportunity
After failing to hold its latest rebound, BOME is facing rejection and a pullback around 0.00105. If sellers continue to pressure this area, the price may move downward toward lower support levels. Entry: 0.001049 Take-profit 1: 0.001020 Take-profit 2: 0.000990 Take-profit 3: 0.000959 Stop-loss: 0.001087 Sell and trade $BOME
post-image
BOME-0.93%
Load More

Join 40 M users in our growing community

⚡️ Join 40 M users in the crypto craze discussion

💬 Engage with your favorite top creators

👍 See what interests you

Trending Topics

Gate Money Officially Launches

3.45k Views12.87k Discussing

Gate officially launches Gate Money, a global integrated financial services app that brings digital assets, fiat, stocks, ETFs, gold, bank accounts, and payments into one Gate App. Users can manage assets, invest, send and receive funds, convert currencies, and make payments — all from a single account. Which use case are you most excited about? [👉 Learn more](https://www.gate.com/announcements/article/102094)

Fed September Minutes Lean Hawkish

64.16k Views2.72k Discussing

Samsung Q3 Operating Profit Surges 782.5%

36.91k Views1.93k Discussing

View More