Square
Following
Hot
News
Notifications
Profile
Share your thoughts
placeholder
Article
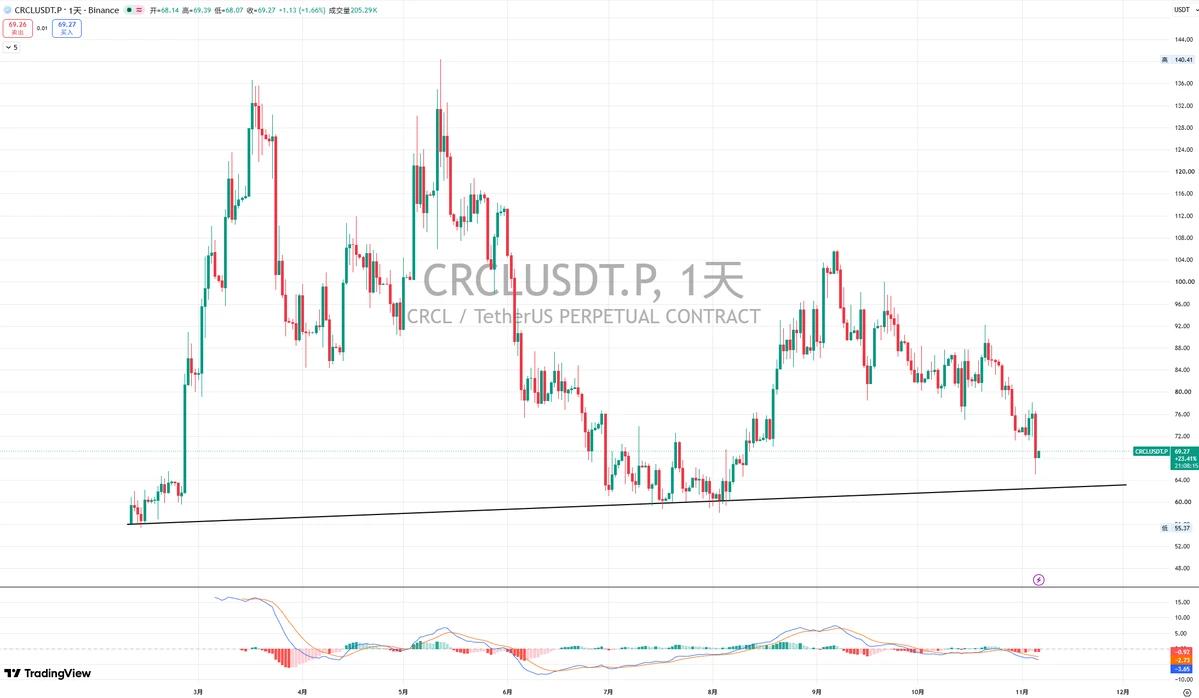
$CRCL
CRCL, the parent company of the USDC stablecoin
After following this wave of declines, it has finally reached the ideal entry range of 68–65 that I mentioned in October! The short-term low was 64.8. I’m not sure whether it will fall further, but this is a great buying range!
Enter a long-term position and be prepared to hold it for the long term!
post-image
CRCL-8.69%
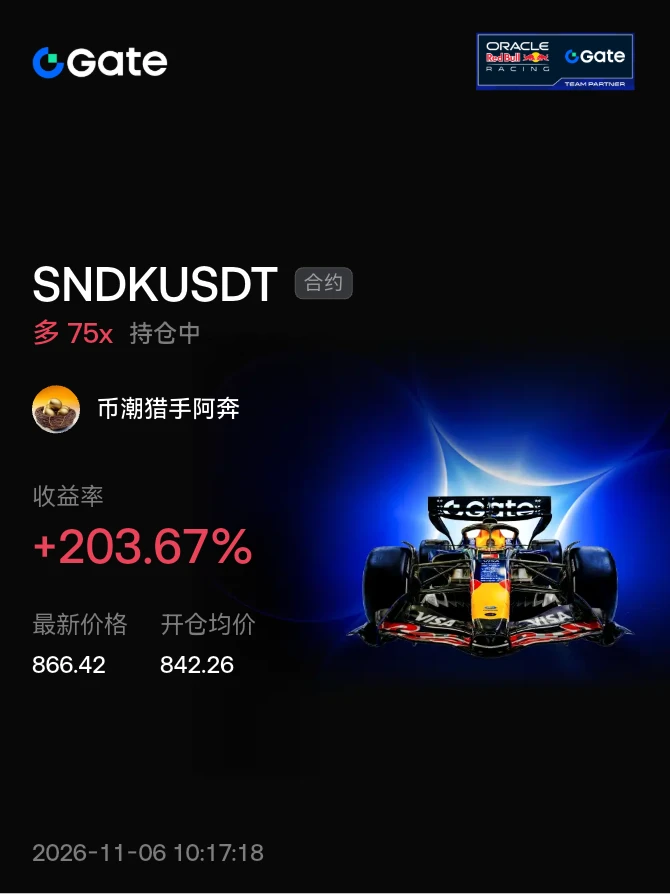
#晒出我的持仓收益 Move the stop-loss into profit; continue going long on pullbacks. A short-term double bottom has formed
post-image
Trenches
ZIG
Z
bade
b
ZIG
0x8c...1145
Market Cap
$.
Change
.
24h Vol
$.
Holders
.
BTC
B
bade
b
BTC
C5xp...pump
Market Cap
$.
Change
.
24h Vol
$.
Holders
.
CORLA
C
bade
b
CORLA
0xba...7777
Market Cap
$.
Change
.
24h Vol
$.
Holders
.
STONK
S
bade
b
STONK
6GmA...UNgx
Market Cap
$.
Change
.
24h Vol
$.
Holders
.
DESSA
D
bade
b
DESSA
npz2...pump
Market Cap
$.
Change
.
24h Vol
$.
Holders
.
Don't be afraid, U.S. stocks will be great again. Trump is about to step in to rescue the market...$SNDK $SPCX
post-image
SPCX+0.78%
I'm so tired, I'm so tired, I'm so tired, I'm so tired, I'm so tired, I'm so tired, I'm so tired, I'm so tired, I'm so tired, I'm so tired, I'm so tired, I'm so tired, I'm so tired. I'm really tired, I'm completely exhausted. How are you supposed to trade this dogshit market? How are you supposed to trade this market? How are you supposed to trade this market? How are you supposed to trade this market
post-image
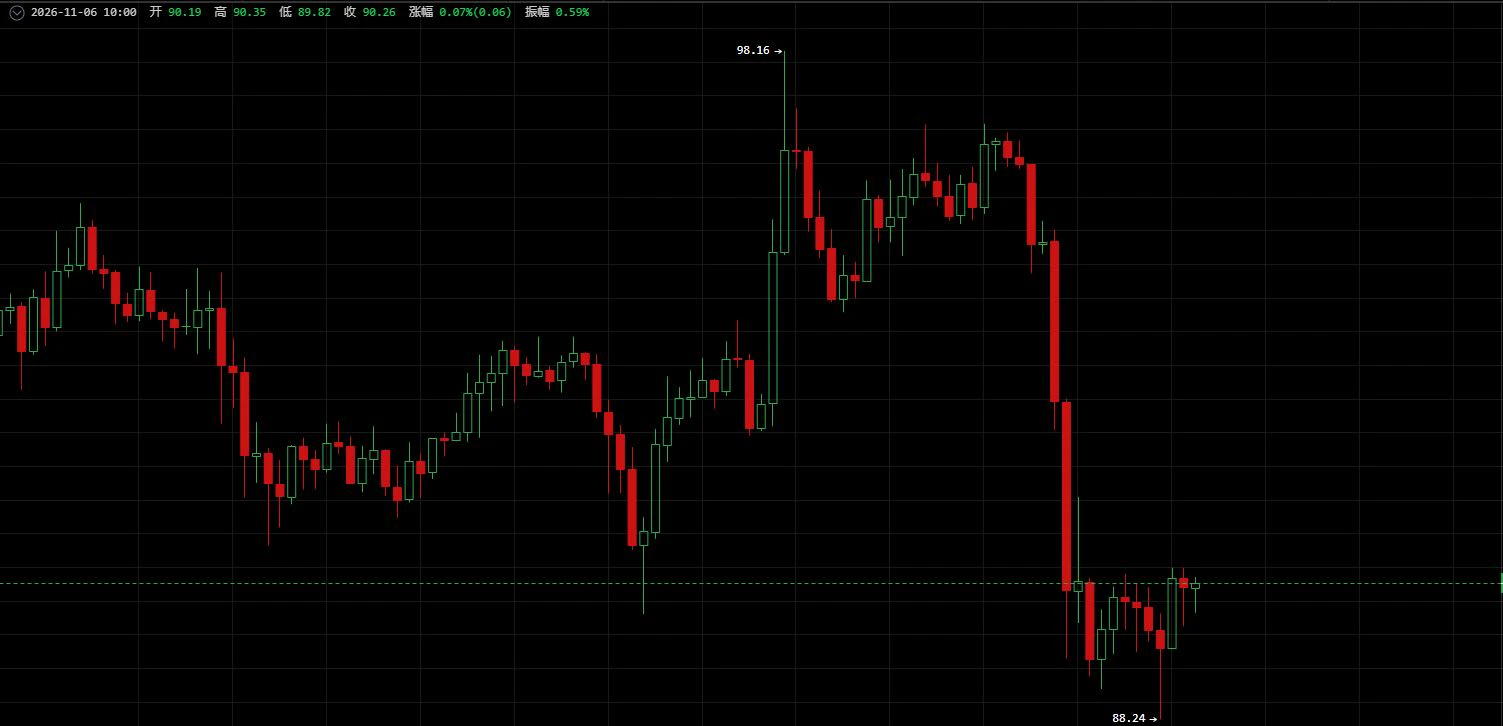
November 6 $SOL The Nasdaq’s plunge dragged tech and growth stocks broadly lower. October nonfarm payroll data is due tonight, and market sentiment is cautious; the focus is on shorting rallies.
【Today's Strategy】
Short entry zone: Set up positions on a rebound to 92.5—93.5
Stop-loss: Above 94.5
Take-profit: 90.0—88.5
【Key Rationale】
A sharp, one-way selloff on heavy volume at the hourly level has put bears in control in the short term. 92.5–93.5 is a former breakdown level turned resistance zone, with concentrated selling pressure from trapped holders. Below, 88.0–88.5 is a previous low and s
post-image
SOL-0.77%
NAS100-0.07%
💰 Your stock insights deserve rewards—and to be seen
What signals do you look for when you’re bullish on a company? What concerns make you decide to keep waiting?

Join Gate Square’s stock discussion season to share your views and the reasoning behind them.
🌟 Each day, 3 quality creators will be selected to receive 5 USDT each, plus official featured placement to help more people see their valuable content.

Selection isn’t based on correctly predicting price movements or the number of posts. Well-supported opinions, valuable observations, and thoughtful reviews all have a chance to be selec
post-image
  • 4
  • 2
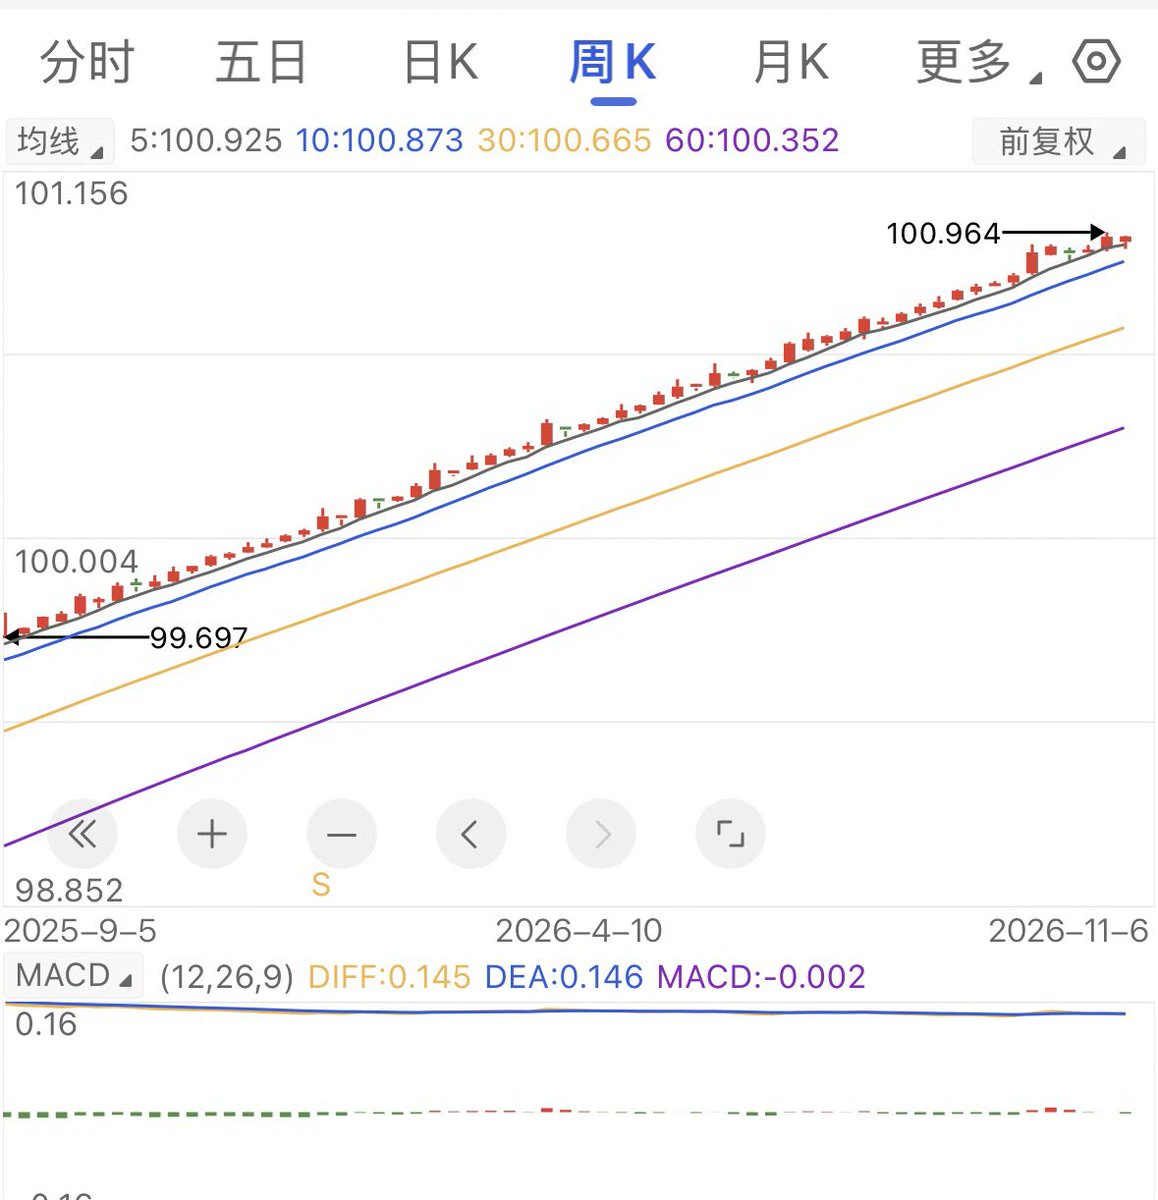
Who says the stock market is all down?
Just look at this weekly chart 🫣
post-image
🔹Why Did U.S. Stocks Suddenly Plunge at the Open? Sell Orders Flood In While Buyers Struggle to Kee
live-cover
LIVE2,339
Brother Ma @elonmusk, give me some tokens. I can't take it anymore. Please, bro, just a little. I won't touch it again, I swear. Please, bro. Really, just a little. I swear I'll never touch this stuff again. I can't take it anymore, bro. I'm tossing and turning and can't sleep. Bro, I'm begging you, just give me a little. Give me some more, bro. I can't take it anymore. Please, bro, I feel like ants are crawling all over me. I feel like my whole body is shaking. I can barely breathe. Please, bro, just a little. I won't touch it again. Please, bro. Really, just a little. I swear I'll never touc
post-image
TOKEN-0.16%
#AsiaPacificStocksPlunge

Today is Friday and here we see Asia Pacific Stocks affected by American market crash , $SKHYNIX down and dropped almost $800 dollar ! This is really big happens … Now all market needs to recover !
post-image
SKHYNIX+1.41%
11.6 Bitcoin Public Trading Outlook
【Short Strategy】$BTC
  Entry range: around 785-792
  Stop-loss: 796
Take-profit targets
  First target: 776
  Second target: 768
Third target: around 760
Fourth target: below 752

Factors: Price is near the lower Bollinger Band, with a short-term bearish bias. MACD is below the zero line, while market depth shows longs in the majority. Large institutions may be holding more spot and opening short futures positions to hedge, with open interest rising. However, selling and adding to positions in the short term can help avoid pullback r
BTC-0.65%
ETH-1.23%
☀️ GM! The market suddenly hit the brakes—what signal will tonight’s nonfarm report flash? 🚦
The Nasdaq plunged 5.52% last night, while BTC pulled back to around $76K . The U.S. nonfarm payrolls report is due out tonight at 21:30. 👀

📌 Today’s featured topic: How will you adjust your trading strategy ahead of the nonfarm report?
🔴 Risk watch: Will U.S. stocks and BTC remain under pressure?
🟡 Waiting for confirmation: What changes could the nonfarm report bring?
🟢 Looking for opportunities: Are there any assets worth watching in this pullback?

🎁 Come share your nonfarm predictions and t
post-image
NAS100-0.07%
BTC-0.67%
  • 13
  • 7
NEW STREAMER(Market Update)
live-cover
LIVE1,420
When BTC Shows Bearish Divergence, Does It Mean a Drop Is Coming?

In BTC technical analysis, bearish divergence is often seen as an early warning that an uptrend may be weakening. But many traders rush to short as soon as they spot bearish divergence, only to see the price keep rising instead of falling and ultimately get caught on the wrong side of the move.

So how should you interpret bearish divergence?

First, understand the basic principle. When the BTC price keeps making new highs, but the highs on the RSI or MACD indicators gradually decline, bearish divergence may be forming. This me
post-image
BTC-0.67%
📢 Signal Card | Reposted from Aesthetic_Meow
Just reposted TA’s $LYN order today, and now another $PARTI long position is here—so diligent👀
- Time: Not specified- Entry: 0.04769- Targets: 0.048131 / 0.048366 / 0.048572- Stop-loss: 0.047102
Sis just shares updates; no predictions or trade calls. Whether to follow and how much to invest is up to you, babe—don’t get carried away😤
Personal record shared for reference; not investment advice. #How far is Oklo’s nuclear power supply strategy from commercialization?
LYN-0.44%
PARTI-1.06%
OKLO-13.18%
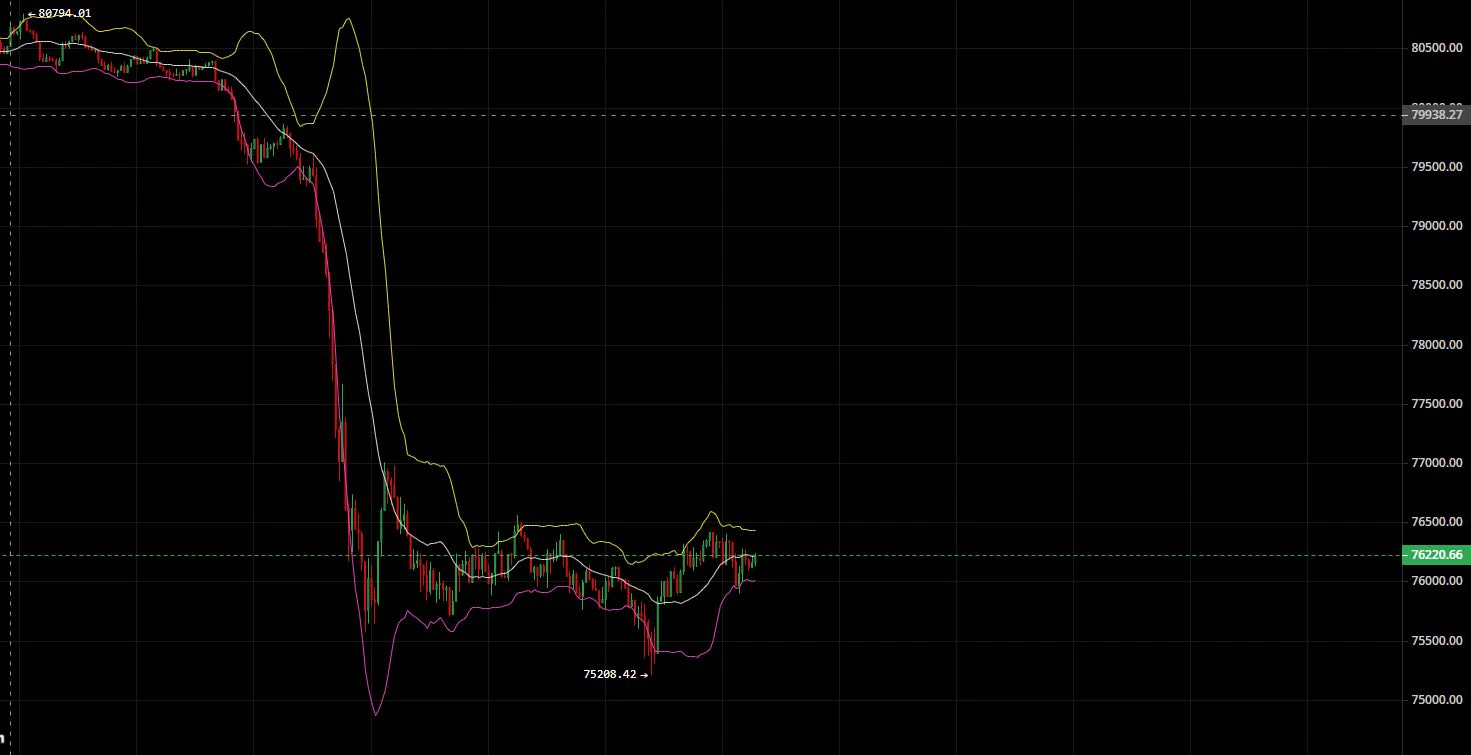
10.11 Bitcoin Silk Road
$BTC ‌#美股史诗级抛售

### Market Analysis

has undergone a rapid primary bearish impulse wave. At 75208, signs of waning bearish momentum emerged, followed by a secondary sideways consolidation within the downtrend framework. Bollinger Band width continues to contract, and short-term volatility remains compressed, bringing the market to a directional decision point. Price is currently trading near the Bollinger midline, with no bottom-reversal structure established yet. The overall trend center of gravity continues to move lower, and this rebound is a corrective move within
post-image
BTC-0.65%
Zecusdt Voucher applied market is in bearish mod lets see whats happen ?
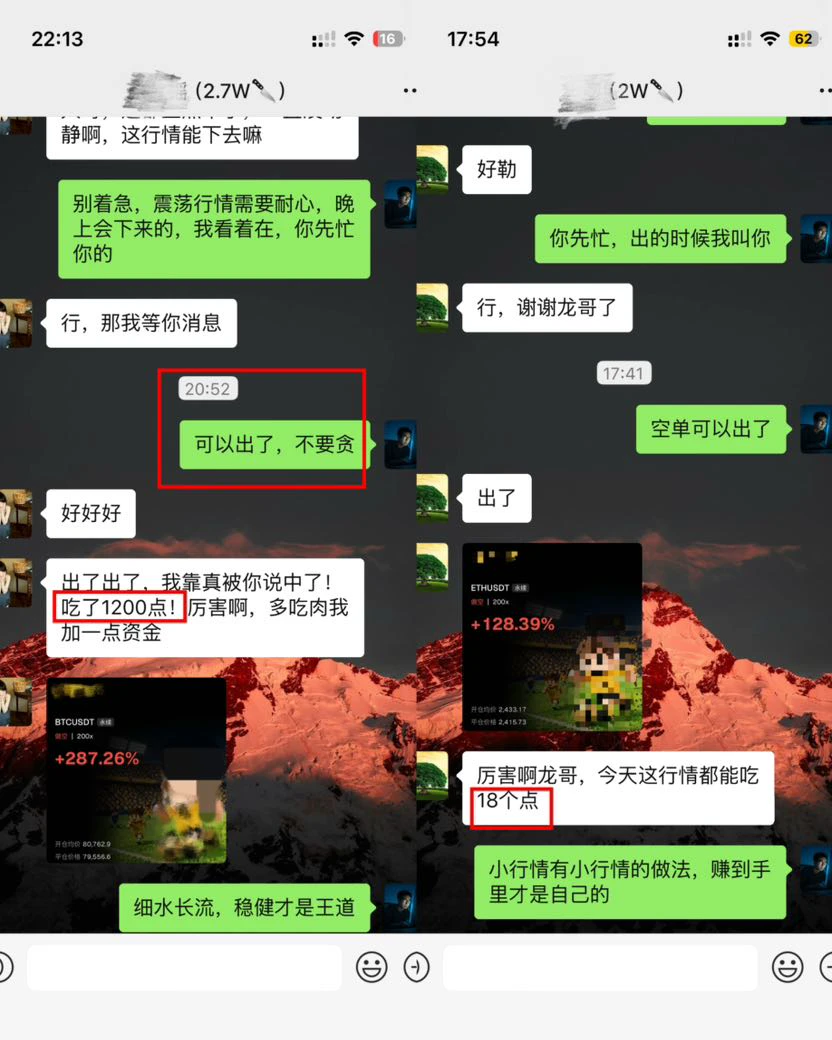
Yesterday, the BTC short banked 1200 points, and the ETH short banked 18 points. The market never runs out of opportunities; profits are the receipt for execution.

Get the timing right and execute well, and making money comes naturally.
While others are still waiting on the sidelines, those who followed along are already sitting back and counting their profits!#BTC #ETH #美股史诗级抛售
post-image
BTC-0.65%
ETH-1.23%
When can I own a coin like this?@elonmusk
post-image
【Yunxiang Research Institute · Guanlan | Nov. 6 Intraday A-Share Market Commentary】
Major indexes weakened in tandem, with the Shanghai Composite testing the 3,600 support level.
Shanghai Composite 3633.79 (-1.52%), ChiNext Index -3.57%; 229 advancers and 2109 decliners, a decline-to-advance ratio of approximately 9.2:1, indicating a marked contraction in risk appetite.
Shanghai Composite: 3600–3610 is the first support zone. A close below this range on higher volume would put 3574 in focus as the next area to watch. 3680–3700 is resistance on a rebound; a return above this range would signal
post-image
Load More

Join 40 M users in our growing community

⚡️ Join 40 M users in the crypto craze discussion

💬 Engage with your favorite top creators

👍 See what interests you

Trending Topics

USStocksFaceHistoricSelloff

586 Views3.46k Discussing

U.S. stocks suffered a sharp selloff on Thursday, with the Nasdaq closing down more than 5% and the Philadelphia Semiconductor Index falling over 12%. AI and chip stocks including $NVDA and $AMD were hit especially hard. Markets are reassessing AI valuations, data-center spending and future returns. Is this just short-term deleveraging, or the start of a deeper correction in the AI trade? Which sectors are you watching next?

GateLaunchesPoSECProofOfSecurity

11.51k Views563 Discussing

USNonfarmPayrolls

8.95k Views3.97k Discussing

View More