
Square
Following
Hot
News
Notifications
Profile
Share your thoughts
placeholder
Article
Bitcoin has fallen to around 55,000, and many people feel it’s starting to look like good value.
Market sentiment is sharply divided: some are certain it’s unlikely to fall much further and is more or less at the bottom; others are bearish, calling for a drop to 40,000.

At the end of the day, these are all bets—there’s no absolutely correct answer.
One of the market’s cruelest realities is that many market moves we subjectively regard as “definitely not impossible” often turn out to be traps that leave bold, leveraged traders completely wiped out.

Remember WTI crude oil on April 20, 2020? Th
post-image
BTC-0.67%
$PIEVERSE I've been swinging my big sword, waiting for you for two weeks
post-image
PIEVERSE+0.58%
  • 2
Trenches
IDOL
I
bade
b
IDOL
0x3b...ab07
Market Cap
$.
Change
.
24h Vol
$.
Holders
.
PIEVERSE
P
bade
b
PIEVERSE
0x0e...25a9
Market Cap
$.
Change
.
24h Vol
$.
Holders
.
JAGENT
J
bade
b
JAGENT
0x8e...ae15
Market Cap
$.
Change
.
24h Vol
$.
Holders
.
Singularity
S
bade
b
Singularity
7R4M...pump
Market Cap
$
Change
.
24h Vol
$.
Holders
.
CLAUDIA
C
bade
b
CLAUDIA
2j5S...W2ZM
Market Cap
$.
Change
.
24h Vol
$.
Holders
.
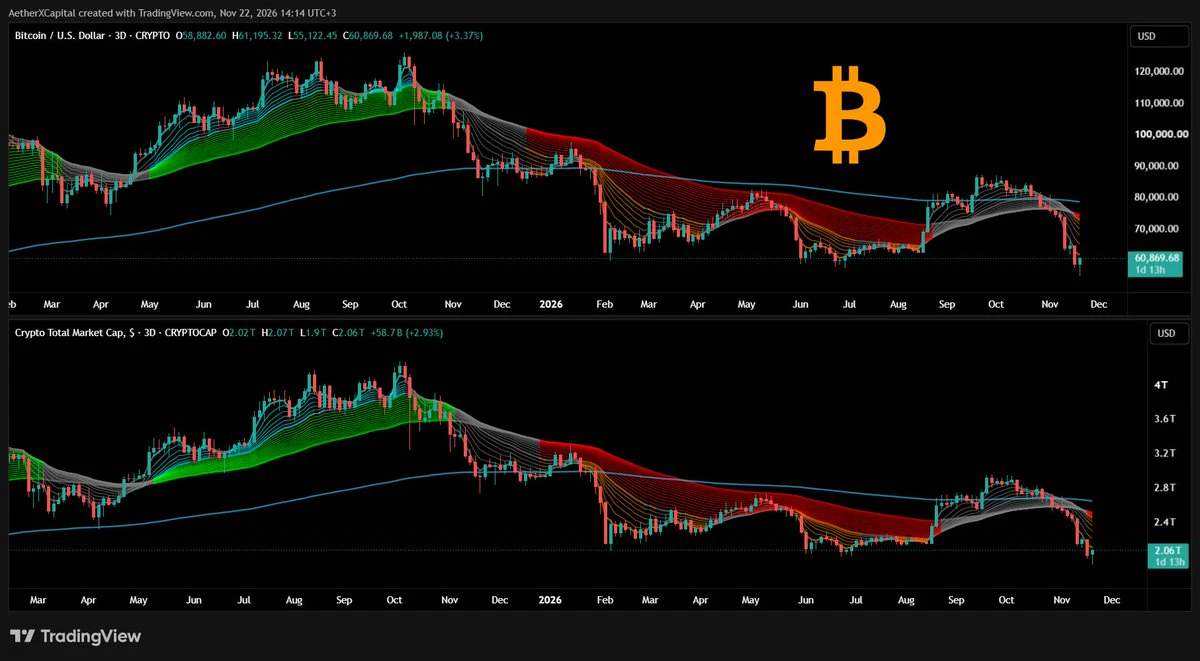
The SuperGuppy indicator has turned bearish on $BTC and TOTAL on the 3-day time frame.
It's one of those indicators that can't be ignored even if it points out something you don't want.
post-image
BTC-0.67%
#ETH
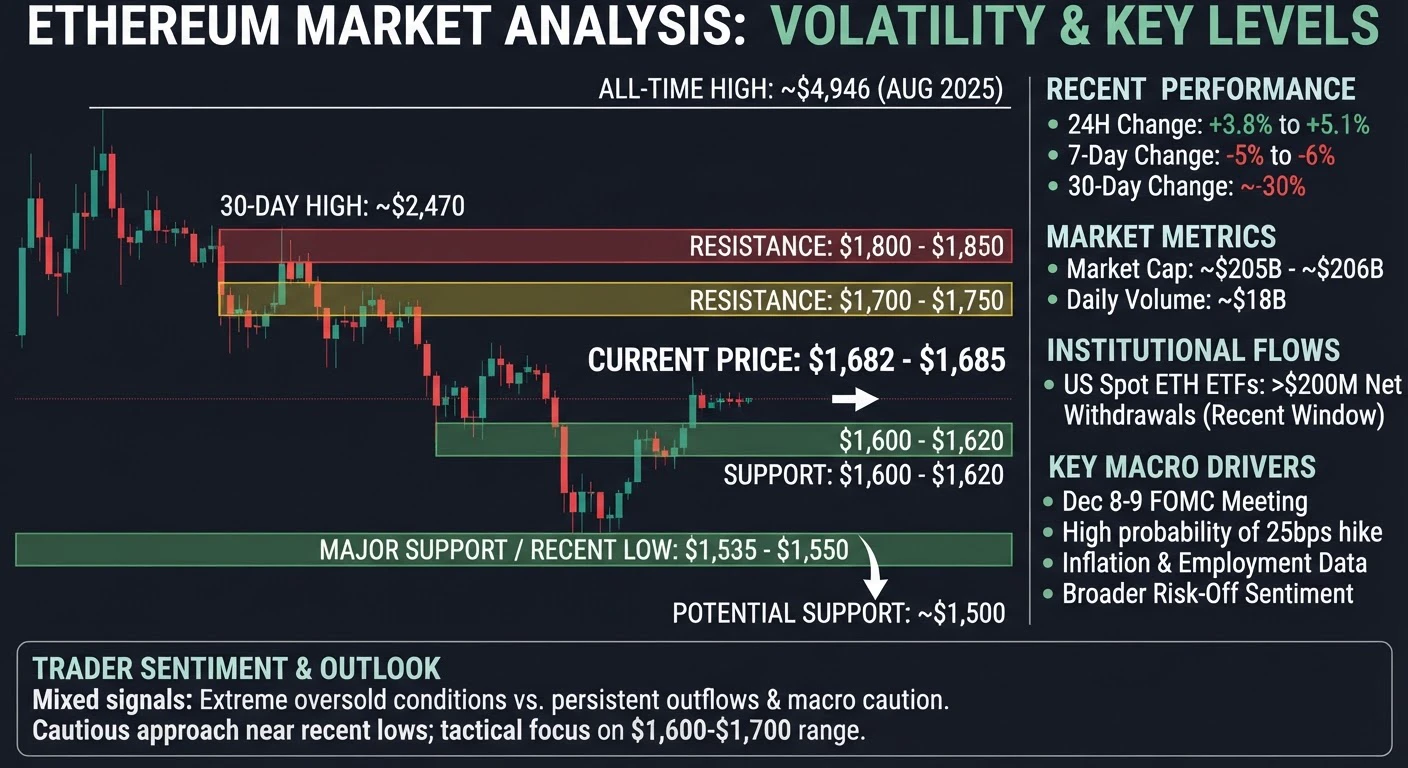
Ethereum currently sits near 1,682 to 1,685 dollars after climbing roughly 3.8 to 5.1 percent over the past 24 hours from levels that had briefly dipped as low as 1,535 to 1,550 dollars. That rebound follows a sharp multi-day slide that left the asset down approximately 5 to 6 percent on the week and nearly 30 percent across the past 30 days, with the 30-day range stretching from highs near 2,470 dollars down to the recent trough. On a one-year basis Ethereum has declined around 39 to 44 percent, and it now trades roughly 66 percent below its all-time high of approximately 4,946 dollars
post-image
ETH-9.05%
BTC-0.67%
#SKHynix #WCTCS9 #ShareWeekly
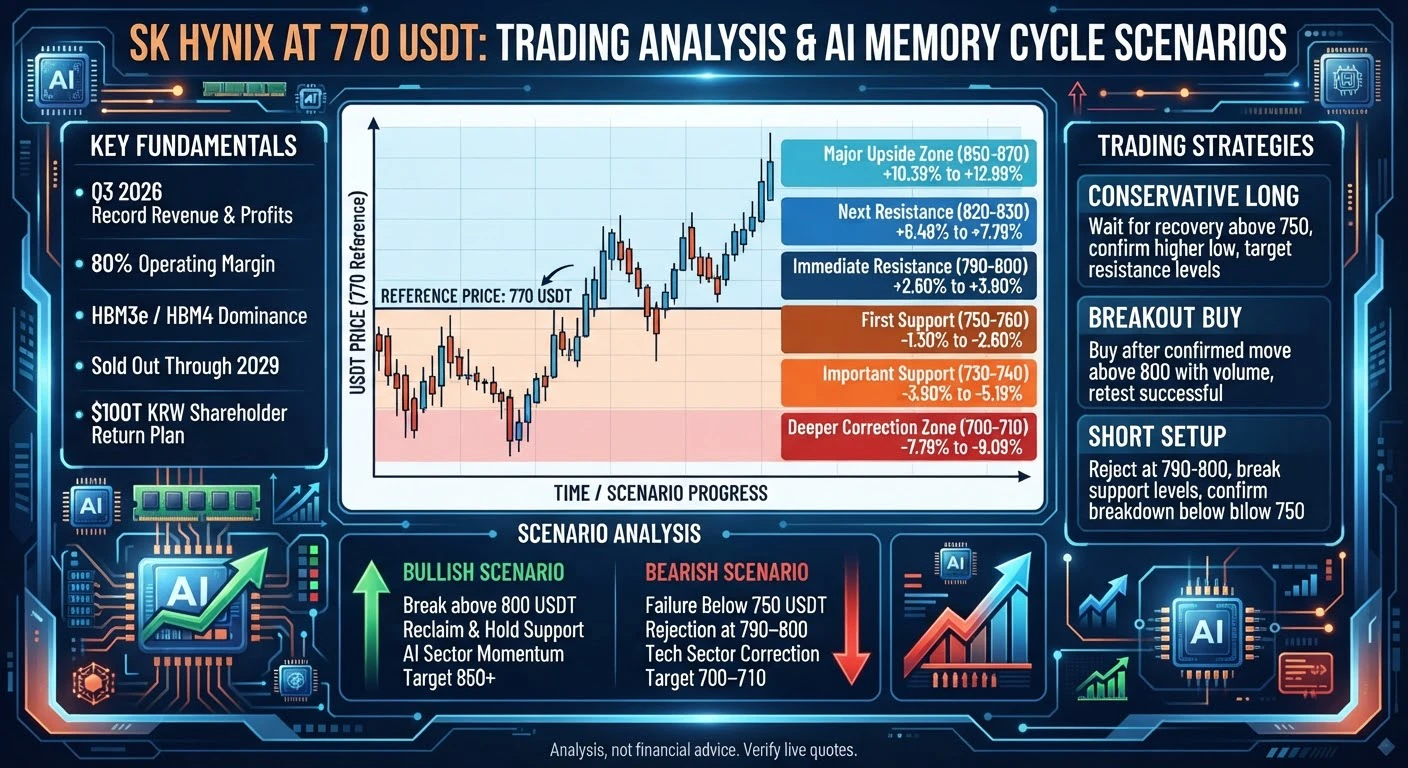
SK HYNIX AT 770 USDT: Is This a Buying Opportunity or a Warning Signal? Full Market, AI Memory, HBM, Fundamental and Trading Strategy Analysis

SK hynix is standing at the centre of the global AI memory story, but strong business performance does not mean its share price can only move upward. At the reference price of 770 USDT supplied for this analysis, the key question is whether the recent weakness represents a temporary correction inside a powerful semiconductor cycle or the beginning of a deeper valuation reset. My approach is to separate the company's opera
post-image
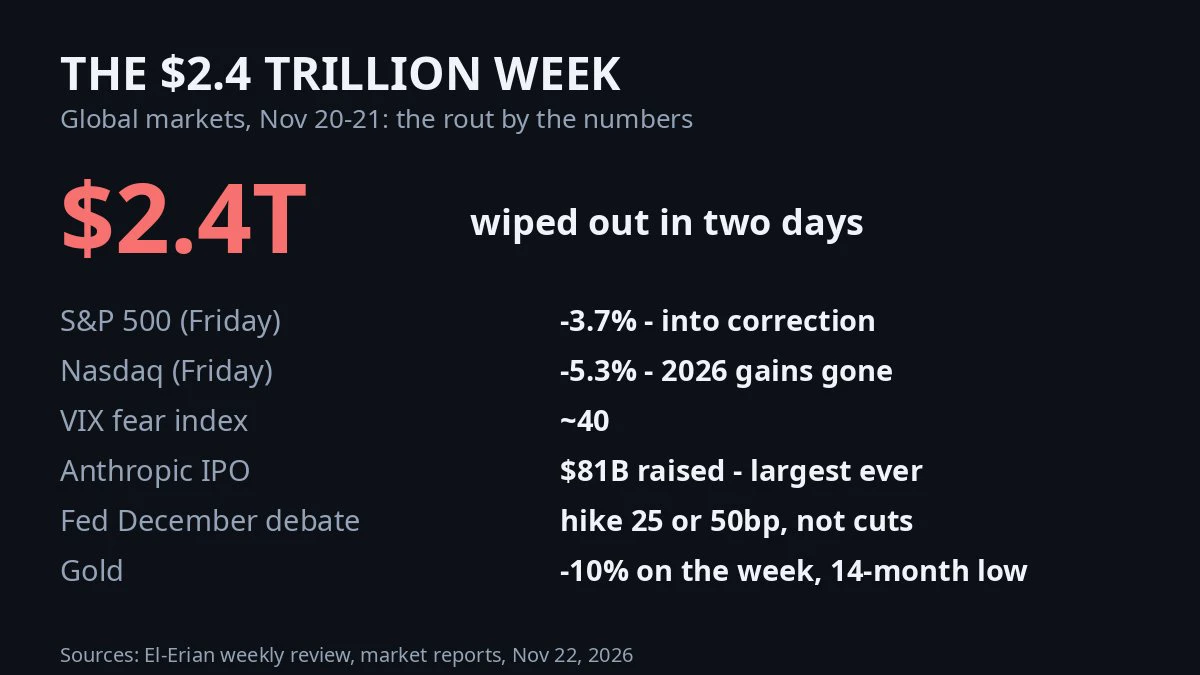
$2.4T gone in 2 days. S&P in correction, Nasdaq -5.3% Friday, VIX ~40. The trigger nobody names: the biggest IPO ever. Anthropic's $81B deal made every portfolio sell to make room. The IPO didn't join the market, it drained it. The Fed debates hiking 25 or 50.
post-image
SPX+0.33%
ANT-8.68%
🔥 GATE.IO ⚡ | CRYPTO MARKET ALERT | WHATS NEXT FOR BTC? 📊🚀
live-cover
LIVE2,176
BTC-0.67%
SOL-0.77%
ETH-1.26%
#GateLeadsRWAPerpExpansion

WHY BIG TRADING VOLUME ALONE DOES NOT TELL THE WHOLE STORY IN RWA PERPETUALS

A common myth in derivatives markets is that whichever exchange posts the biggest raw trading volume automatically has the deepest liquidity or the stickiest traders. In reality, real-world asset (RWA) perpetuals—contracts without an expiration date that track assets like stocks, commodities, or indices—are shaped by how positions stay open, how order books hold up under stress, and how quickly new themes emerge. Tracing the timeline of key milestones shows how Gate built its footprint in
post-image
XAU+0.38%
XAG+0.47%
SPCX+0.20%
CHIP+3.52%
GT-2.41%
$NAS100 ‌
NAS100 Market Analysis: The Calm Before the Breakout

Current Price: 25,584.18
The NAS100 has experienced a sharp sell-off, dropping from highs near 27,755 down to a low of 24,898. Since hitting that bottom, price action has compressed significantly, forming a textbook pattern that traders need to watch closely.

Chart Analysis & Context

1. The 4-Hour Chart (Macro View)

Looking at the 4-hour timeframe, the index is currently in a consolidation phase following a strong bearish impulse.

· The Pattern: We are seeing a Symmetrical Triangle (or a pennant) formation. The price is squee
NAS100-4.60%
  • 3
  • 2
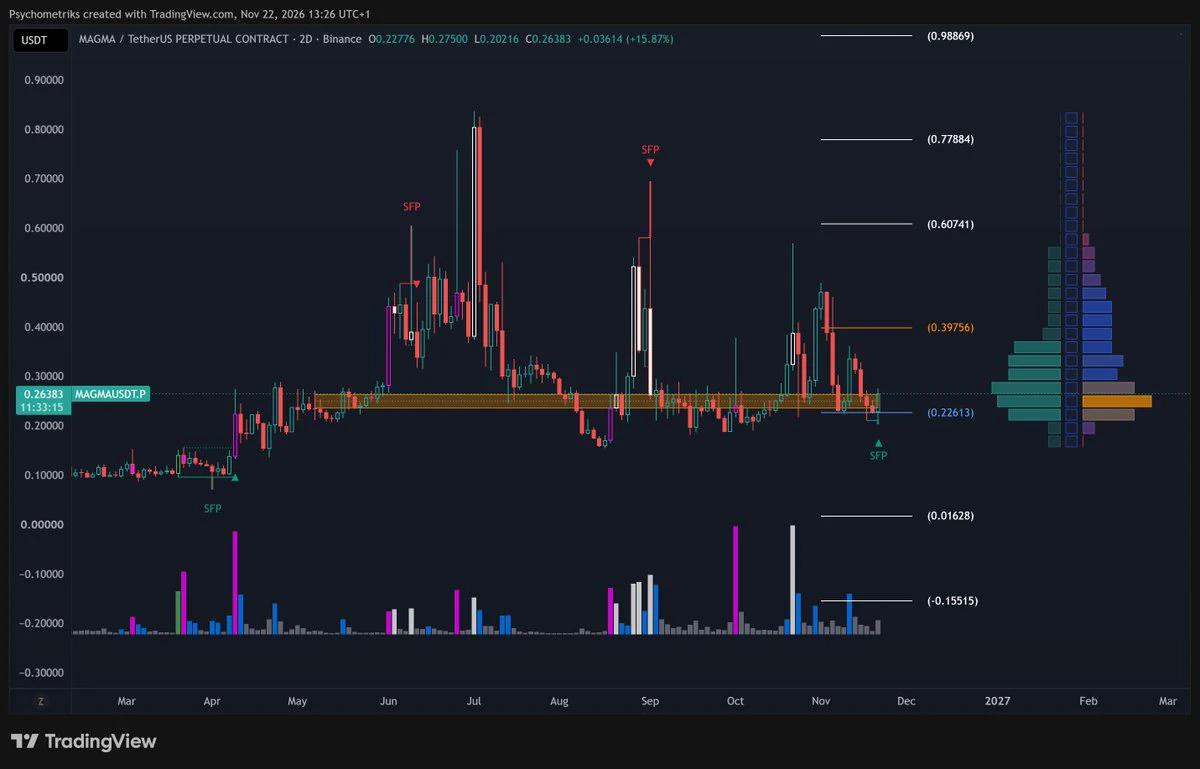
magma-finance:native volcano #MagmaBoi
post-image
MAGMA-0.57%
#BTCReboundFaces60KTest As we all stare at our screens, wondering, "How much further will this decline go?" the roughly 20% drop in the QQQ over the last six weeks is, understandably, alarming. Yet, history consistently whispers the same truth: sharp downturns are often followed by rapid and robust recoveries—provided that the long-term fundamentals remain sound.

Instead of panicking, let’s examine similar market crashes from the past alongside the realities of today.

Does History Repeat Itself?

Looking at the history of the QQQ, the recoveries that followed comparable sharp declines are st
QQQ-5.78%
QQQG+0.05%
SOXL-33.34%
NDAQ-0.95%
NAS100-4.60%
  • 3
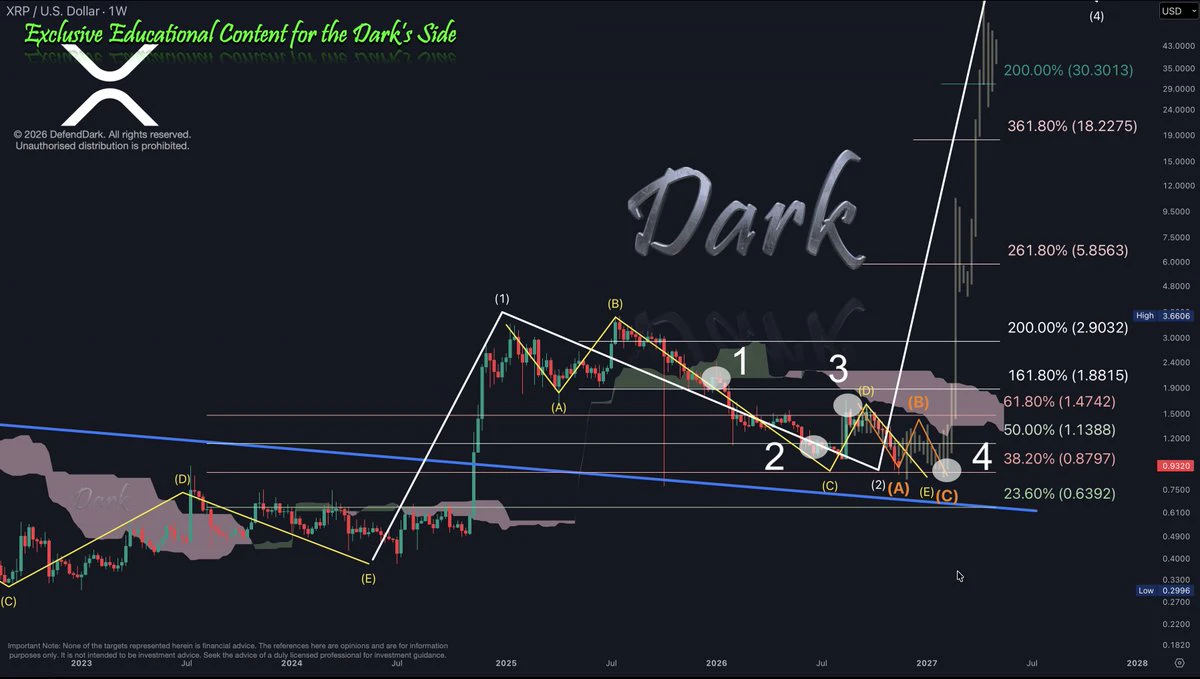
$XRP Weekly – the hardest correction, in four points
1. The flat was complete. ABC Wave from the Wave 1 top, done by the book.
2. The Wave C expanded. The regular flat became an expanded flat, down to $0.9852. Same three letters, a longer last leg.
3. The run to $1.6992. We called it a new wave, on one condition: the pullback had to keep $1.
4. $1 broke. So that run told us ABC wanted to further expand technically. We named our Wave 1 as Wave D when $1 can't hold, and we are now in Wave E.
ABCDE instead of ABC. Two moments that looked like the end, before the real one arrives.
What didn't chan
post-image
XRP-1.15%
maybe fartcoin does have product market fit after all
post-image
FARTCOIN-1.14%
Was this photo taken well?🌇
post-image
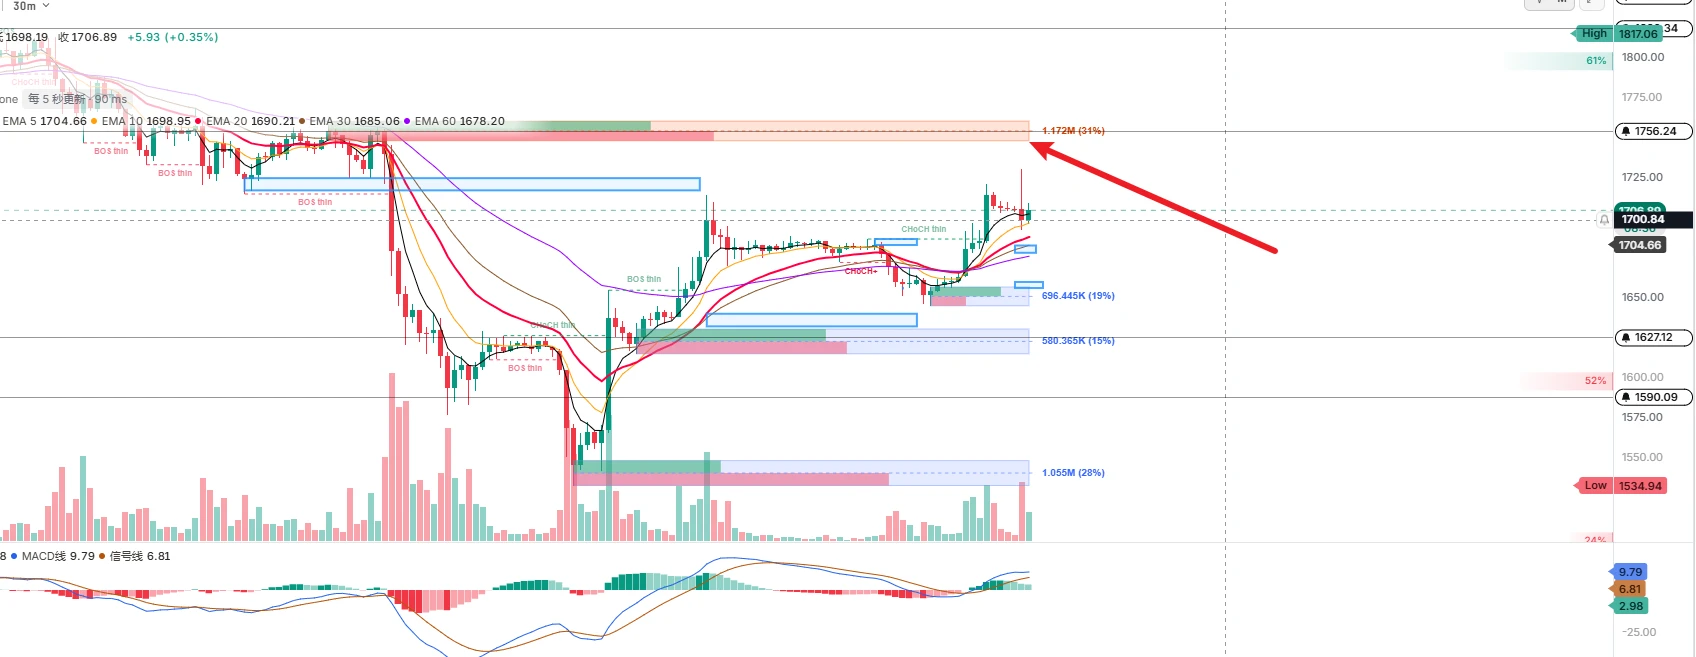
$ETH Place limit orders around 1750-1760, with a stop-loss at 1800
This is a resistance level, so you can try opening a short position. If you like this, give me a follow
post-image
ETH-1.23%
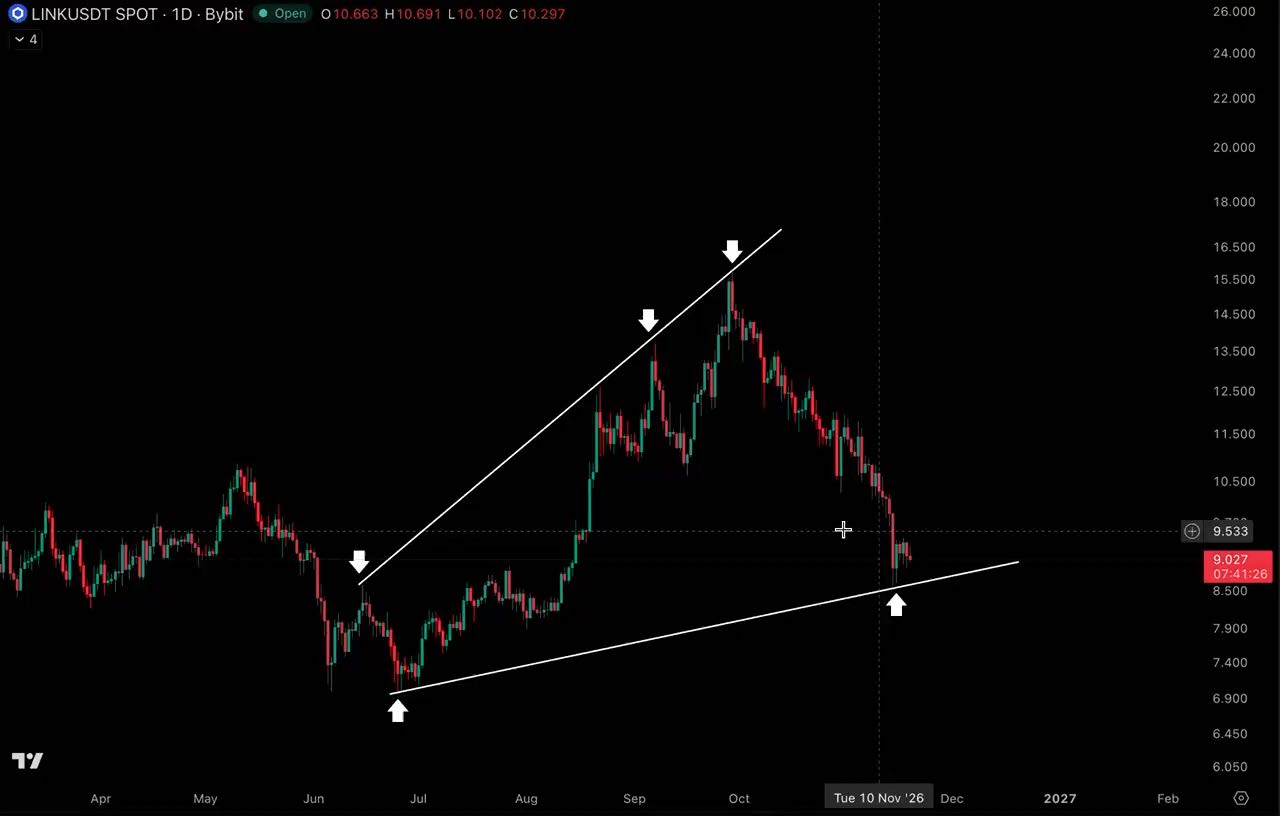
months of higher lows, multiple successful retests, and now $LINK is back at support

would be a shame for bears if buyers defend this one again
LINK-0.18%
Afternoon Market Updates
live-cover
LIVE4,259
ETH-1.26%
BTC-0.67%
SOL-0.77%
ZEC+1.16%
HYPE+0.24%
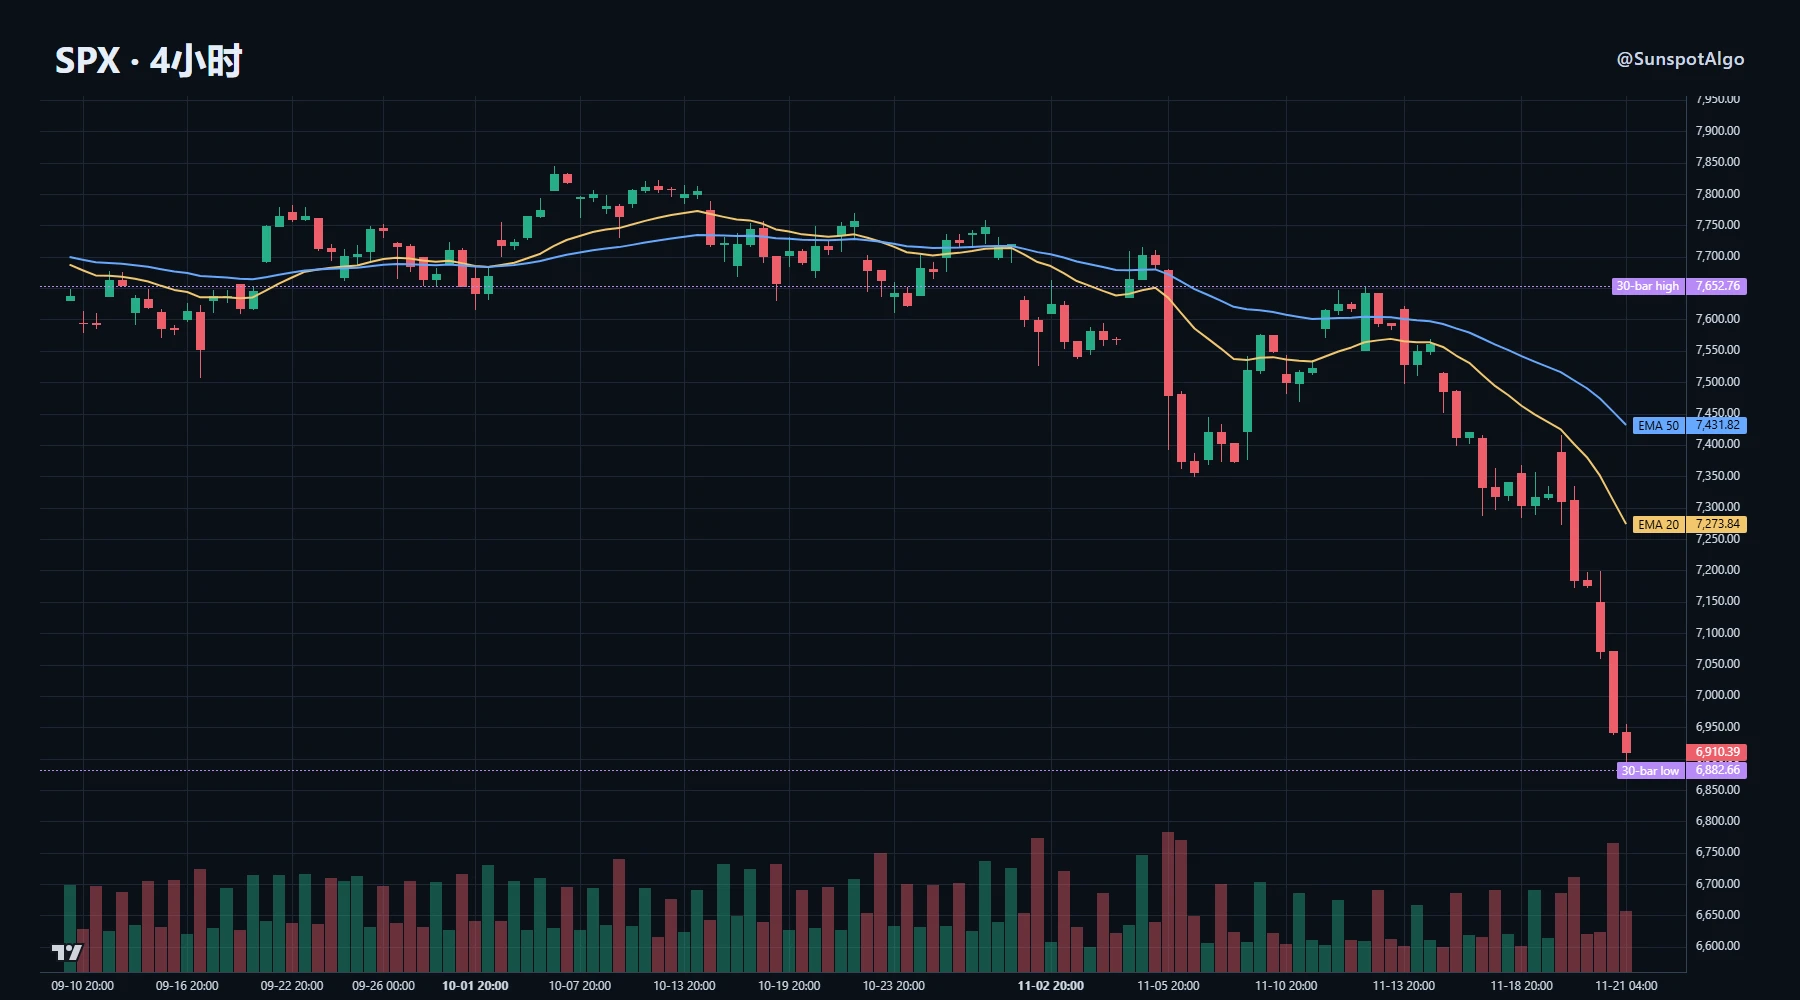
First, the pace. The S&P 500 fell 8.6% this week, dropping to around 6,900, right at the bottom of its 30-day range. On a daily basis, the Nasdaq led losses at -5.6%, the fear index surged to 35.9, and even gold and silver were sold off.

The most unusual part of the move was gold and silver—safe-haven assets—falling in sync with stocks. That’s what a liquidity squeeze should look like. But when you look at the dollar and U.S. Treasuries, the picture doesn’t line up: the Dollar Index is flat at 103.8, the 10-year Treasury yield has fallen to 4.91%, and safe-haven flows are still buying bonds.
post-image
SPYX+0.01%
SPX+0.33%
NAS100-0.07%
GLDX-0.40%
PAXG+0.37%
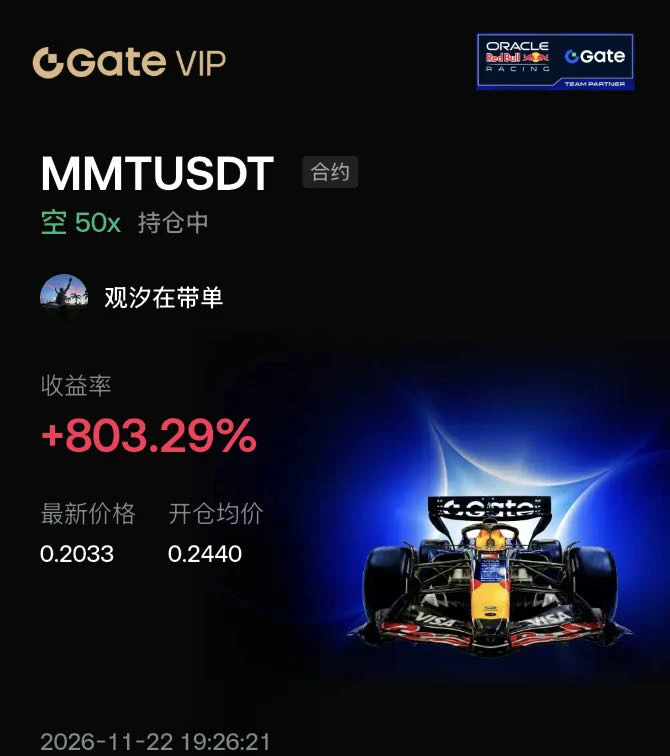
🚀 MMTUSDT Short Trade Pays Off! 50x Leverage Racks Up 800% Returns!
$BTC
Friends, this MMTUSDT short trade was as smooth as a Red Bull race car! Just look at the chart: we decisively opened a short at 0.2440, and the price has now plunged to 0.2033, bringing returns to +803.29%!
$EVAA
After its explosive rally, MMT became severely overbought, and a bearish moving average crossover was confirmed on the 4-hour chart, signaling a clear downtrend. We precisely entered short at the high of 0.2440, taking advantage of the weak rebound and confirmed crossover.
$AKE
The first support level to watc
post-image
BTC-0.65%
EVAA-0.42%
AKE+6.39%
  • 2
Load More

Join 40 M users in our growing community

⚡️ Join 40 M users in the crypto craze discussion

💬 Engage with your favorite top creators

👍 See what interests you

Trending Topics

BTCReboundFaces60KTest

2.1M Views30.1K Discussing

BTC rebounded from around $55,300 on November 21, briefly reclaiming $60,000 before pulling back to around $59,300. The $60K level is back in focus as traders assess whether the recovery can last. Is this rebound a sign of stabilization or a short-lived recovery? Would reclaiming and holding $60K be enough, or do you need confirmation from trading volume and fund flows?

PCEAndGDPDataNextWeek

259.4K Views2.6K Discussing

GateDirectIPOPhase3ANTAllocates92100Shares

834.6K Views5K Discussing

View More