Square
Following
Hot
News
Notifications
Profile
Share your thoughts
placeholder
Article
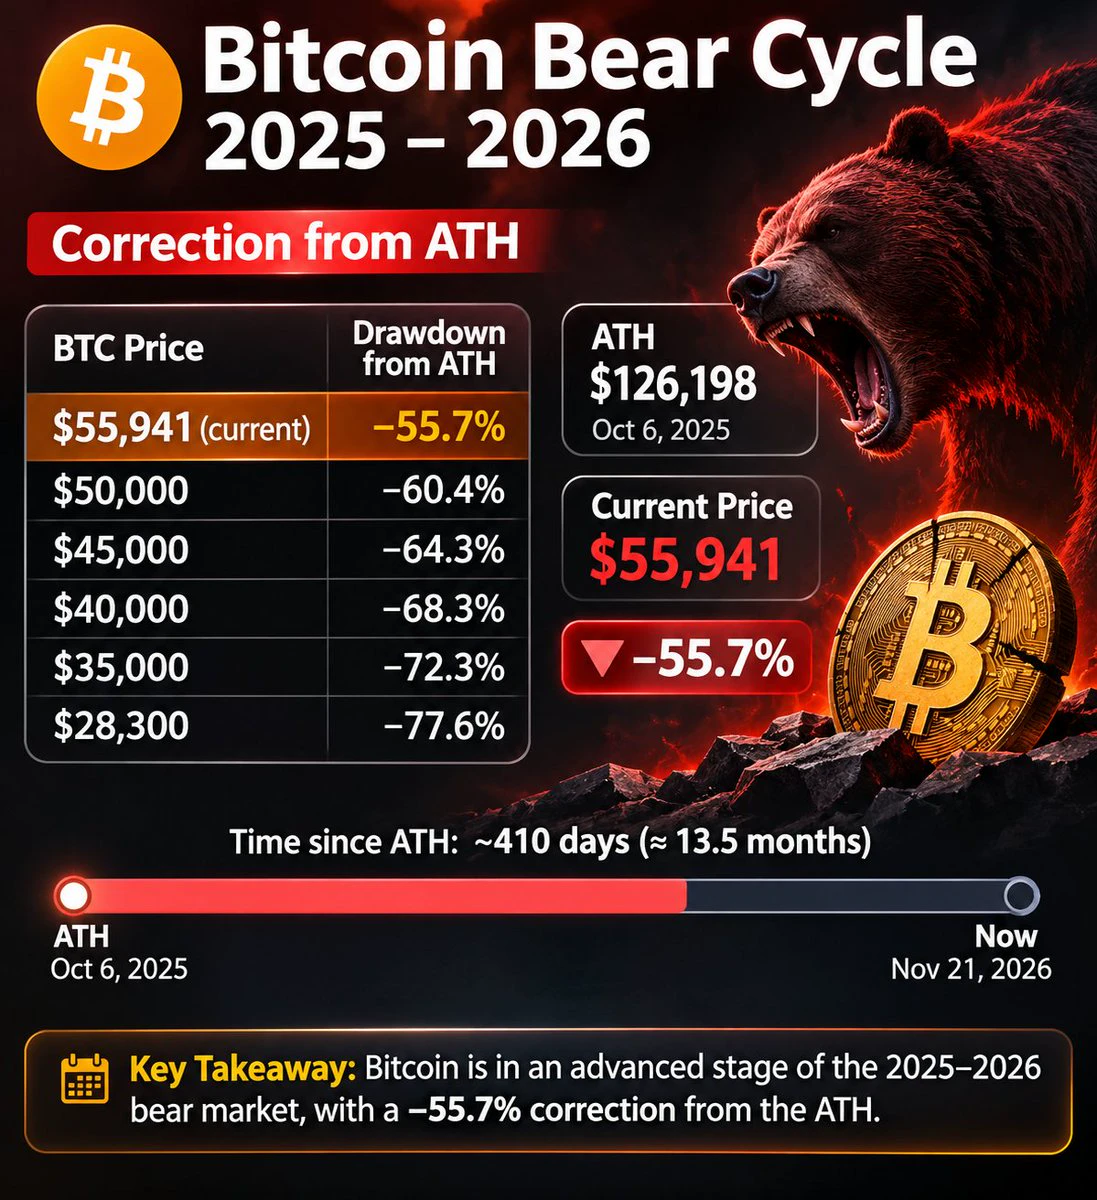
After all bullish plans were scrapped, what’s next for Bitcoin? People who were calling for a rally just two weeks ago have basically gone quiet. Yesterday Bitcoin was still at 62,000; today it plunged as low as around 55,600 before recovering to 58,268. The most infuriating part of this drop isn’t how far it fell, but that it hasn’t given us a single decent bounce—it rises above all the moving averages, then turns right back down, even kicking open the door to a new low.
First, the data (CoinGecko, around 15:25 on 2026-11-21): - BTC $58,268, 24h −5.70%, 7d −13.75%, market cap around $1,172B,
post-image
BTC-0.67%
ETH-1.26%
BNB-0.76%
SOL-0.77%
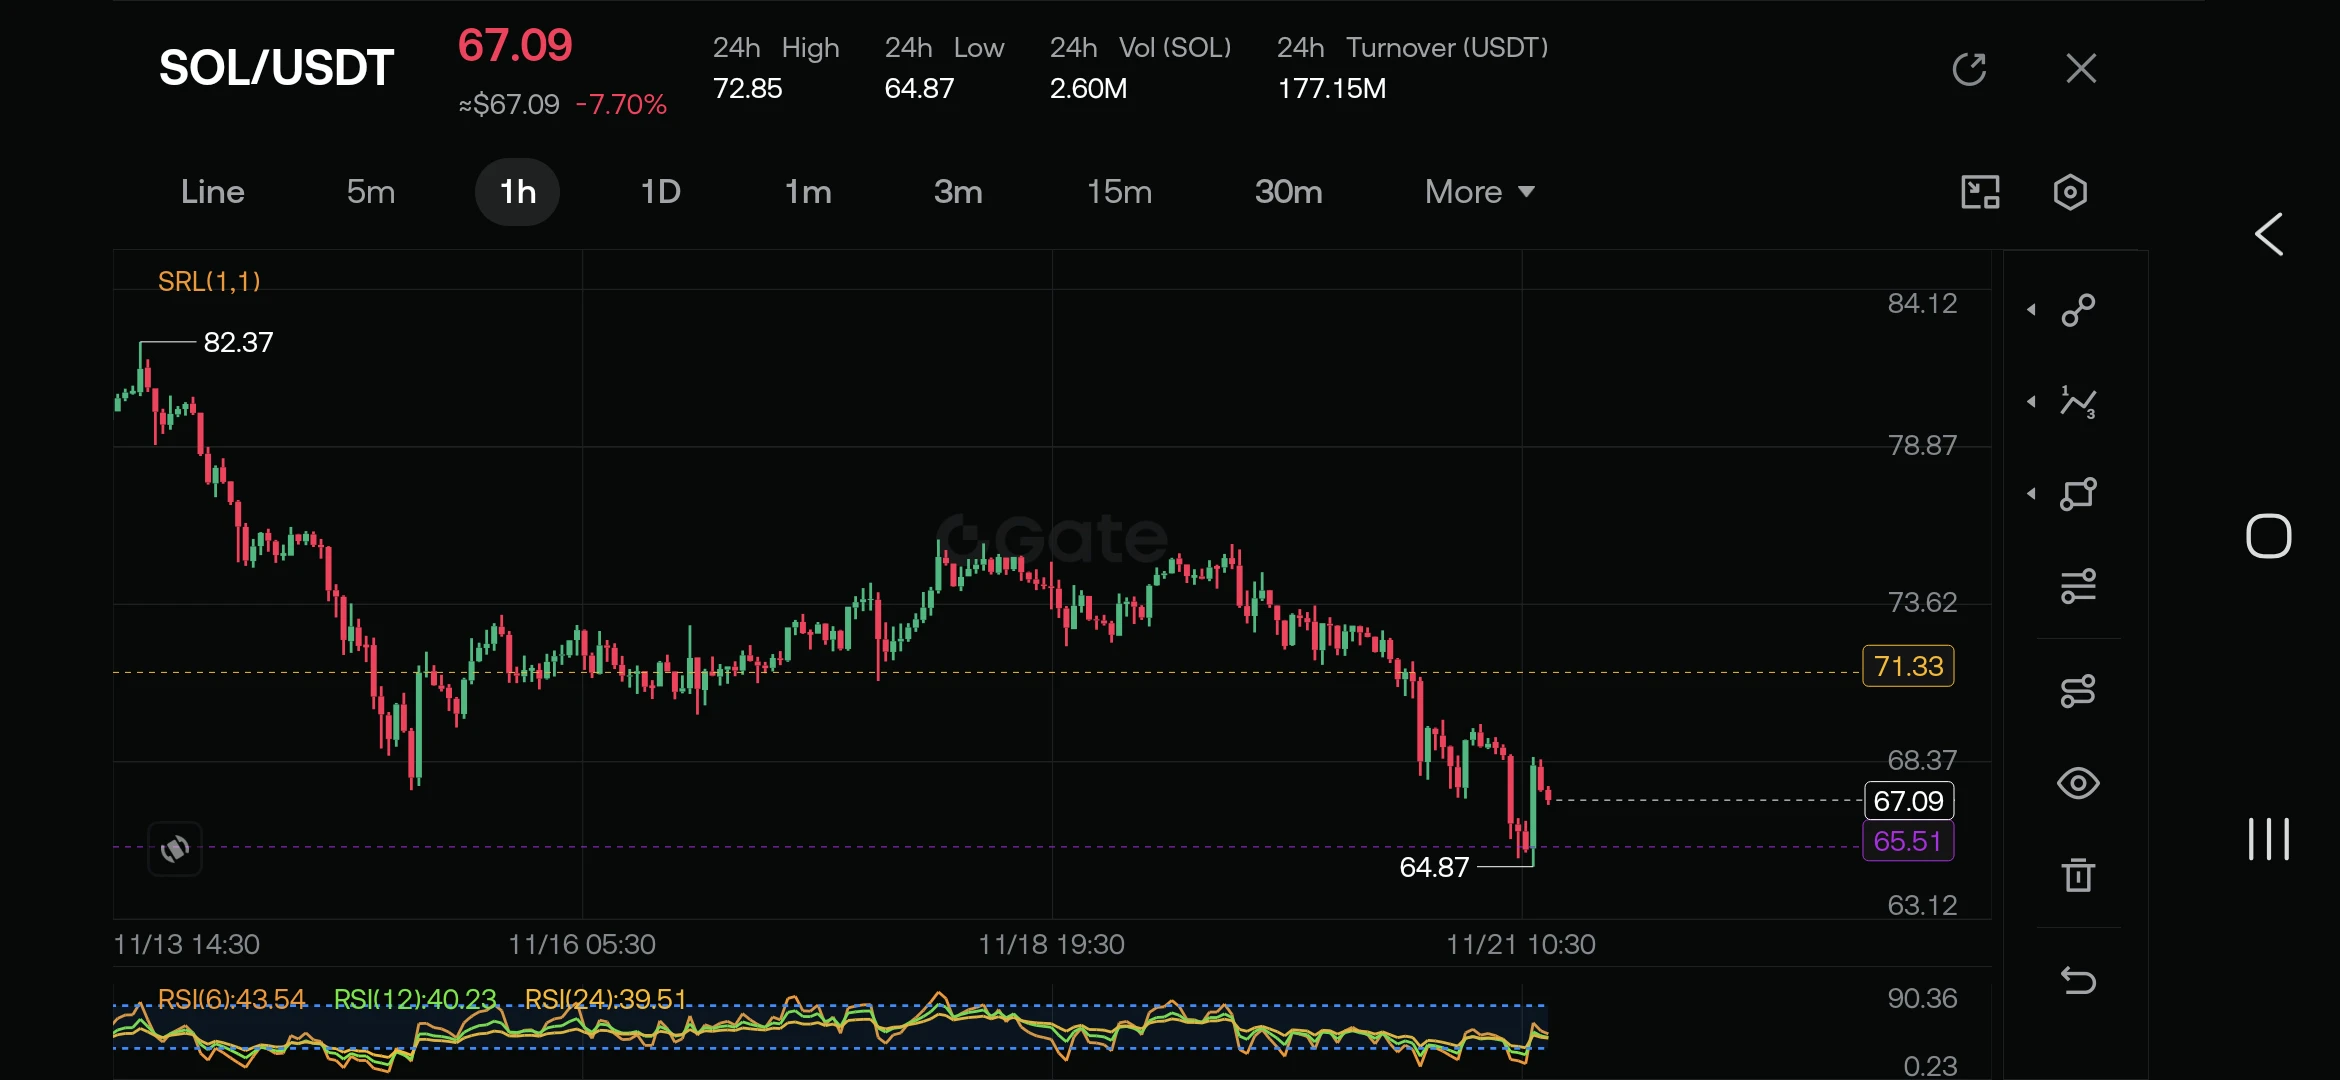
SOL/USDT 1H Technical Analysis: Bears Pressuring Key Support
​Solana ($SOL ) is facing heavy downward pressure on the 1-hour timeframe, currently trading at $67.09 after a sharp 7.70% drop over the past 24 hours. Following a failed mid-week recovery attempt near the $75.00 zone, sellers regained full control, driving price action decisively below the $71.33 pivot level and triggering an aggressive breakdown toward the recent $64.87 swing low.
​Market Structure & Momentum:
The short-term trend remains firmly bearish, characterized by a clear sequence of lower highs and lower lows since the Novem
post-image
SOL-0.77%
Trenches
FIONA
F
bade
b
FIONA
B34n...pump
Market Cap
$.
Change
.
24h Vol
$.
Holders
.
PIEVERSE
P
bade
b
PIEVERSE
0x0e...25a9
Market Cap
$.
Change
.
24h Vol
$.
Holders
.
mihao
m
bade
b
mihao
4Cxj...pump
Market Cap
$.
Change
.
24h Vol
$.
Holders
.
CLAUDIA
C
bade
b
CLAUDIA
2j5S...W2ZM
Market Cap
$.
Change
.
24h Vol
$.
Holders
.
IDOL
I
bade
b
IDOL
0x3b...ab07
Market Cap
$.
Change
.
24h Vol
$.
Holders
.
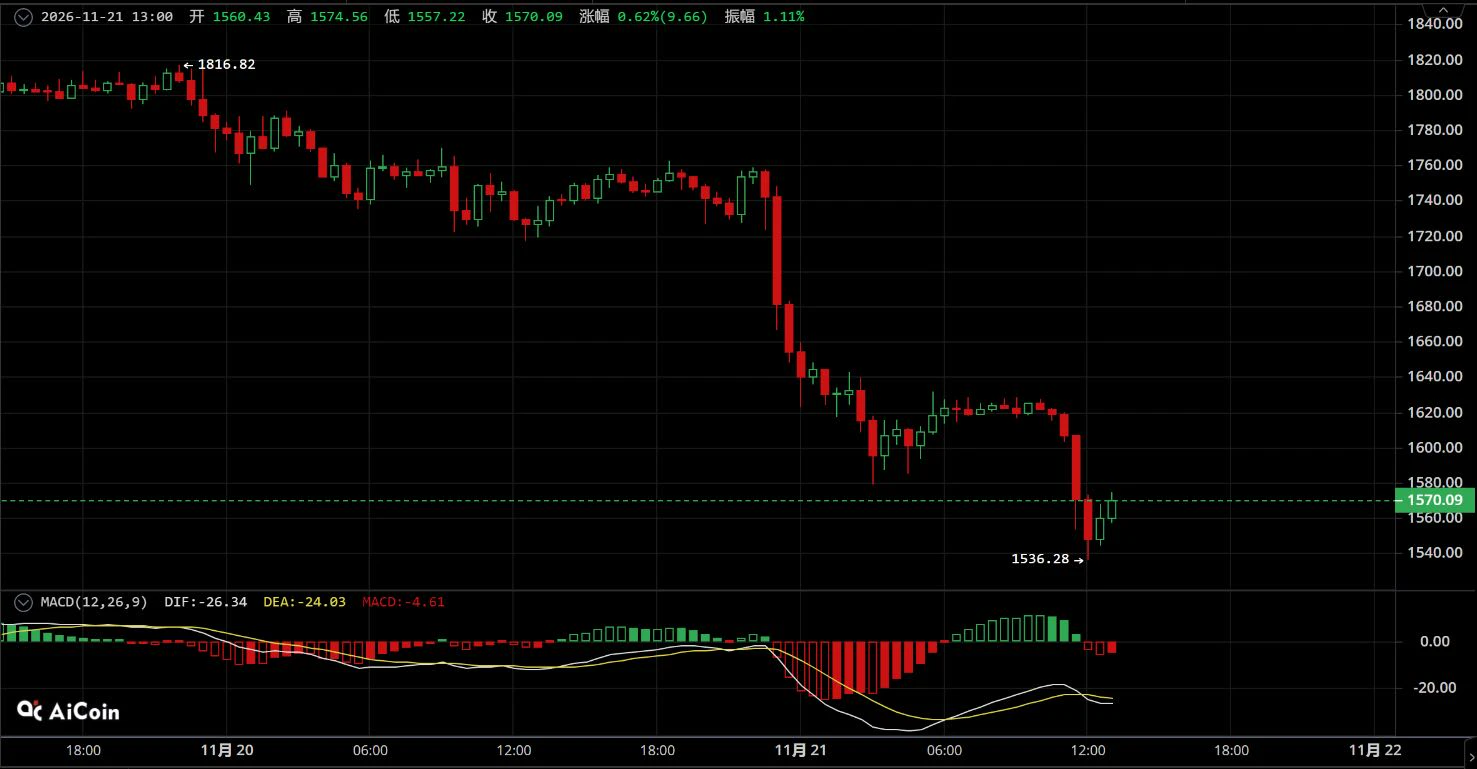
Nov 21 $ETH breaks down with the broader market, hitting a new phase low; weak rebound momentum favors shorting rallies

【Trading Plan】
Short entry range: Set up on a rebound to 1605-1630
Stop-loss: Above 1655
Take-profit targets: First target 1550-1535, second target 1515-1495

【Core Logic】
On the 30-minute chart, ETH broke down and plunged in tandem with the broader market, falling through multiple support levels in succession to hit a new phase low. As a major asset tracking the broader market, ETH has greater downside volatility than BTC, and its bearish trend is clearer.
This is merely a
post-image
ETH-1.26%
Good morning familia.
Happy weekend.
post-image
Enjoy your Bitcoin Black Friday! 🛒₿🔥
People cried about missing the bottom last cycle. Don't be the one crying again.
NFA! 🚀
post-image
BTC-0.67%
Short $XRP as the price approaches the 0.8904–0.8946 zone on the 4-hour chart. Sellers need to hold this area. If the price is clearly rejected here, it will continue downward. I’d rather wait than chase the market. Reasons: - The daily trend is down, with the price below the EMA200 at 1.287. - On the 4-hour chart, the price is 0.892, below the EMA50 at 0.978, and the trend remains bearish. - The 1-hour RSI is 40, leaving room for further downside before a rebound. 🔴 Short · Entry 0.8904–0.8946 · Take profit 0.8772 / 0.8670 / 0.8517 · Stop loss 0.9180Will sellers step in, or will buyers brea
post-image
XRP-1.15%
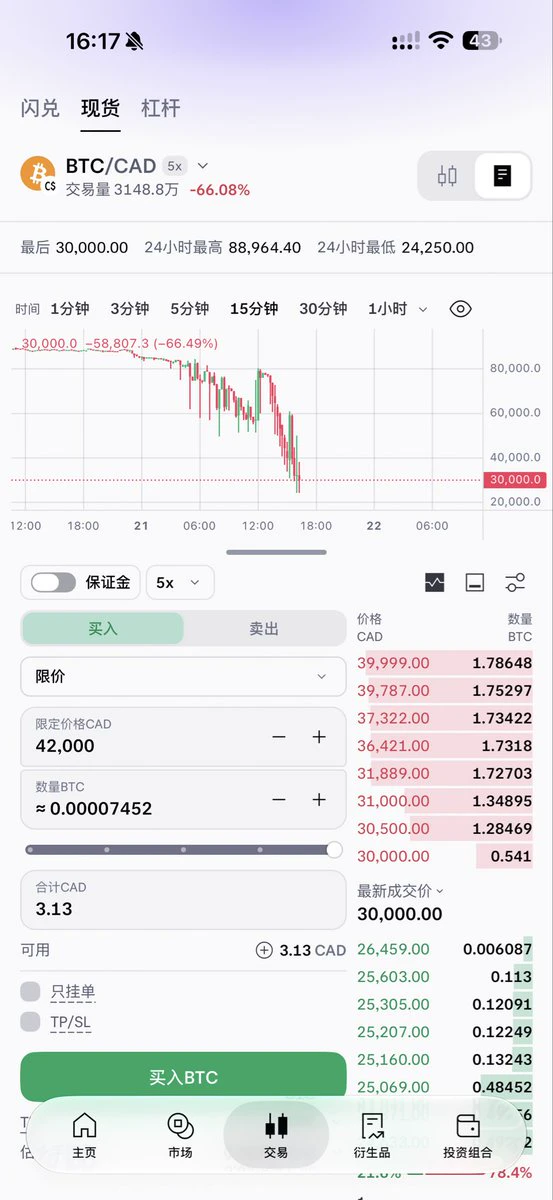
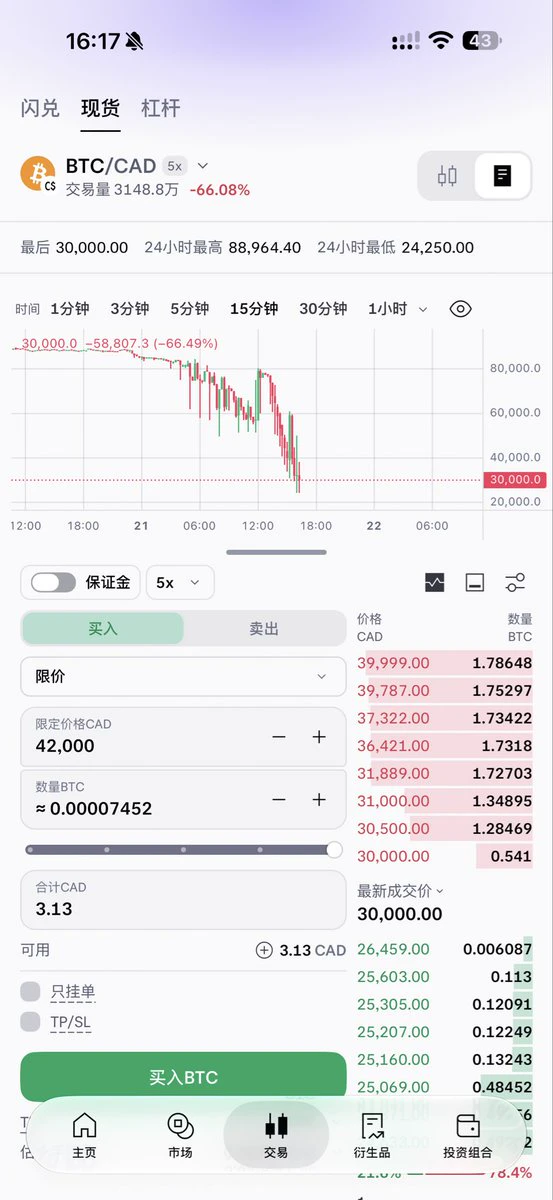
Is there something wrong with this price for Kraken? 🤨
post-image
NVIDIA Plunges Nearly 14%—Where Has Confidence in AI Tech Stocks Gone?

On November 20, NVIDIA plunged nearly 14% in a single day, the Nasdaq fell about 5.28%, and AI chip stocks saw a broad sell-off.

A stellar earnings report failed to stop the decline. The market is beginning to reassess the relationship between massive AI investments, profitability, and valuations.

👀 The AI growth story is still alive, but is the market still willing to pay for the future?

🔍 Let’s put AI stocks through a “stress test”!

If you could choose just one metric to determine whether an AI stock is worth
post-image
NVDA-13.84%
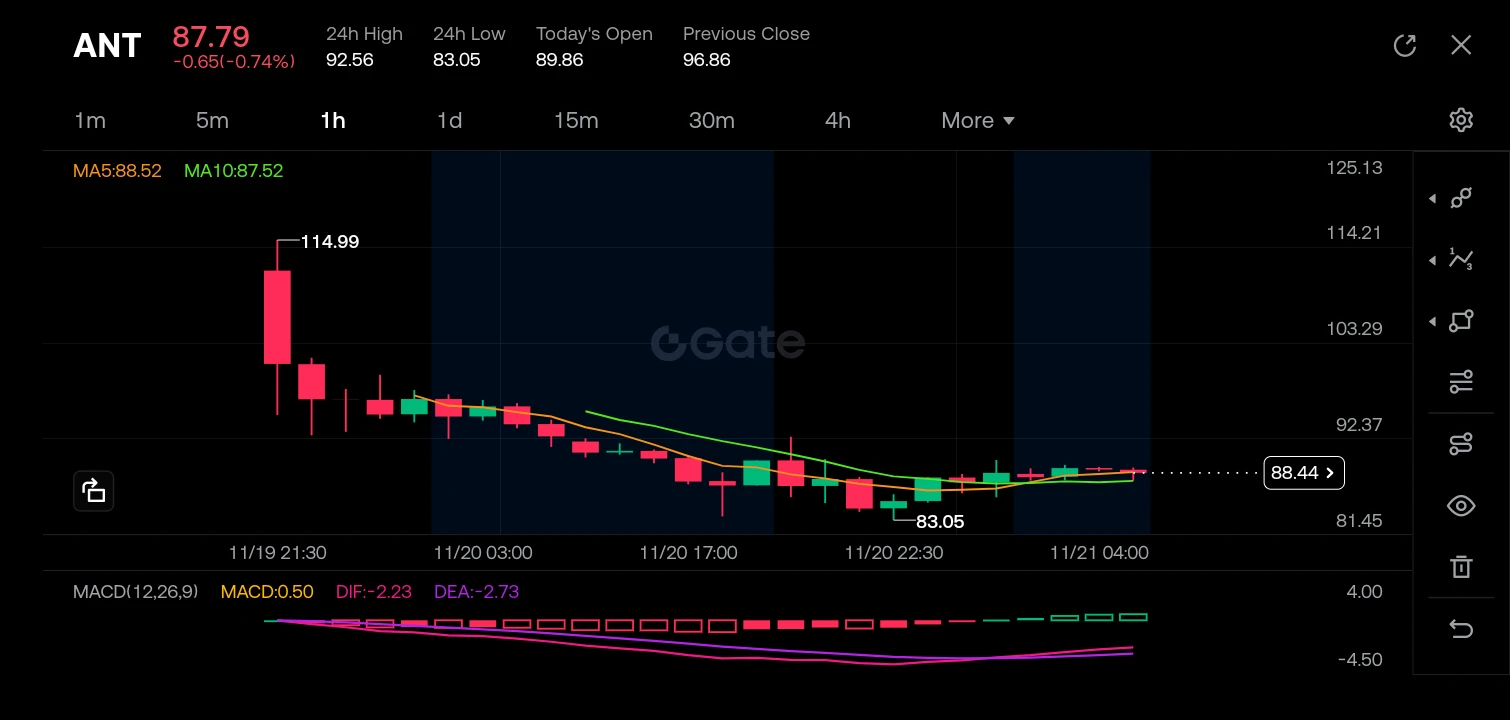
$ANT ‌
After a sharp drop from the $114 high, ANT is now consolidating weakly around $87–88 with moving averages pressing down from above and MACD still in negative territory.

🔴Should traders chase a breakdown, or wait for a rebound to resistance before shorting?

ANT Trade Plan: Waiting for a Rebound to Short, Not Chasing

The 1-hour chart shows ANT failed to hold the $114 high and subsequently formed a staircase decline. It briefly touched $83.05 and is now hovering near $87–88, struggling to build upward momentum.

· Moving Averages: MA5 ($88.52) and MA10 ($87.52) are converging and fla
post-image
ANT-8.68%
  • 2
Nvidia$NVDA flash-crashes 14%! Did blowout earnings become a death knell?

Once all the good news is priced in, it becomes bad news. Even the top AI player fears scrutiny.

The one-hour chart has broken below all key levels, with severe short-term oversold conditions. The outflows are even more painful: 229 million flowed out in one day and 785 million in seven days. Selling just won't stop.

Despite earnings beating expectations, rumors of an SEC investigation and news of Jensen Huang's resignation sent the stock crashing—a classic emotional sell-off.

Mr. Zhang's view: There could be a reco
NVDA-0.35%
  • 2
  • 1
It wasn’t caused by a quantum attack, and it wasn’t aliens bombing Earth. Keep your emotions in check and don’t let noise sway you so easily. It was simply due for a drop—don’t make up a reason just to reassure yourself!
I’ve been saying repeatedly since last month that November is the time of year when liquidity crises are most likely, and midterm election years have historically seen major pullbacks!
If you’re holding positions, don’t pull any fancy moves—just ride it out!
If you’re not holding any positions, consider getting in three weeks from now!
If you’re trading futures, good luck!
Got
post-image
[New Streamer] Market Prediction
live-cover
LIVE2,440
BTC-0.67%
Bullish news is being rolled out again
Is a major comeback rally coming?
post-image
  • 3
  • 2
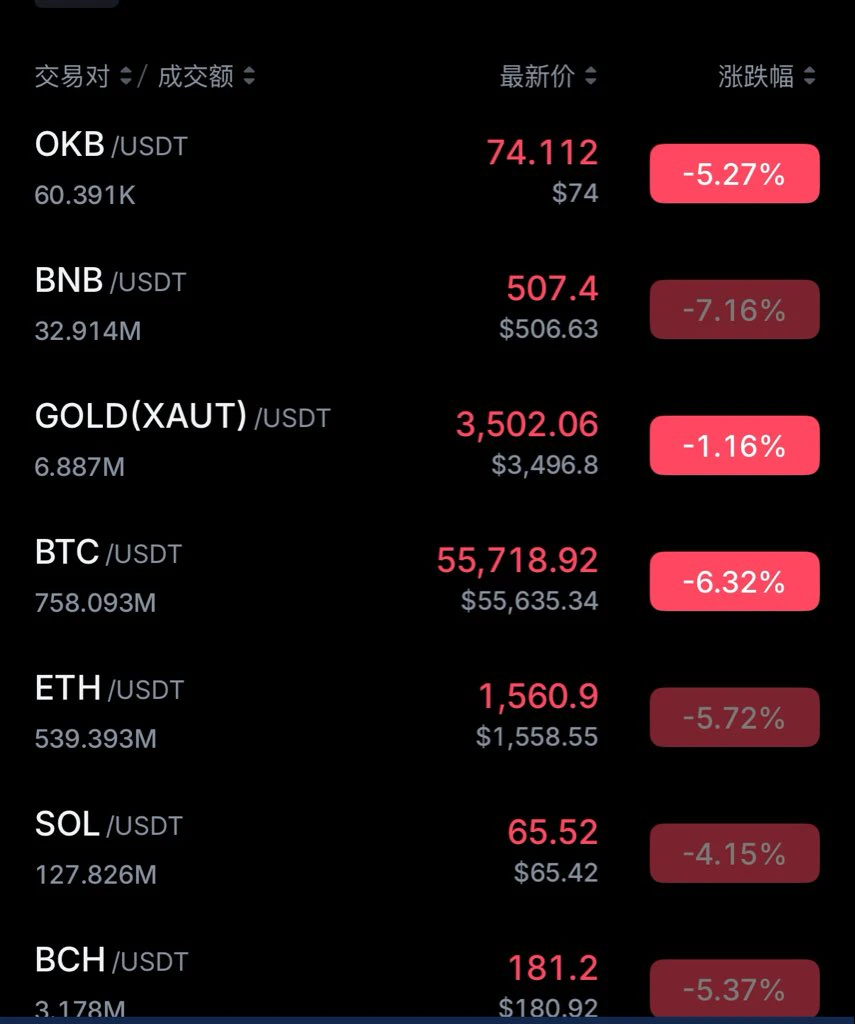
Long positions were liquidated en masse this round. Current lows: $BTC 55126.7, $ETH 1536.1, $ZEC 679.28

Overall, this crypto market downturn was not caused by a single negative factor, but by a combination of deteriorating macro conditions, institutional capital outflows, shrinking market liquidity, and concentrated leveraged liquidations.

First, weakness in U.S. stocks weighed on risk appetite. Adjustments in Nasdaq tech stocks and the AI sector reflected growing caution toward highly valued assets. As BTC becomes increasingly correlated with traditional financial markets, pressure on U
post-image
BTC-0.65%
ETH-1.23%
ZEC+1.29%
Is there something wrong with this price on Kraken🤨
post-image
B TC market up dates
live-cover
LIVE2,451
BTC-0.67%
ETH-1.26%
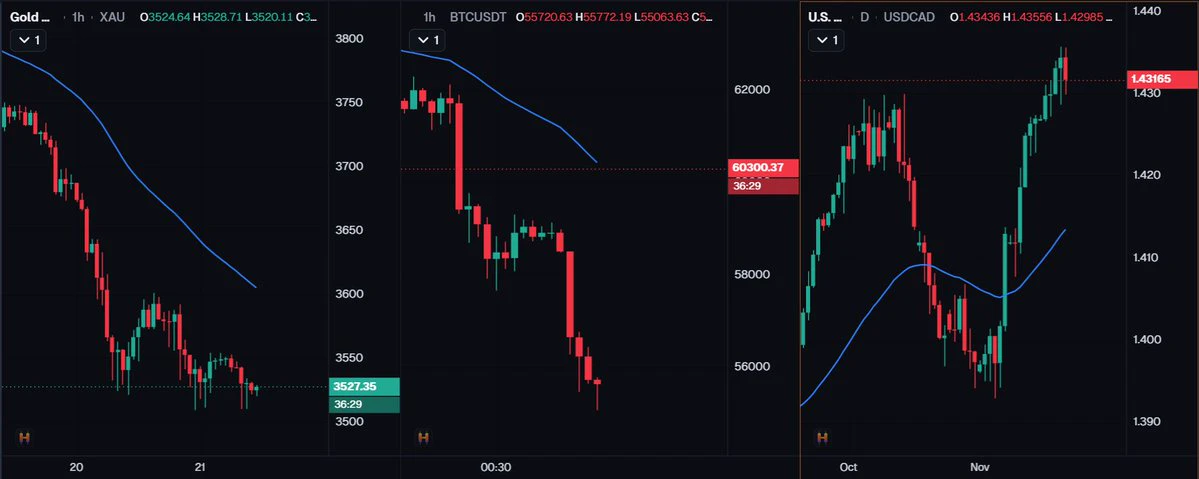
🐋 WHALE WATCH : Look at what is happening across global markets right now this is a pure USD liquidity squeeze:
=> Gold $XAU : Dumped from -$3750 straight down to $3527 slicing right under its moving average.
=> Bitcoin $BTC : Flushed from $62K down to $55500 losing the $60.3K key level.
=> USD/CAD: Ripping vertically to 1.4316 19 month highs for the US Dollar.
When both Gold and Bitcoin bleed simultaneously while the Dollar goes vertical its not crypto weakness its global dollar dominance and hawkish Fed repricing draining risk assets.
Which asset bounces first once USD cools off: $BTC or
post-image
BTC-0.67%
XAU+0.38%
USDCAD+0.07%
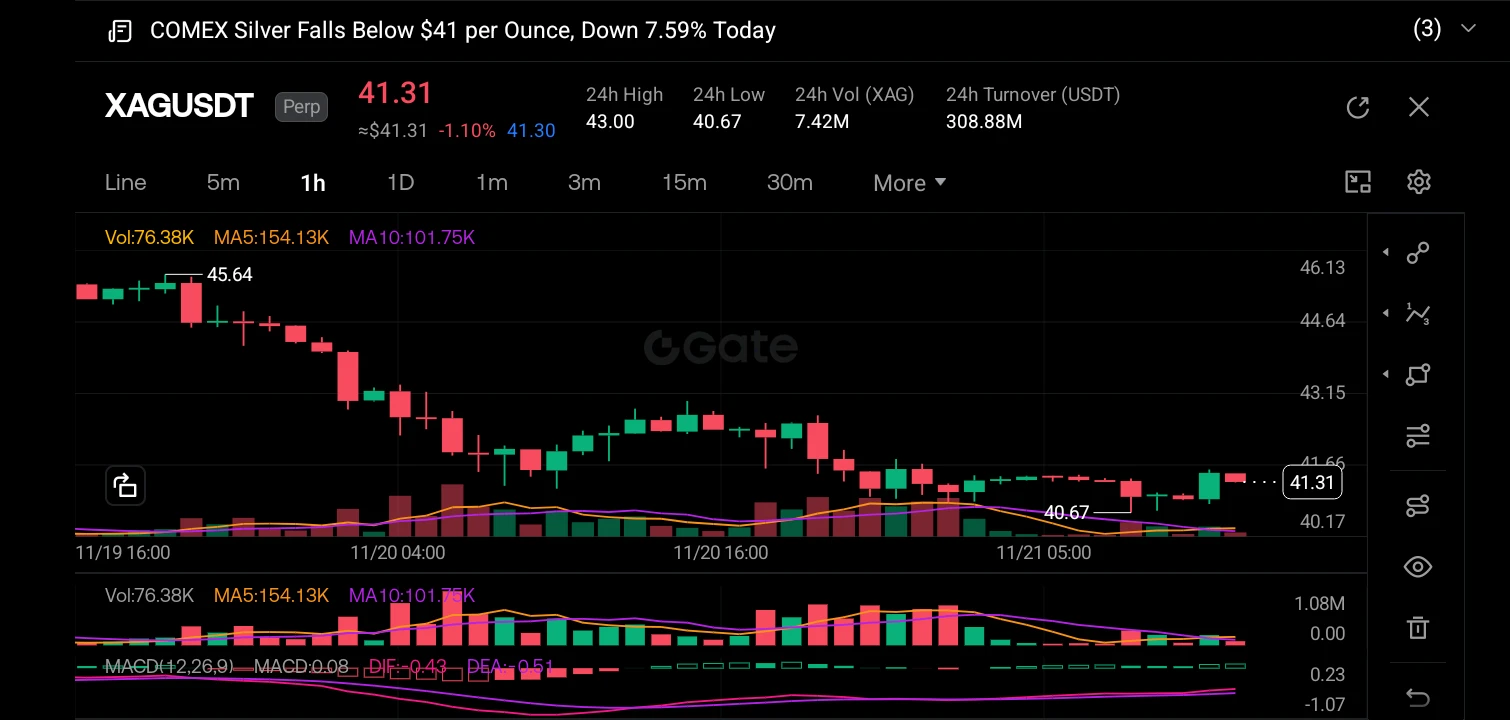
$XAGUSD ‌
A trading style blending technical analysis with on-chain data is particularly potent when observing whale accumulation. While technicals can show you when a price is consolidating, whale accumulation data tells you why it might soon break out. By tracking large wallet inflows and outflows alongside chart patterns (such as the current MACD convergence on the XAGUSDT chart), traders can distinguish between a retail-driven fake-out and institutional accumulation. This approach allows you to position early alongside "smart money" while using technical levels to define strict invalidati
post-image
XAGUSD-3.80%
  • 1
Very smart move by Hex team, showing the outcome while the model is downloading! 😂
post-image
Load More

Join 40 M users in our growing community

⚡️ Join 40 M users in the crypto craze discussion

💬 Engage with your favorite top creators

👍 See what interests you

Trending Topics

BTCBreaksBelow60K

2.1M Views29.2K Discussing

BTC fell below $60,000 on November 20 for the first time since July, alongside a tech stock selloff and broader pressure on risk assets. Will $60K become resistance, or can BTC quickly reclaim it? What price or volume signals would convince you that selling pressure is easing?

GateDirectIPOPhase3ANTAllocates92100Shares

743.3K Views4.8K Discussing

NvidiaDropsNearly14Percent

312K Views7.5K Discussing

View More