








Square
Following
Hot
News
Profile
Share your thoughts
placeholder
Article
GM,
Waking up to a day of wicks,
Did the price come back, but your position disappear?
Good news: In the early hours, $BTC touched the 7-handle,
Bad news: The quick wick brought it back near $82K.
The damn market maker: Just going up and down—so comfortable.
post-image
BTC+0.78%
THE CRYPTO RALLY IS COMING AS JIM CRAMER TURNS BEARISH! HUGE RLUSD XRP LEDGER BANK INTEGRATION! MONEYGRAM XDC!
WATCH ▶️
#crypto #cryptonews #bitcoin #xrp #rlusd #jimcramer #xdc #xlm #polygon #tokenization #stablecoins #thinkingcrypto
post-image
RLUSD+0.00%
XRP+0.38%
XDC+0.61%
BTC+0.78%
XLM+0.25%
Added to the long position on $ZEC
. Trading parameters: Entry: 1,199.22 - 1,214.56Target 1: 1,260.38Target 2: 1,303.17Stop-loss: 1,163.24ZEC is taking a brief breather at support, then preparing to return to Valhalla. Buy the dip! Try this trade here. $AKE and $ETH are worth watching today.
post-image
ZEC+7.49%
AKE+19.19%
ETH+0.71%
The bot is drawing a candlestick chart—what a beautiful arch. Now we just sit back and watch the show, and see whether the market maker paints the motherland’s mountains and rivers red, with the splendid landscape covered in fluttering maple leaves!
post-image
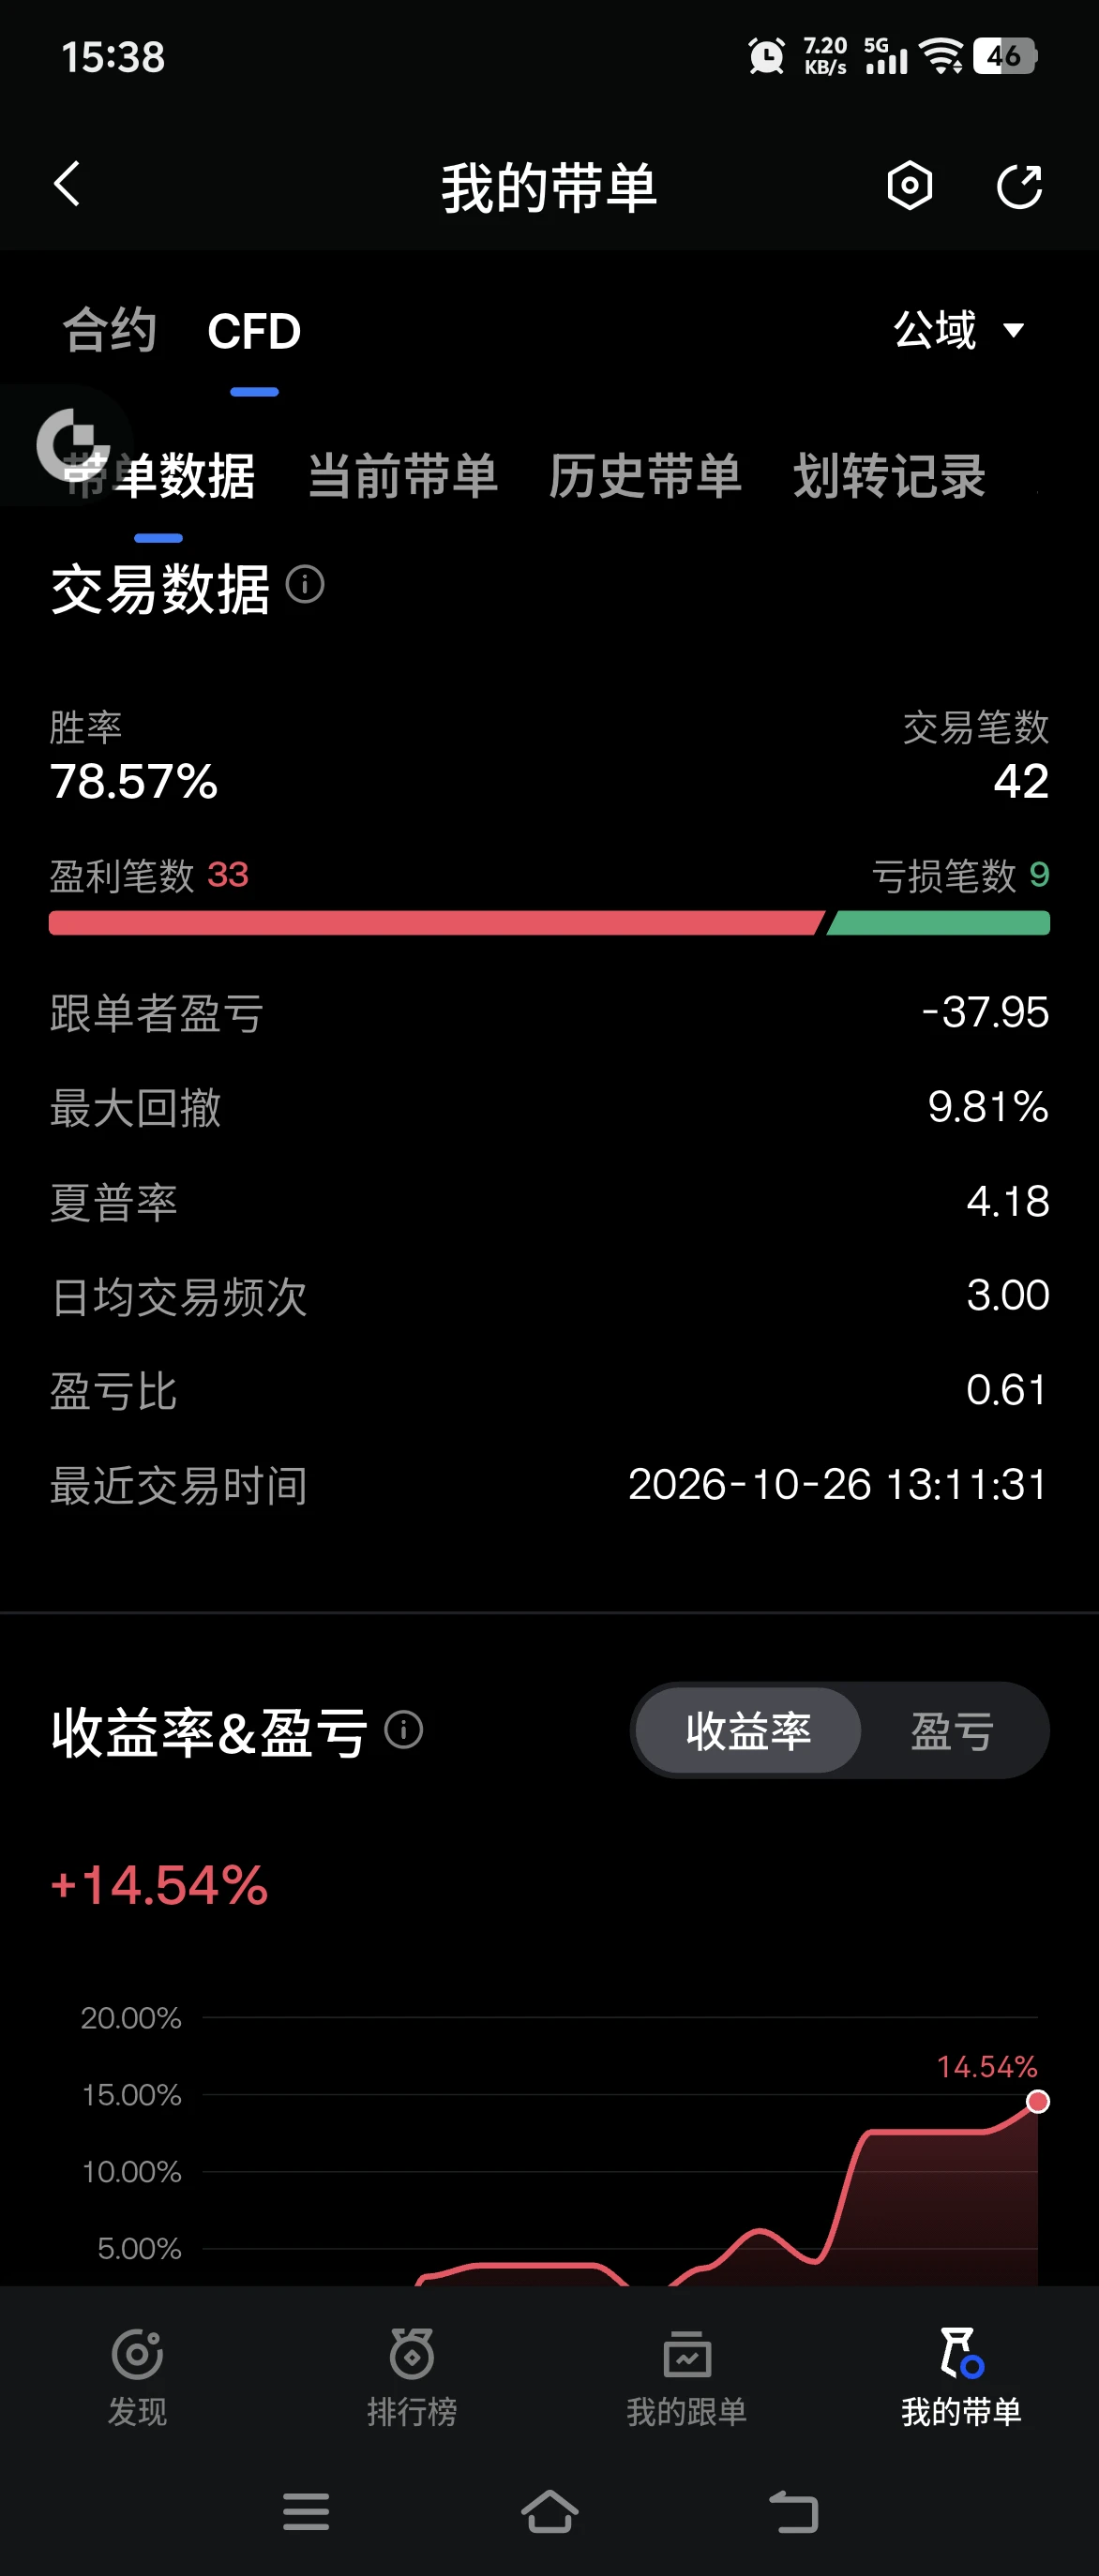
#晒出我的持仓收益 Every single call was actually entered; despite CPI causing three consecutive losses, still going long at lows!
post-image
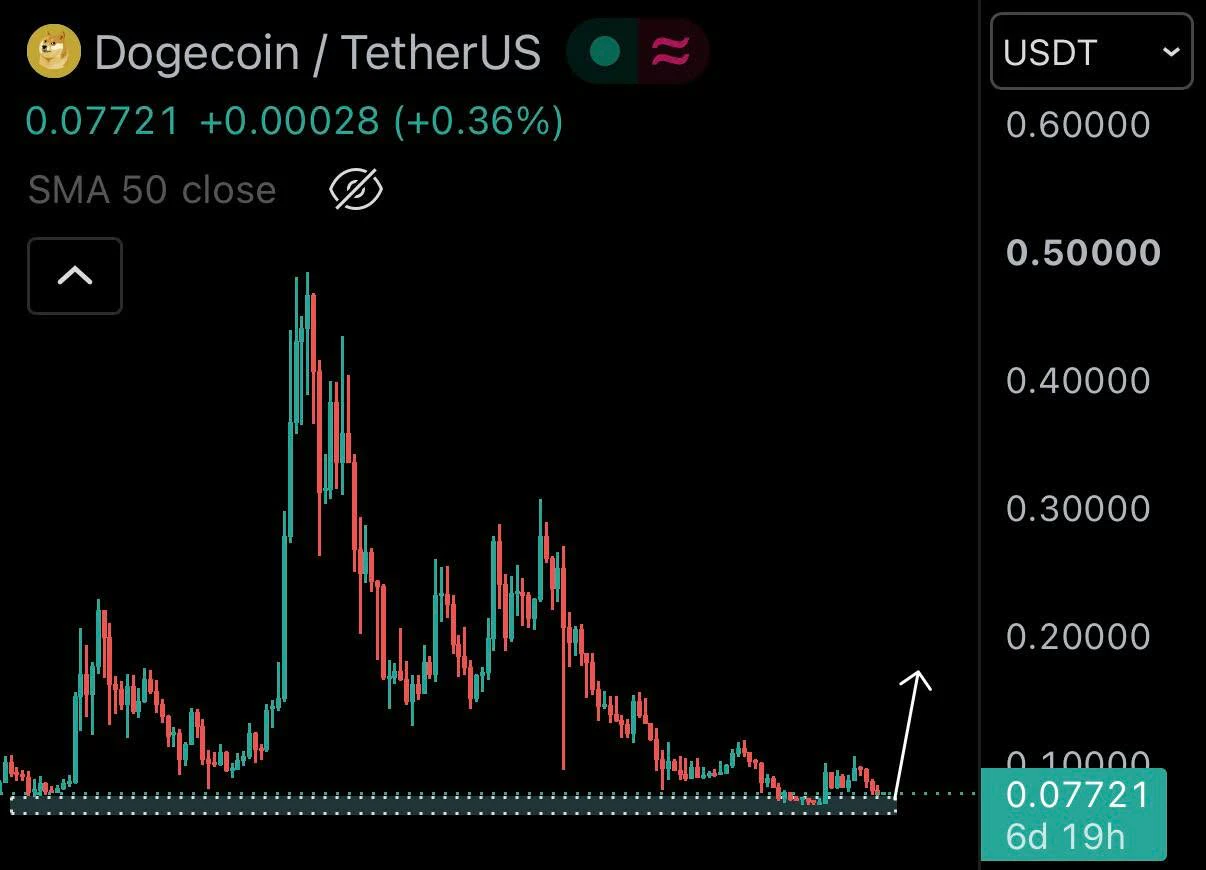
Layout: Bitcoin, Ethereum, Dogecoin
live-cover
LIVE880
  • 4
October 16 Strategy Plan Priority Ranking, for Followers Only
Execution Priorities for Today
My execution order:
2455—2467: short if rejected
2420—2430: go long on a pullback
If it breaks below 2398, short near 2400 on a rebound
If it breaks effectively above 2467, go long after a pullback confirmation
No operation in the middle range of 2435—2448
Current bias:
> Above 2400, favor range-bound bullish movement; handle 2455—2467 with a bearish bias. The real direction confirmation points are: a break above 2467 or a break below 2398.
$ETH
post-image
ETH+0.70%
Rumor has it that the Luoyang Museum unearthed the Imperial Seal of China
post-image
Yang Guang bit | October 16 $BTC CPI-triggered V-shaped rebound after an unexpectedly sharp plunge, short at 82700 resistance and long at lower levels
【Today's Plan】
Short on rebound (main strategy): Lightly short at 82700–83000 on a rebound, stop-loss at 83400, targets 82000–82200 and 81300–81500
Long on pullback (secondary): Enter a short-term long at 82000–82200 on a pullback, stop-loss at 81600, targets 82700–82900
【Key Conclusion】
BTC plunged to a low of 79725 yesterday after CPI exceeded expectations, then rebounded sharply to around 82500, driven by a rebound in U.S. stocks and a pullba
post-image
BTC+0.75%
$FET What is most interesting right now is not guessing whether prices will rise or fall, but seeing who is forced to change their stance first.
The bulls’ test is at 0.2122, while the bears’ test is at 0.1898. $FET is currently at 0.2075, up 4.32% over 24 hours. The 1-hour support is 0.1898, resistance is 0.2122, and current volume is 0.25 times the average volume of the past 20 candles.
I’ll first note that $FET’s 1-hour chart has moved, while the 4-hour chart has yet to confirm it, because I treat shorter timeframes as alerts, not conclusions; without confirmation from the larger timeframe,
post-image
FET+4.21%
Recently, a lot of people have been completely confused: longs get beaten down, shorts get wrecked, neither human nor ghost, and even getting some pork trotter rice feels harder than reaching the heavens. The market makers really seem to be doing this. Are you going long or short? Anyway, as soon as you place an order, they will beat you until you are utterly battered. It is not just the crypto market crashing—the stock market is also like a dead dog. U.S. stocks, the Nikkei, South Korean stocks, and A-shares all seem to have taken laxatives, and the bleeding just will not stop. They all blame
post-image
BTC+0.75%
ETH+0.70%
SOL+1.01%
PAXG+0.15%
CL+2.79%
  • 2
$ZEC
ZEC is currently in an oversold rebound phase, with short-term strength but no reversal in the medium-term trend yet.
Trend: The price has rebounded from 1,075 to around 1,221, moving above all short-term moving averages, but the medium-term moving averages remain bearishly aligned and the MACD death cross remains unresolved, indicating a rebound rather than a reversal.
Support levels: First support at 1,211~1,214; core support at 1,192~1,195; strong support at 1,075.
Resistance levels: First resistance at 1,253~1,254; key resistance at 1,270~1,285; strong resistance at 1,349.
In simple
post-image
ZEC+7.49%
Koreans dumping at the open? Don’t they believe in their country’s destiny anymore?🥵
post-image
Sell $EPIC
at the current price. Entry range: 0.2582 - 0.2639Take-profit level 1: 0.2350Take-profit level 2: 0.2142Stop-loss level: 0.2771The asset remains in a clear downtrend, with the price below both MA7 and MA25 on the two timeframes. The RSI(6) on the 15-minute chart is 45.90, and the price still has ample room to continue falling, potentially dipping to the recent low of 0.2252 before finding strong support. Click here to trade 👇👇👇Noteworthy: $BTC : Current price 82,152.9 - 24-hour change: +0.69%$AKE : Current price 0.033442 - 24-hour change: +21.98%
post-image
EPIC-20.76%
BTC+0.78%
AKE+19.19%
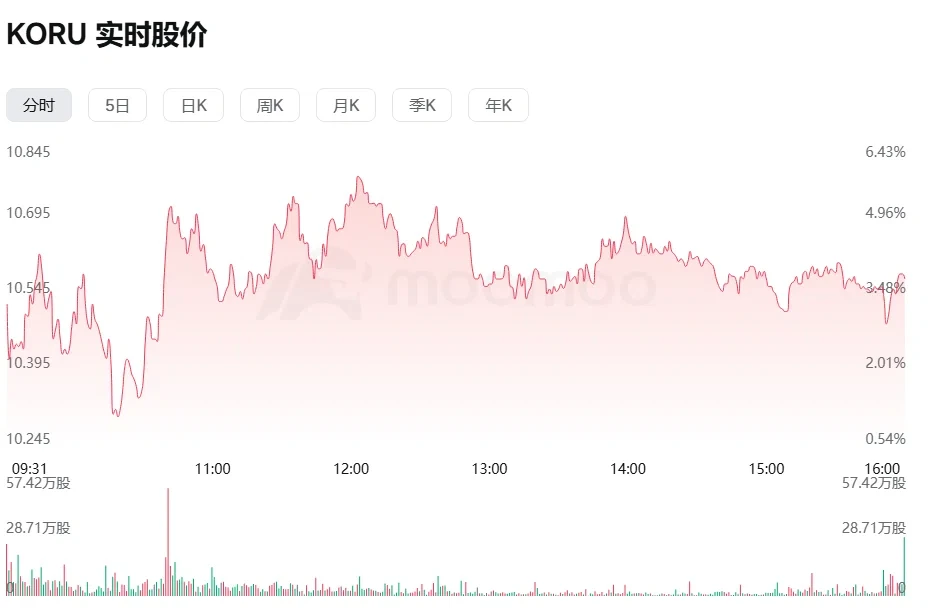
It fell from 14.948 to 10.094 in 26 hours.
$KORU The sharpest stretch in the past two days, wiping out nearly one-third.
The 13:00 wick ranked third in volume among the past 48 candles.
Three consecutive candles rose from 21:00, reaching 12.16 at 4:00 a.m.
It is now at 11.552, with the 20-day moving average at 11.25465, just 2.6% below.
12.16 overhead is the wall, while 10.094 below is the only support.
The bounce is sharp, and the retreat is quick.
There is little to do in the middle unless one of these two levels breaks.
I’ll note this down and wait for it to choose on its own.
(Not investme
post-image
KORU-0.24%
  • 1
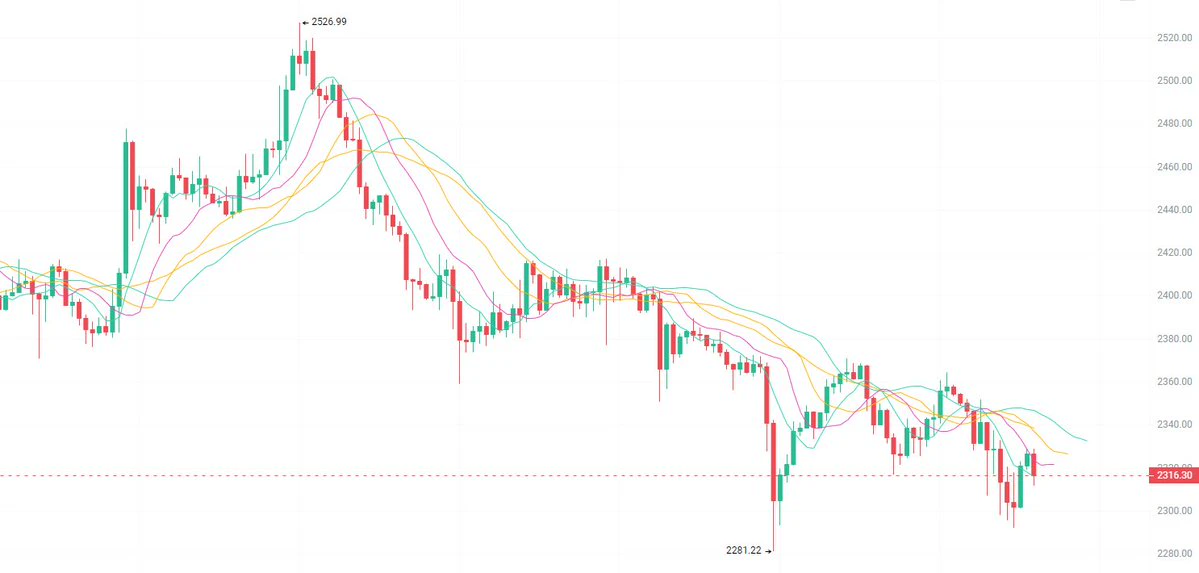
Yang Guang bit | October 16 $ETH Precision Strategy — Oversold rebound nearing the resistance zone, two-way positioning with shorts high and longs low
【Today's Outlook】
Entry timing: Set up short positions on a rebound to the 2460—2480 range; take short-term longs on a pullback to 2400—2420
Stop-loss settings: Short-position stop-loss above 2500; long-position stop-loss below 2390
Staggered take-profit:
Short-position target: 2400—2420
Long-position target: 2455—2470
【Core Conclusion】
After yesterday's hotter-than-expected CPI, ETH plunged to a low of 2313.39, then rebounded to around 2466, d
post-image
ETH+0.70%
Congrats on making money—you cleaned up on both longs and shorts
A true legend is a true legend—there’s no denying it.
At 10 a.m. yesterday, Ether crashed to 2318 before recovering—I know what you’re hesitating about: it’s not that you’re bearish on it, you’re just worried this drop isn’t over yet.
The Time Lord sees this move as the end of a three-wave decline—in other words, the C wave.
The daily chart’s yearly moving average is around 2355. Yesterday’s wick pierced below it before recovering—the volume was 1.3 times that of the previous few days, so this wasn’t a drop with nobody stepping in.
The 2411 level we mentioned last time broke, and this is where it went next. He placed orders lower, with his stop-l
post-image
ETH+0.71%
Touched 1253.76 and pulled back again—just missing that final push?
$ZEC Here’s the move from overnight, laid out by time
20:00 Dipped to 1065.5, with volume nearly three times the previous candle
23:00 A candle at 1180.15, with the strongest volume of the rebound
05:00 Touched a high of 1253.76, then pulled back from the long upper wick
Now stuck at 1221.5, moving sideways on declining volume
Two hurdles above: 1253.76 and 1285.14
One line below: the 20-day moving average at 1160.65
Scenario one: Only a high-volume reclaim of 1253.76 creates a chance to break through 1285.14
Scenario two: If
post-image
ZEC+7.52%
  • 1
Load More

Join 40 M users in our growing community

⚡️ Join 40 M users in the crypto craze discussion

💬 Engage with your favorite top creators

👍 See what interests you

Trending Topics

USSeptemberPPIBeatsExpectations

91.35k Views1.89k Discussing

US September PPI came in at 6.3% YoY, well above the 5.3% market expectation, pointing to renewed producer-side inflation pressure. Weekly jobless claims were 199K, broadly in line with forecasts. Could hotter inflation further reduce room for rate cuts, and what does it mean for $BTC, US stocks, and gold?

DrLinHanSpeaksAtOxfordUnion

135.63k Views1.86k Discussing

JapanAndKoreaStocksPlunge

47.27k Views1.76k Discussing

View More