






Square
Following
Hot
News
Notifications
Profile
Share your thoughts
placeholder
Article
What Is the Sharpe Ratio? Why Isn’t a Higher-Return Strategy Necessarily the Better Choice?

In the cryptocurrency market, some trading strategies deliver high annual returns but come with sharp drawdowns, while others generate relatively steady returns and have more stable equity curves. Comparing only how much money a strategy ultimately makes may not fully capture its quality. In this case, the Sharpe Ratio can be a useful reference.

First, what is the Sharpe Ratio?

The Sharpe Ratio measures the relationship between an asset’s or strategy’s excess returns over the risk-free rate and the v
post-image
Anyway, one more reason to be bullish on Nvidia +1$NVDA
$NVDAB
post-image
NVDAB
NVDABNVDAB
Pump.Fun
MC:$3.5KHolders:1
4.36%
NVDA+2.80%
Trenches
牛逼
牛
bade
b
牛逼
0x96...7777
Market Cap
$.
Change
.
24h Vol
$.
Holders
.
ZIG
Z
bade
b
ZIG
0x8c...1145
Market Cap
$.
Change
.
24h Vol
$.
Holders
.
BTC
B
bade
b
BTC
C5xp...pump
Market Cap
$.
Change
.
24h Vol
$.
Holders
.
STONK
S
bade
b
STONK
6GmA...UNgx
Market Cap
$.
Change
.
24h Vol
$.
Holders
.
ANSEM
A
bade
b
ANSEM
9cRC...pump
Market Cap
$.
Change
.
24h Vol
$.
Holders
.
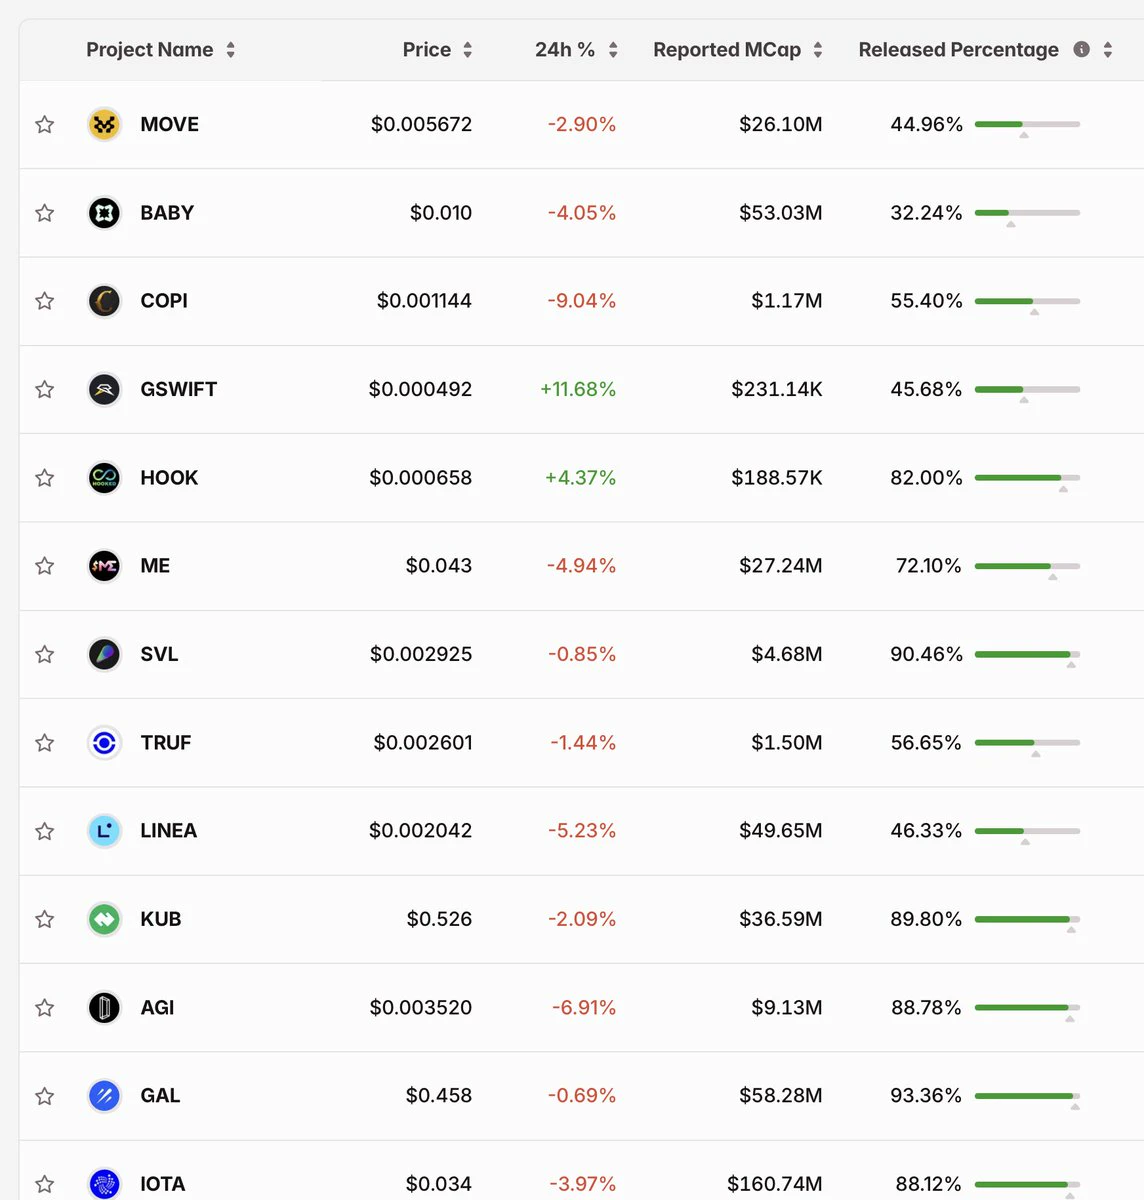
This week's largest unlocks ↓
• Cronos ($CRO ): $56M (2.3% of supply)
• Allora ($ALLO ): $24M (38.7% of supply)
• Arbitrum ($ARB ): $16M (1.4% of supply)
• YZY ($YZY): $8.6M (9.8% of supply)
• Starknet ($STRK ): $4.8M (1.7% of supply)
• Aptos ($APT ): $2.6M (0.5% of supply)
• Sei ($SEI): $2.4M (0.8% of supply)
• peaq ($PEAQ): $2.3M (3.2% of supply)
• Espresso ($ESP): $1.5M (2.8% of supply)
• Babylon ($BABY): $1.4M (2.7% of supply)
Top-3 account for 80% of the week’s total.
Data: @Tokenomist_ai
post-image
CRO-2.47%
ALLO-1.64%
ARB+1.17%
STRK-3.55%
APT-1.51%
  • 5
Either way, another reason to be bullish on Nvidia +1$NVDA
$NVDAB
post-image
NVDAB
NVDABNVDAB
Pump.Fun
MC:$3.5KHolders:1
4.36%
NVDA+2.80%
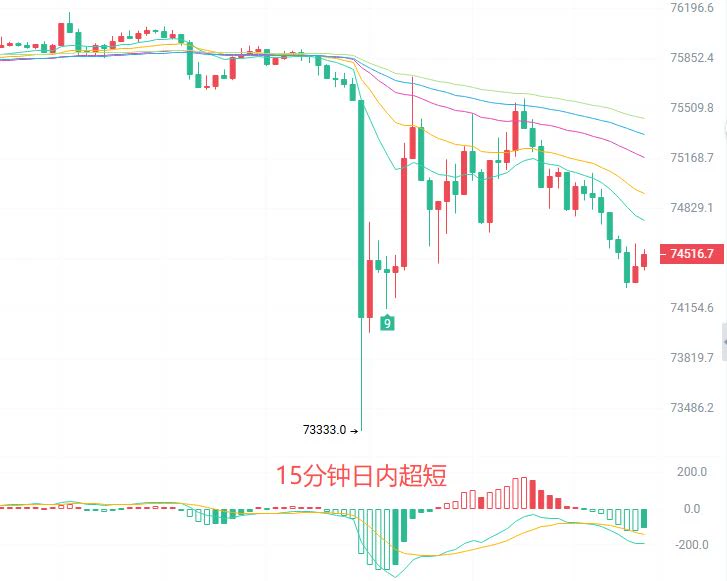
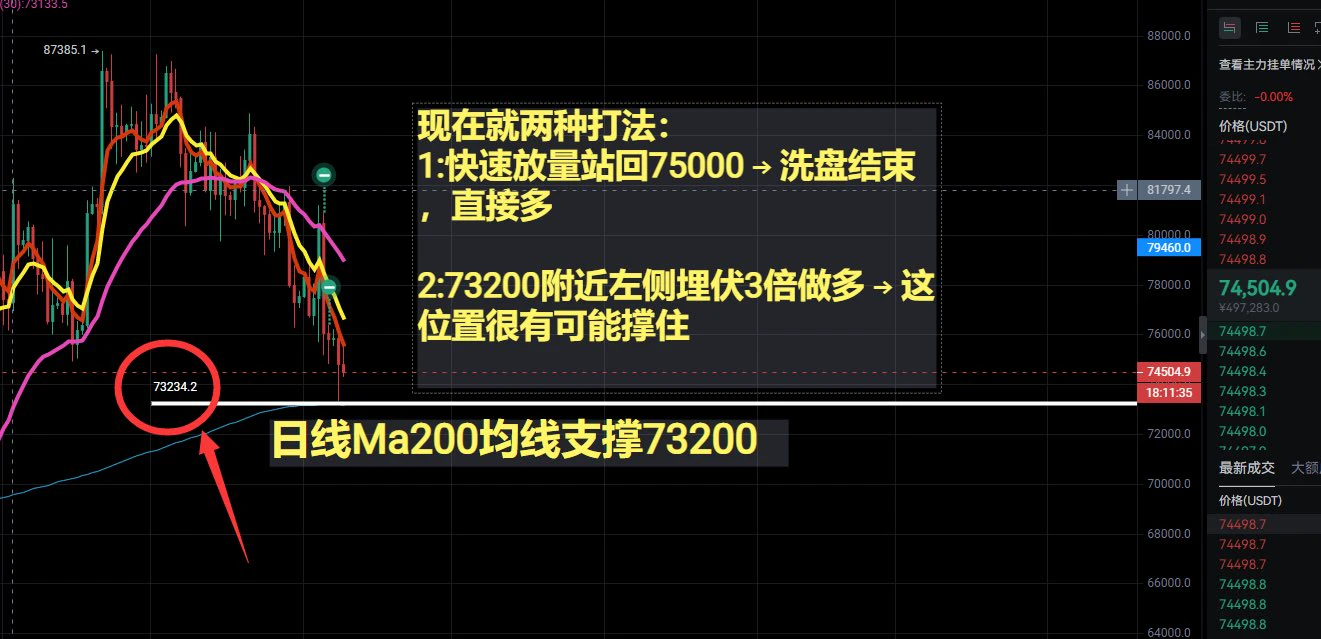
$BTC BTC fell below the lower Bollinger Band, leaving the 74,600 long just $150 from its 74,300 stop loss
The 2-hour chart looks ugly: price has already fallen below the lower Bollinger Band at 74,462, the first time since late October. It’s accelerating downward along the lower band. All the moving averages are overhead, forming a thick bearish wall. The MACD green bars are expanding below the zero line and opening downward; the bears haven’t let up at all. The TD buy count just printed its first bar, and a single bar doesn’t tell us anything
The 15-minute chart is clearer: it closed at 74,44
post-image
BTC-0.65%
TODAY LIVE TECNICAL WITH SIGNALS
live-cover
LIVE1,970
Bitcoin continues to slide, leaving the market gripped by panic, but on-chain data shows an unusual divergence: long-term holders are beginning to loosen their grip, while short-term holders remain relatively calm.

Data from November 5 showed that realized losses transferred to exchanges by long-term holders (LTHs) reached $139 million, enough to indicate that some long-time holders can no longer withstand the current market pressure. But short-term holders (STHs) have not seen a comparable wave of panic selling. After substantial turnover in the preceding period, the cost basis of short-term
post-image
BTC-0.65%
There’s an interesting number on @termix_ai’s search page.
In previously captured public search snapshots, Video Editing showed 197 services but only 10 live backend matches; another snapshot for AI Automation showed 312 versus 10.
The two sets of numbers come from different times and shouldn’t be treated as current live results. As for why only 10 are shown, the specific ranking and pagination logic still needs official clarification.
Still, it got me thinking about a very real question: As AI Agents become more numerous, is it really getting easier for ordinary people to find the right helpe
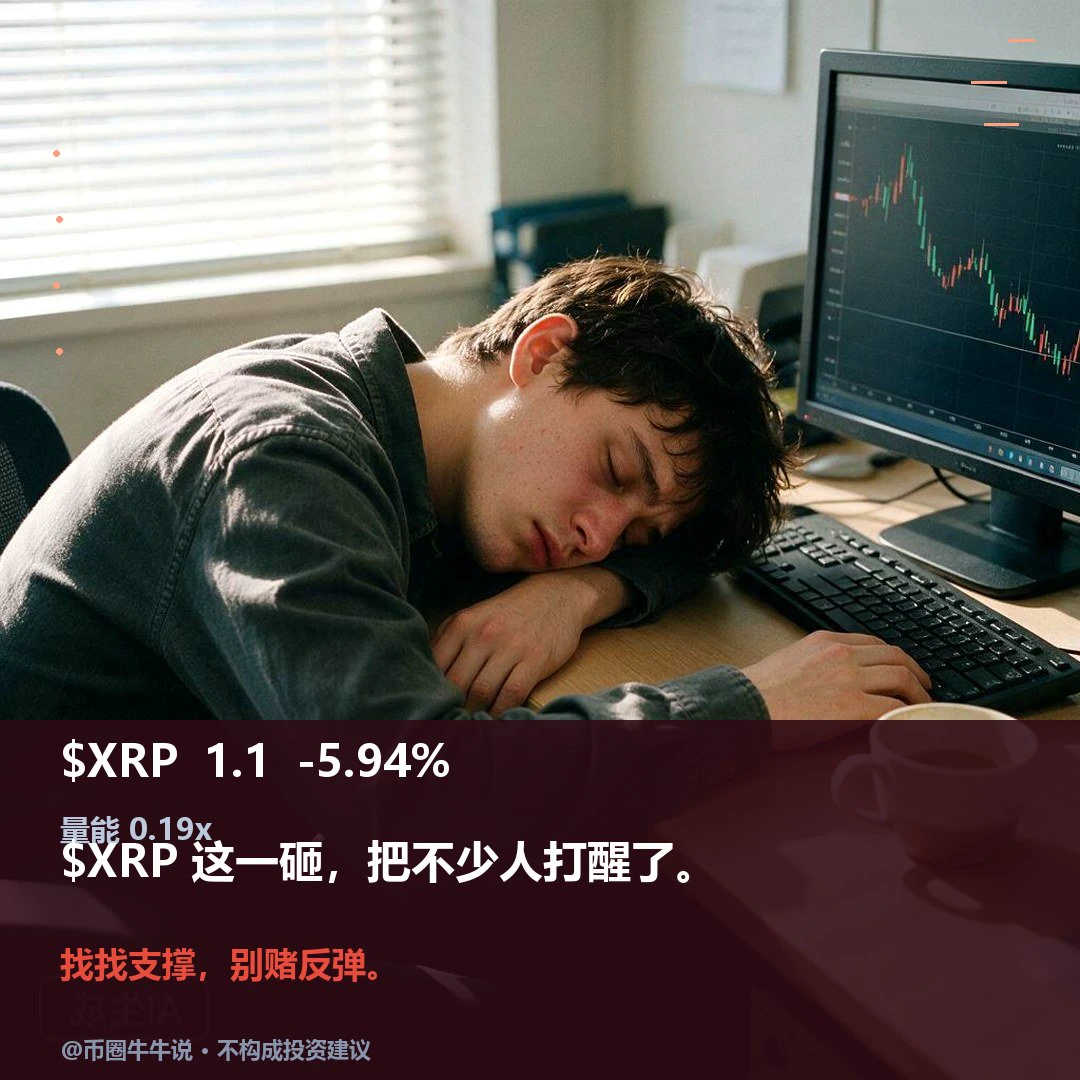
$XRP Currently trading at 1.0966, 24H -5.94%. 1H is weak: RSI17.1, EMA20 1.1263, resistance 1.1699, support 1.0925; 4H is weak: RSI18.5, EMA20 1.1653, resistance 1.3271, support 1.0925. Volume is only 0.19x the average. To the upside, price needs to hold above the 1.1699 resistance; a break below the 1.0925 support would weaken the structure. Going forward, watch whether price can hold above 1.1699 and reclaim 1.0925 after losing it; a break below 1.0925 without a recovery invalidates the setup. Market volatility is high; for observation only.
post-image
XRP-1.15%
What Is the Sortino Ratio? Why Can Focusing Only on Volatility Misjudge a Trading Strategy?

In cryptocurrency trading, two strategies with similar returns can offer very different risk experiences. One strategy may often suffer sharp declines, while another may mostly see upward fluctuations. Measuring risk only with standard volatility can overlook this difference. The Sortino Ratio is a metric that can help provide a more complete analysis.

First, what is the Sortino Ratio?

The Sortino Ratio measures returns above a target return relative to downside risk. It is similar to the Sharpe Rati
post-image
$LYN A long opportunity is taking shape.
Entry range: 0.02011 – 0.02056 Target: 0.02148 – 0.02240 Defense level: 0.01931
Technically, the RSI has fallen into deeply oversold territory, while the Delta indicator is showing positive divergence. Together, these two signals usually point to a decent chance of a short-term rebound.
But let’s be clear: the broader trend is still dominated by bears. The 0.02039 support level is critical—a break below it could trigger a cascade of liquidations.
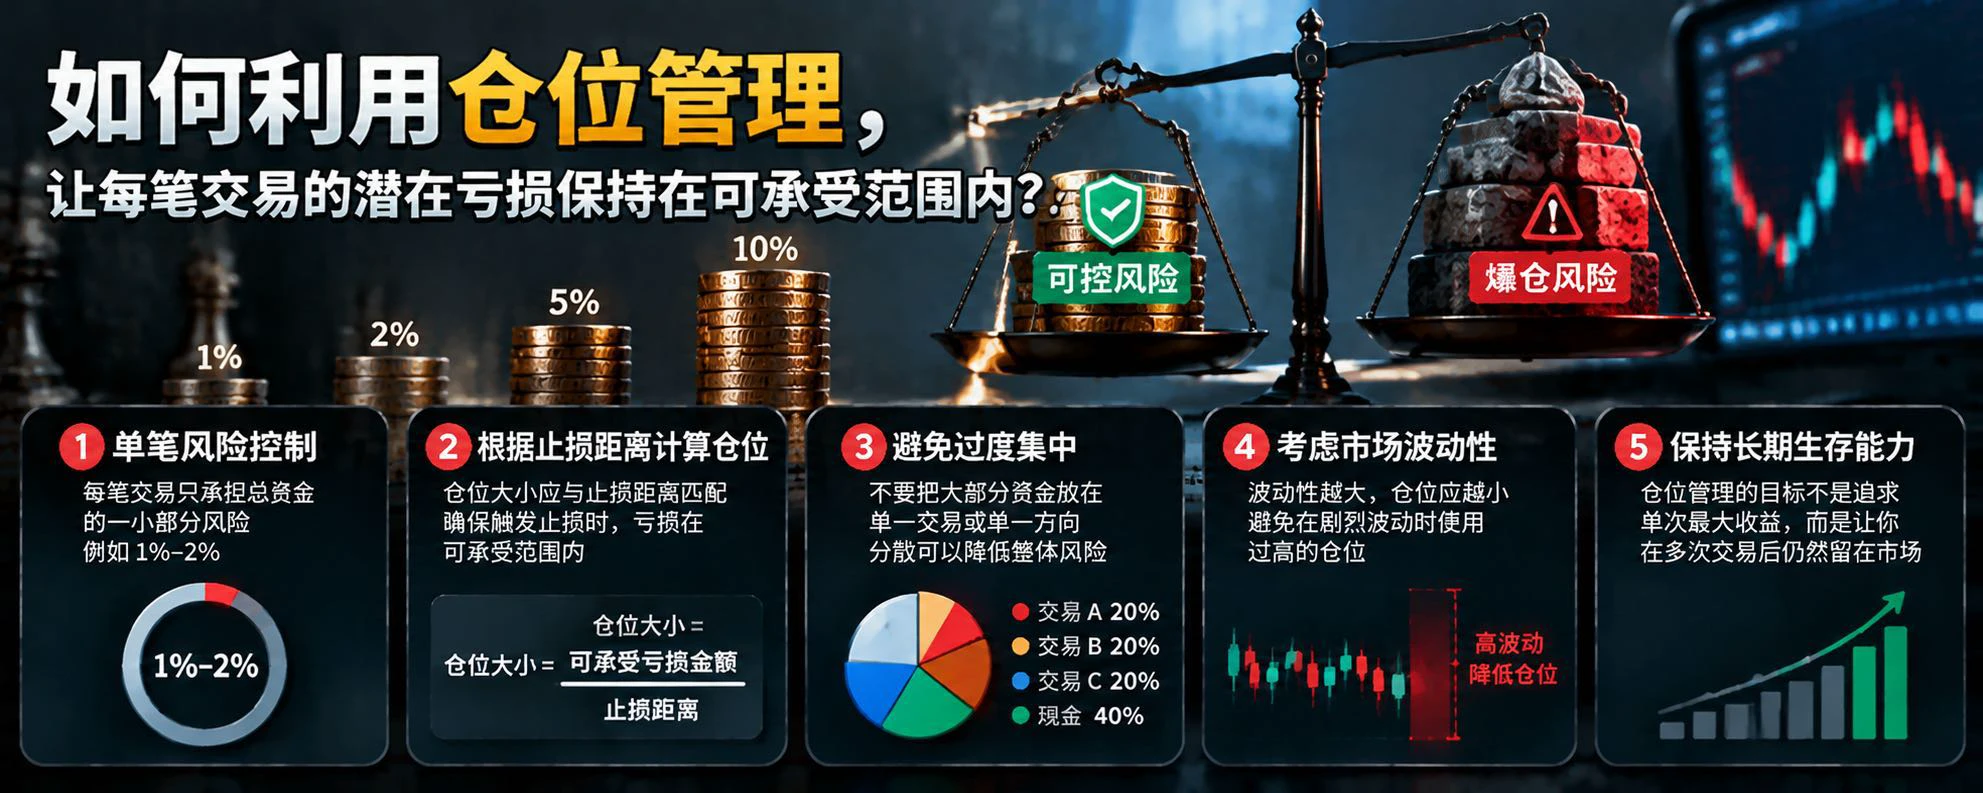
Don’t get carried away. Position sizing always comes first; trade according to what your account can handle
post-image
LYN-0.44%
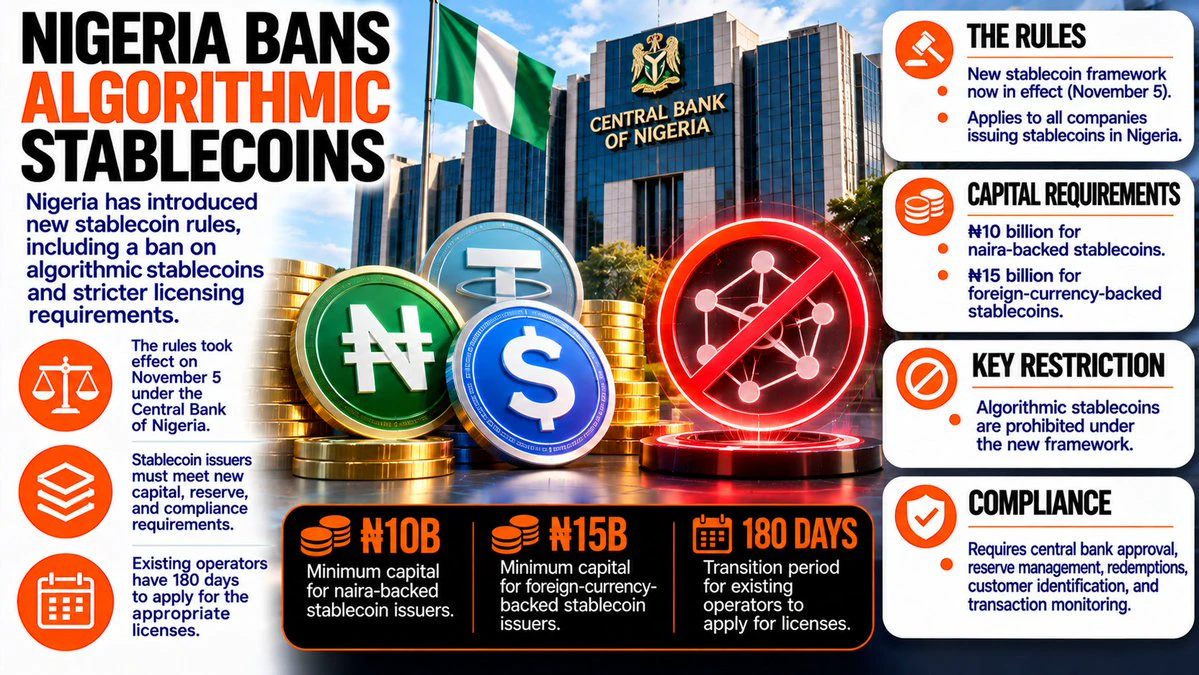
Nigeria has introduced new rules for stablecoin issuers, including a ban on algorithmic stablecoins and stricter requirements for companies operating in the country.
The regulations took effect on November 5 under the Central Bank of Nigeria.
Under the new framework, stablecoins are divided into two categories.
Companies issuing naira-backed stablecoins must maintain at least ₦10 billion in paid-up capital, while issuers of foreign-currency-backed stablecoins need at least ₦15 billion.
Each stablecoin must also receive separate approval from the central bank before issuance.
But one of the big
post-image
What Is Monte Carlo Simulation? Why Can a Positive-Expectancy Strategy Still Lose Consecutively?

In cryptocurrency trading, even if a strategy has been backtested and has positive expected returns, that does not mean live trading will necessarily go smoothly. Consecutive losses and maximum drawdowns exceeding expectations can cause traders to abandon an otherwise effective strategy prematurely. Monte Carlo simulation is one method that can help us study these risks.

First, what is Monte Carlo simulation?

It repeatedly generates a large number of possible trading outcomes to examine the dist
post-image
@cz_ “Tokenized stocks trade 24/7, giving you an edge on news over the weekend.”
$FOLKS I think this coin is rising. Buy at 2.410 and 2.365. Targets: 2.490, 2.530, and 2.574. Stop loss: 2.315
post-image
FOLKS+0.88%
#bitcoin
Dominance up but
#bitcoin down
Correlation
🔴Means USDT d is oozing out the money on alts over btc
🔴Which is technically a good sign for the coming times
post-image
BTC-0.67%
Does anyone else like bouncy wings? I sure do.
AFTERNOON UPDATES ON THE CRYPTO MARKET
live-cover
LIVE2,300
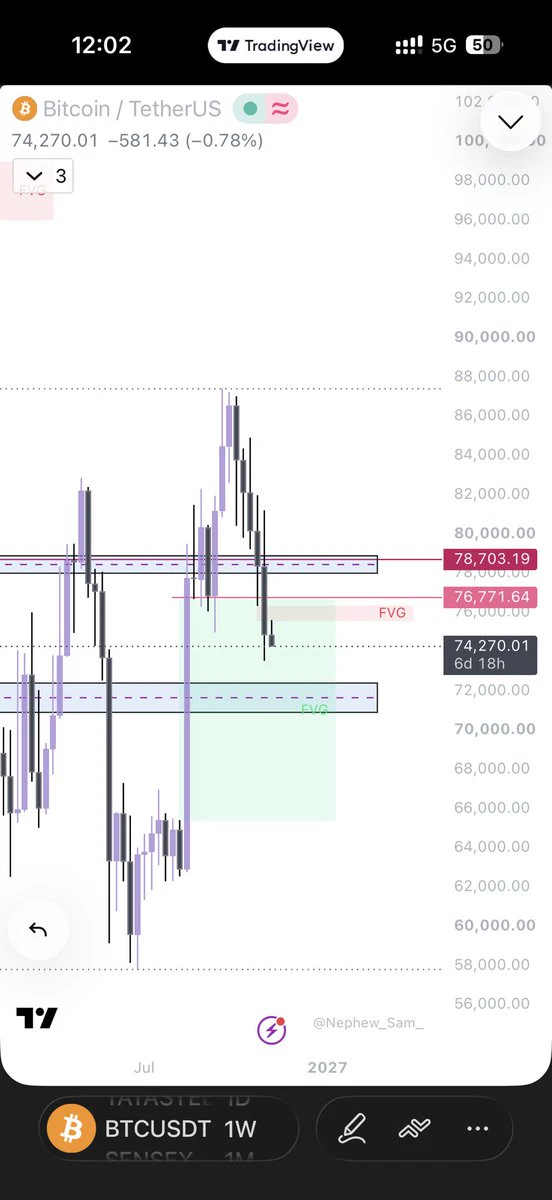
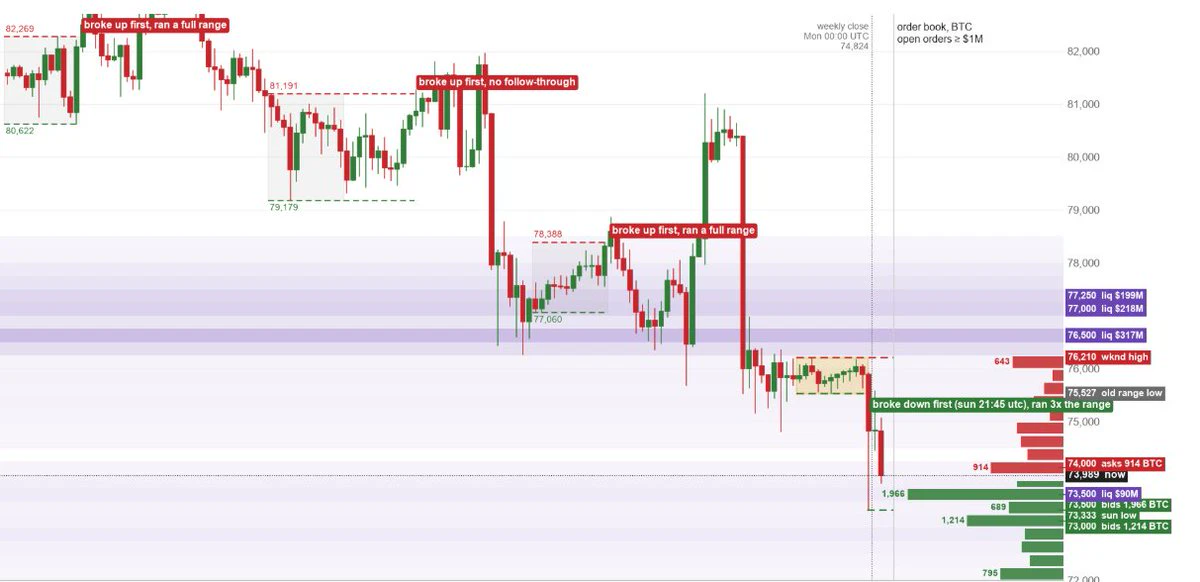
4 weekends in a row took the high first, this one broke down sunday night instead and ran 3x its range, big bids 73.5k under us, liq pile 76.5k above bitcoin:native . Hopefully NY opens in style...
post-image
BTC-0.65%
$SOL
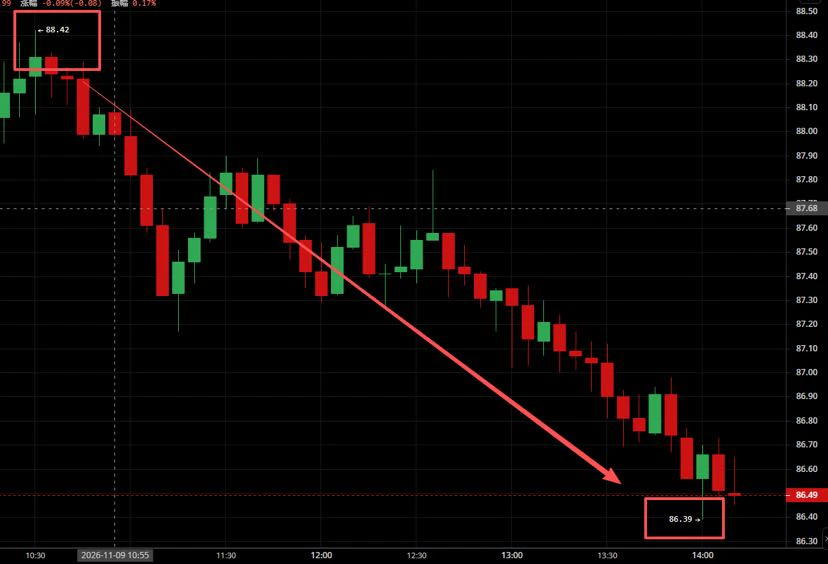
The rebound faced resistance and was rejected precisely, with the short trade's downside playing out gradually
The morning call was to establish short positions in the 88.0-89.5 range. The market climbed to 88.42 before stalling at the resistance zone, then began to pull back amid choppy trading, reaching a low of 86.39. The bearish move unfolded exactly as expected.
#美国10月CPI即将公布
The broader downtrend remains intact; the oversold rebound is merely a pause along the way.
The first downside target is 85.5. If it breaks decisively, the price could continue falling toward the 83.5 area. St
post-image
Top-OutMemo
11.9 SOL Outlook for Today
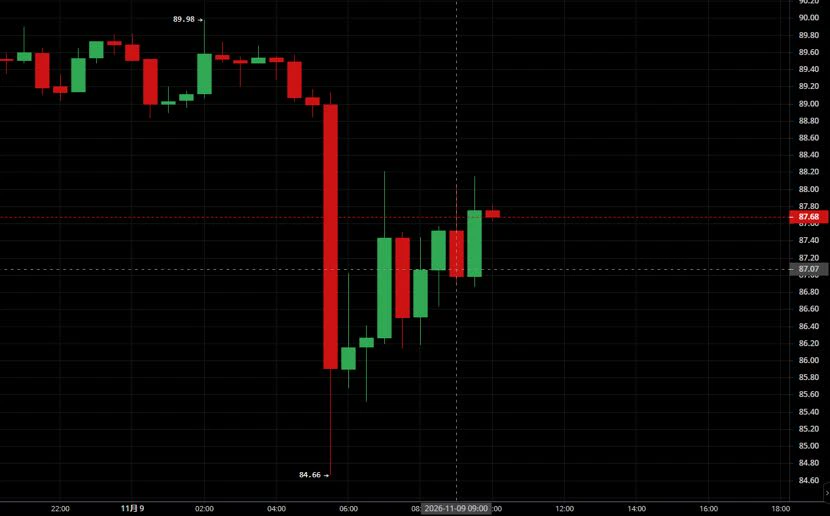
After dipping to an overnight low of 84.66, SOL staged an oversold rebound. It is currently in a weak recovery phase, and the broader bearish trend remains intact. The rebound is expected to face resistance, with further downside still likely. Focus on shorting rallies, with short-term longs at support as a secondary strategy.
#70%山寨币跌破200日均线
Support: 86.0-86.5, 84.5-85.0
Resistance: 88.5-89.0, 89.5-90.0
Short: Enter in batches on a rebound into the 88.5-89.0 range, with a stop-loss at 90.2. First target: 86.5; if the level breaks, look to 85.0
Short-term long: If the price stabilizes after retesting the 86.0-86.5 range, consider a small long position. Enter and exit quickly. Stop-loss: 84.6; target: 87.8-88.2
repost-content-media
SOL-0.77%
Load More

Join 40 M users in our growing community

⚡️ Join 40 M users in the crypto craze discussion

💬 Engage with your favorite top creators

👍 See what interests you

Trending Topics

USCPIDataIncoming

28.2k Views1.84k Discussing

The U.S. October CPI report will be released on November 10 at 8:30 a.m. ET. September CPI came in at 3.7% year over year, and markets will be watching closely for signs that inflation is cooling, especially in core CPI. A softer-than-expected reading could strengthen rate-cut expectations, while hotter inflation may pressure risk assets through higher Treasury yields and a stronger dollar. How do you think this CPI print will move $BTC, U.S. stocks and gold?

RedBullDoublePodiumInBrazil

1.76k Views30.52k Discussing

BTCFlashCrash

72.71k Views66.21k Discussing

View More