
Share your thoughts
placeholder
Article
Why is everyone suddenly watching $MU /USDT when the 1h price sits at 974.96?

$MU /USDT - SHORT

Trade Plan:
Entry: 974.24 – 975.64
SL: 981.68
TP1: 969.89
TP2: 966.52
TP3: 961.47

Why this setup?
Why now? The daily trend is a range, which means the market has been consolidating and is primed for a directional breakout. The 15m RSI sits at 50.63, showing the short-term momentum is balanced but leaning toward sellers. The 1h ATR of 2.806919 indicates enough volatility to push the price from the entry zone at 974.94 down toward the first target of 969.89 and then the second target at 966.52.
MU-0.56%
No conviction, can’t hold on, this round’s profits are paper-thin, but I love it. 😆 What you can pocket is yours; if you get too greedy, you often end up with not even the soup left. It may sound timid, but in futures, staying alive matters more than anything.

During the repeated intraday swings, I kept my eyes on the $AKE bottom area. The price pressed down several times but couldn’t break that line, and the signs of funds quietly entering were simply too obvious. Building a base without breaking down is basically handing me an entry. Around 0.0088431, I went long directly. Don’t lose pati
post-image
AKE+16.43%
BNB+0.08%
ETH-1.01%
This isn’t a rebound—it’s sticking a tube into an account that was about to flatline. While watching $BR build a base intraday, I saw BR hold after the pullback and funds quietly enter, so I said that as long as the key level held, a rebound was possible. Opened long at 0.21096, now 0.24929, +359.79%. The timing was spot-on—painfully sluggish at first, but the breakout feels great.

Managing risk in advance is called being rational; cutting losses afterward is called making a heroic sacrifice.

Have a strategy before the session, discipline during it, and reflection afterward.

Take 80% in
post-image
BR-2.58%
LAB-10.07%
BNB+0.08%
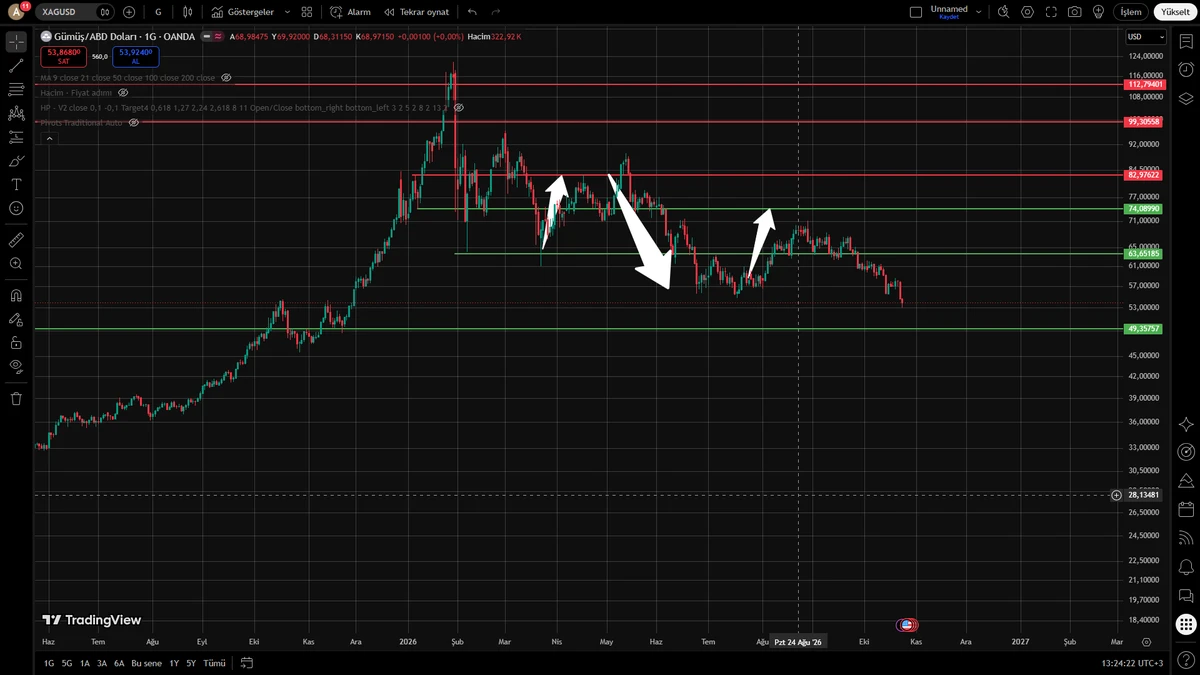
#XAU
Gold has reached a point where the next move is likely to tell us much more than the last one.
The interesting part is that gold did not simply collapse after the latest U.S. inflation report. August CPI came in at 0.4% month-on-month and 3.4% year-on-year, while core CPI increased 0.3%. That pushed markets toward a much higher probability of a Fed rate hike next week, which should normally be a clear headwind for gold.
Yet buyers stepped back in.
That reaction matters.
The latest verified Friday spot pricing placed gold around the $4,350–$4,360 area after a volatile session that traded
#BonkGuyBullishOnUSELESS
Bonk Guy calling $USELESS a potential meme king definitely gets attention, but for me, the more interesting question is whether the market itself is starting to validate that narrative.
Right now, USELESS is trading around $0.22, with the latest market data showing a 24-hour range of roughly $0.2045 to $0.2573. CoinMarketCap is also showing the token around the same area, with a market cap near $212M and roughly $95M in 24-hour volume. The exact price varies slightly between data providers, but the bigger picture is clear: liquidity is still substantial for a meme ass
post-image
USELESS+3.90%
I wasn’t watching the charts or even thinking about it—it was jumping on its own, like it was working overtime for me. When I checked the charts after lunch, $BTC was still bottoming out on BTC without breaking down, so I stayed with the long signal around 63014.1.

It took off, and 77107.9 gave the answer directly. A +3889.75% return is sitting there—we can afford a good meal.

Take profit on 80% first, and protect the remaining 20% at the entry price. Don’t get greedy for the last bite; if it keeps surging, let the profits run.

Hold as long as the trend remains intact; run if it breaks
post-image
BTC-0.24%
ZEC-4.92%
BNB+0.08%
$KOMA Signal】Long + 1H pullback/4H MACD expansion
$KOMA Order book depth -20.44%, Bid/Ask 0.66, with a relatively thick sell wall near the 1H upper band. The 1H high of 0.017394 pulled back, and the current price of 0.016579 is hugging the Bollinger upper band. The 4H MACD bullish histogram is expanding, with price running above the EMA20/50. 1H RSI is 67.5, 4H RSI is 67.78, and momentum remains hot. Funding rate is 0.0065%, with stable OI. Enter long in the 0.01652926 - 0.016579 range, with 0.01575005 as the defense line. The current price is approximately 4.9% from the stop-loss, and the ri
post-image
KOMA+24.23%
BTC-0.22%
ETH-0.95%
SOL-0.41%
This $MAGMA short position was opened on resistance at a high level. I didn’t rush to add after entering; I set the protective stop first to prevent a wick from triggering a stop-hunt. At this level, I’m looking for a pullback rather than chasing longs.

The price failed to hold above the previous high on the push, and volume didn’t follow through. I continued holding after the false breakout and pullback. There was some stop-sweeping in between, but it didn’t hit my protective stop, and the rebound was also weak.

This time, I handled it in batches at 80/20: taking profit on most of the po
post-image
MAGMA+0.28%
SNDK-0.47%
SOL-0.39%
I was just about to go in and vent, but then I looked at the account and decided to forget it—let it pump however it wants; I’ll keep quiet. When I opened the charts this morning, $DOGE had already left DOGE’s bottoming zone, with funds quietly flowing in. I flagged a long position around 0.07003.
That felt really good. The timing was spot-on, and 0.08474 put +1951.32% right in front of us. Those who endured without giving up should understand.
Take 80% in profits first, move the stop-loss closer to the entry price, and keep holding the remaining 20%. If it keeps surging, let the profits run.
post-image
DOGE+0.32%
BNB+0.08%
BTC-0.24%
Everyone is ignoring this bearish setup on $H /USDT right now.

$H /USDT - SHORT

Trade Plan:
Entry: 0.08168 – 0.08274
SL: 0.08730
TP1: 0.07839
TP2: 0.07584
TP3: 0.07202

Why this setup?
Why now? The daily trend is bearish, the 1h price sits at 0.08220, the 15m RSI is 38.37, the 1h ATR is 0.002122 and the entry zone sits at 0.08221. The bearish trend sets the macro direction, the low RSI shows momentum is already weak and the 1h ATR tells us the recent volatility is small enough to target a clean move. The entry zone gives the precise trigger, TP1 at 0.07839 and TP2 at 0.07584 define the pr
H-2.97%
#AIStockGuruReportedlyBullishOnAI
The AI comeback story is getting interesting — but I’m watching two names more closely than the rest.
I came across the latest chatter around Leopold Aschenbrenner’s Situational Awareness fund, and this is not just another “AI is bullish” headline.
The fund suffered a brutal 67% drop in portfolio value during July after leveraged AI and semiconductor positions were hit by the global chip-stock selloff. Most of the public book was subsequently liquidated, but the story did not end there. Recent reporting says Aschenbrenner is now rebuilding technology exposure
post-image
AMD+2.54%
SNDK-3.49%
INTC+2.63%
SK Hynix-2.21%
SKHY+1.00%
$1000 to $100,000 Crypto Trade Challenge Today
live-cover
LIVE538
#WeeklyShare
CPI REACTION: WHAT IT ACTUALLY MEANS FOR CRYPTO AND STOCKS
THE TAPE
August CPI landed on 11 September and the first move was hawkish. Bitcoin opened Friday at $76,529, dipped to $76,040 within minutes of the print, then reversed hard climbing as high as $79,837 before settling the session near $79,007, a 3.24% gain. Equities followed the same shape: the S&P 500 had closed 0.58% lower at 7,591.70 the day before, its fourth straight decline, yet by Friday's close the Dow had added 622 points (+1.2%), with the S&P 500 and Nasdaq each up 1.1%.
THE THREE CHANNELS THAT ACTUALLY MOVE CR
post-image
  • 2
86% CHANCE FED HIKES RATES NEXT WEEK!
Higher rates could bring more pressure on risk assets, including crypto and stocks.
What do you think?
Can the Fed actually go for a rate hike next week? 👍 or 👎
#GateTop4MainstreamCEX
#GateAugustTransparencyReport
post-image
  • 2
  • 2
【$Lobster Signal】1H overbought flattening + 4H volume continues to drive, buy on pullbacks
$Lobster 1H RSI 85.20, with the 4H Bollinger upper band at 0.1416 repeatedly pressed by price. Order book depth imbalance is 11.86%, with strong bids below and selling pressure quickly absorbed.
The 4H MACD histogram at 0.0115 continues to expand, with bulls taking the initiative. The 1H MACD histogram turned negative at -0.0004, indicating short-term momentum is flattening. The funding rate is 0.0576%, with a moderate cost for long positions and short-squeeze fuel still in place. OI is flat, with no unc
post-image
龙虾+134.30%
This isn’t a rebound—it’s a lifeline for an account on the verge of breaking.
I opened the charts this morning, $SOL held after the pullback, and funds quietly moved in. I judged this move wasn’t just a one-day pump. I only gave one reminder at the time: longs can follow, but protection is a must.
From 75.33 to 101.4, unrealized profit +3219.32%. Nailed it. It was truly sluggish at first, but the payoff is truly sweet.
I’ve put most of it in my pocket first, taking profit on 80% and protecting the remaining 20% at breakeven. The prerequisite for compounding is staying alive; the shortcut to g
post-image
SOL-0.39%
ZEC-4.92%
XRP+0.29%
#Gate主流CEXTop4 GATE HOLDS TOP 4 IN AUGUST WHAT THE NUMBERS ACTUALLY SAY
THE HEADLINE The August mainstream CEX rankings are out, and Gate held its position inside the global top four. The reported figures: roughly $40 billion in spot trading volume and approximately $285 billion in derivatives volume across the month, placing the platform fourth among mainstream exchanges worldwide.
That is a position earned in a difficult month, not an easy one.
THE AUGUST BACKDROP August was not a quiet month for exchange flows. Aggregate derivatives volume across major venues rose by roughly 14% month-on-mo
post-image
POV: You got rich in crypto and now your biggest problem is withdrawing the money.
post-image
#ZECPlungesOver13%
#ZEC跌超13%:
Zcash Faces Sharp Correction After Powerful Rally
Zcash (ZEC) has entered a period of intense volatility after experiencing a sharp correction of more than 13%. The move has attracted significant attention across the cryptocurrency market because ZEC had recently delivered one of the strongest rallies among major crypto assets.
At the latest available market reading, ZEC is trading around $1,128, with the market continuing to show elevated volatility. Recent market data also shows that ZEC has traded significantly higher during the current session, demonstrating
post-image
ZEC-4.89%
BTC-0.22%
ETH-0.95%
  • 4
Load More

Join 40 M users in our growing community

⚡️ Join 40 M users in the crypto craze discussion

💬 Engage with your favorite top creators

👍 See what interests you