Square
Following
Hot
News
Profile
Share your thoughts
placeholder
Article
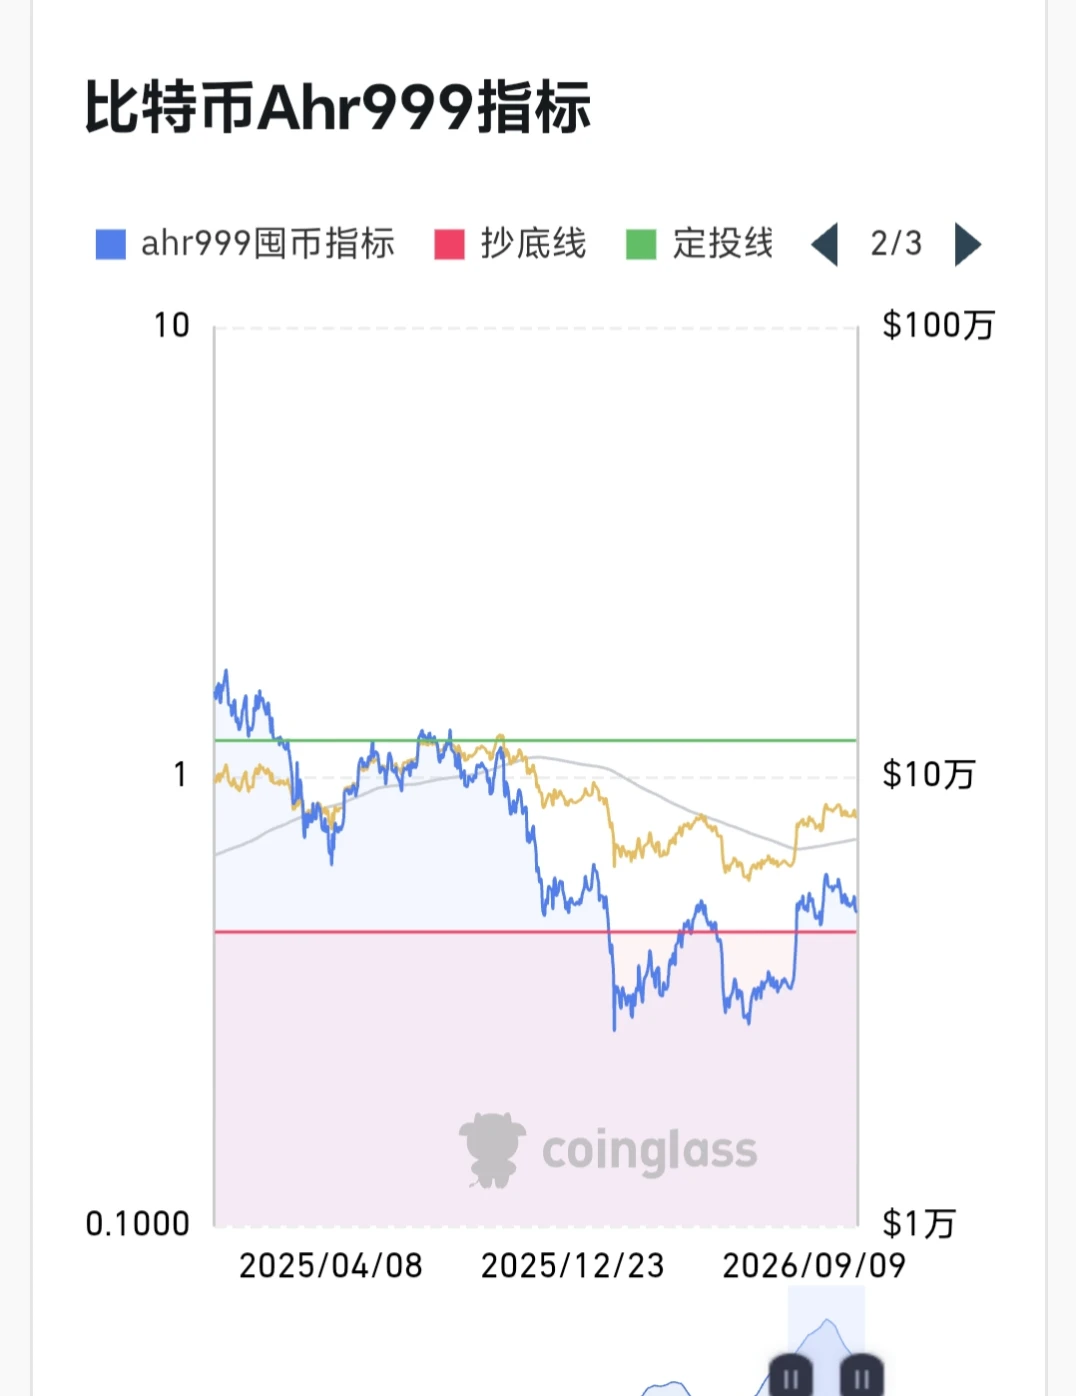
I think the current crypto market is in the early recovery phase after the cycle low, currently pulling back and waiting for secondary confirmation:
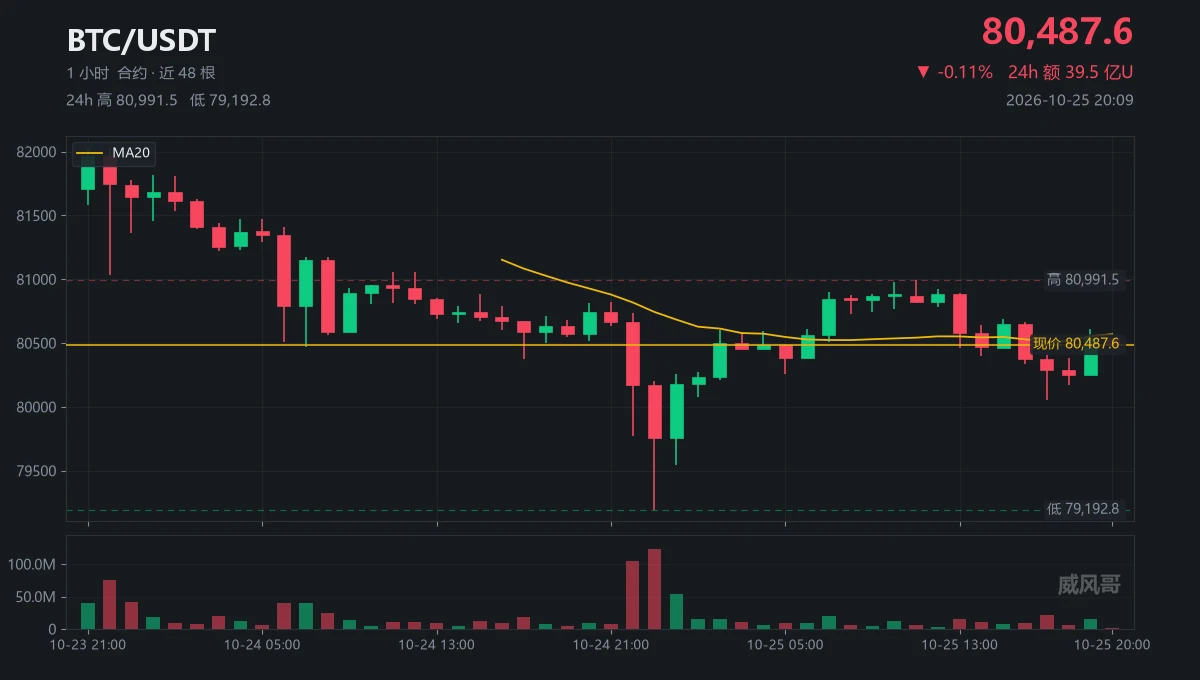
• BTC at around $81,500, down about 35% from its October 2025 ATH of $126,000
• This cycle’s low was around $58,000 in June-July 2026 (a drawdown of about 54%, relatively shallow historically)
• Q3 total market cap rose 39.6% to nearly $3T, with ETFs returning to net inflows
• Fear & Greed Index at around 53 (neutral)
• BTC dominance at around 59-60%
Institutional consensus: the bear market is over, and the market is transitioning from acc
post-image
ETH-0.60%
BTC+0.03%
$ELA SEND IT TO THE STARS!
post-image
ELA+8.25%
Trenches
AGT
A
bade
b
AGT
0x5d...e274
Market Cap
$.
Change
.
24h Vol
$.
Holders
.
CNPY
C
bade
b
CNPY
0xc6...ddd2
Market Cap
$.
Change
.
24h Vol
$.
Holders
.
Q
Q
bade
b
Q
0xc0...0589
Market Cap
$.
Change
.
24h Vol
$.
Holders
.
Gato
G
bade
b
Gato
55A3...pump
Market Cap
$.
Change
.
24h Vol
$.
Holders
.
DOPE
D
bade
b
DOPE
0xf9...8899
Market Cap
$.
Change
.
24h Vol
$.
Holders
.
Sunday, October 18 [Macro]
✅The US postpones imposing a new round of large-scale sanctions on Russia
✅The ECB warns that geopolitical conflicts are driving up inflation risks
📅Sunday, October 18 [Geopolitics]
✅Strait of Hormuz: Iran opens fire to intercept vessels in violation, and an oil tanker hits a mine and catches fire
✅Ukraine: Ukraine and the US may begin a new round of talks as early as next week
✅Egypt says it can provide security protection at Saudi Arabia's request
#DOGE #WCTCS9 Dogecoin May See Its First Major Daily Death Cross of 2026: Is a Potential Trend Reversal Coming?
A potential trend reversal could offset bearish pressure and invalidate the current pattern.
Dogecoin could see its first daily death cross of 2026 as moving averages suggest they will converge in the coming days. The daily 50-day moving average is currently trending downward, while the daily 200-day moving average is flattening, highlighting the potential for a death cross. Dogecoin saw its first daily golden cross since 2026 in October, but profit-taking in the crypto market drove
post-image
ThisIsTranslateContent:
#DOGE #WCTCS9 Dogecoin may see its first major daily death cross of 2026: Is a potential trend shift approaching?
A potential trend shift could counter bearish pressure and invalidate the current setup.
Dogecoin could see its first daily death cross of 2026, as moving averages point to convergence in the coming days. The daily 50-day moving average is currently sloping downward, while the daily 200-day moving average is flattening, highlighting the potential for a death cross. Dogecoin saw its first daily golden cross of 2026 in October, but profit-taking in the crypto market drove its price down to a low of $0.077. Bears seem to be making an aggressive effort to negate this bullish signal, with the possibility of a death cross drawing near.
The timing of a death cross remains uncertain, as a trend shift could counter the bears’ push and invalidate the current pattern. At the time of writing, Dogecoin was up 3.19% over the past 24 hours to $0.081, after briefly selling off as investors weighed higher-than-expected inflation data and the latest remarks on interest rates from Fed Chair Kevin Warsh.
Inflation data released this week was strong: the Producer Price Index released Thursday showed wholesale prices rose 6.3% year over year in September, the biggest increase since 2022. The Consumer Price Index also rose in data released Wednesday. Fed officials responded in September by approving the first rate hike in more than three years; markets expect the Fed to hold rates steady in October and hike again in December.
Could a trend shift be coming? The last time Dogecoin saw a death cross on the daily chart was in November 2025, followed by months of selling until a golden cross appeared recently. This has focused market attention on price action in case a death cross ultimately appears again.
Crypto analyst Ali recently posted a contrarian take on X, sharing three reasons to be bullish on Dogecoin.
First, the TD Sequential indicator has previously marked potential turning points for Dogecoin several times, and this time it issued a buy signal on the daily chart as the price neared $0.081.
Second, URPD data shows that about 36 billion DOGE previously traded near $0.081.
Third, whales appear to be buying near this support level, having accumulated 600 million DOGE since October 12.
If $0.081 holds and Dogecoin rebounds, Ali identifies the $0.16 to $0.17 range as a potential profit-taking zone. $DOGE
repost-content-media
DOGE-0.92%
Market anylysis today BTC and other coin 👛🪙
live-cover
LIVE1,738
Most people are focused on a tariff breakthrough. I think the market will drop first. The court has ruled, but the tariff agenda isn’t dead—it’s just lost its easiest path. After doing this for so long, I know position sizing is always more important than calling direction. Let’s compare notes this weekend.
post-image
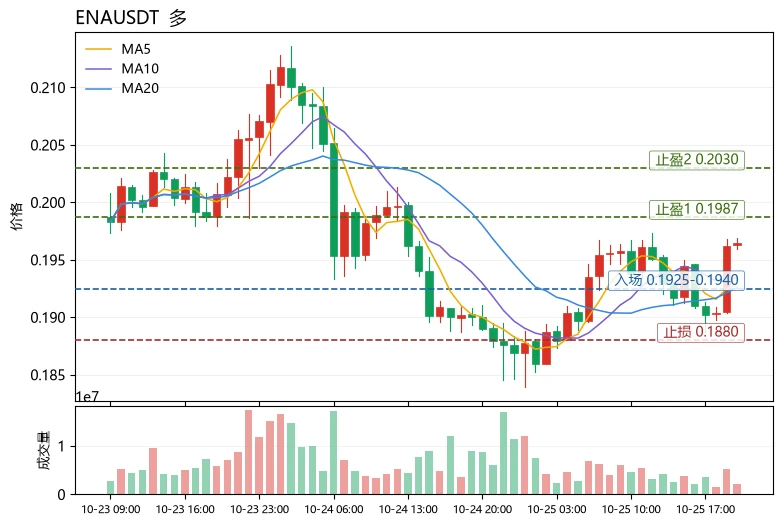
The most unusual detail in today’s market action isn’t the declines themselves, but relative strength: $STRK fell 12.04%, $BAT fell 9.28%, while $ENA
in the same sector fell just 5.23%. Its RSI of 37.4 is also higher than STRK’s 31.3 and BAT’s 36.7. The smaller decline and higher indicator suggest selling pressure has been released more gradually, with funds not rushing for the exits.
But relative resilience doesn’t mean a reversal is underway. ENA is currently at 0.1885, still below MA5=0.18964 and MA20=0.193345, with the bearish moving-average alignment yet to recover. The MACD histogram
post-image
STRK-11.46%
BAT-10.56%
ENA-4.39%
AVAX keeps sliding, bears are in control, heading straight for 9.30! Short $AVA .
Entry: 9.727 - 9.776 Take profit: 9.277 - 8.897 Stop loss: 10.069 Note: If the 9.55 support level suddenly rebounds, it could trap people chasing shorts. Don't go all in, buddy. Position size should suit your own account. Watch the downtrend. 👇👇👇 Continue to follow $AV and $BTC .
post-image
BTC+0.03%
A few days ago, I strongly urged a friend
to bet on AVA, and it has doubled now
You ask me why my bets are so accurate
It’s all insider information🤓
Some people pick coins by looking at altcoin holdings/market cap
and trading volume
Actually, this is not much different from guessing high or low
These are all metrics that market makers can easily inflate, at a very low cost
AVA+33.23%
$EPIC It surged 18% in a day, briefly touching 0.3350 before dumping back to 0.2884. That long upper wick is no joke.
First, the signal: this is a classic high-volume spike and retracement. The 24-hour trading volume of 72.2M alongside an 18.29% gain shows the volume is real, but that wick at 0.3350 indicates very heavy overhead selling pressure. From the low of 0.2182 to 0.3350, the price gained 53%, so profit-taking at this level is perfectly normal. Technically, 0.2884 sits just below the midpoint of the intraday gain, putting it in the pullback confirmation phase—not a breakout entry poin
EPIC+23.19%
EIA data determines the short-term direction of crude oil
live-cover
LIVE1,421
Down 20.9% in forty hours; the rebound took just three hours.
Someone asked: Is the sell-off over?
I said: Look at the volume first.
The 05:00 candle plunged to 86.7, with 16.34 million traded in a single hour.
The previous candle had only 850k.
Nineteen times.
Then they asked: Can I buy in?
I said: Before buying in, first look at why I’m not.
$SOXL Now at 91.92, with 93.70 overhead and 5.7% downside to 86.7.
There are no signals in this range, only noise.
Then they asked: How long should I wait?
Wait for a retest of 86.7 that holds, or for the price to reclaim 93.70—one of the two has to hap
post-image
SOXL-3.00%
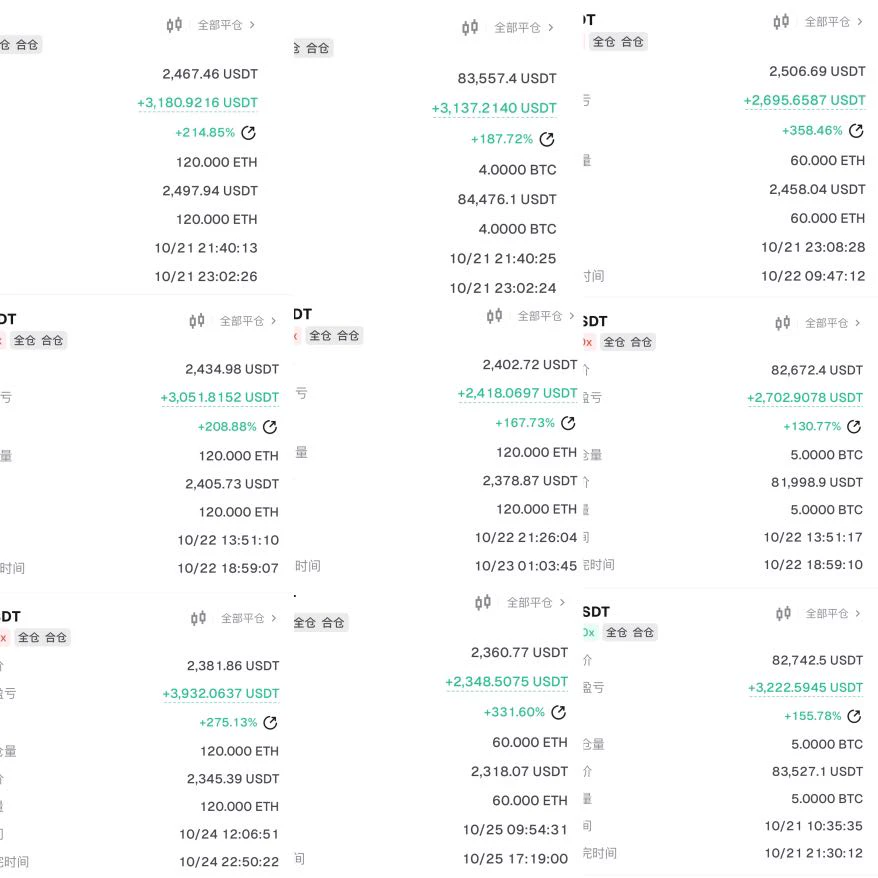
The ETH subscription signal called for a long near 2364; we hit take-profit perfectly and banked gains.
Subscribers are feasting every day
post-image
ETH-0.60%
  • 1
10.18 Day Trading Strategy: Iran Opens Fire, Tensions Escalate, Institutions Exit, Grid Trading at High Levels
“The crypto fuel theory”: Most people are fuel. The market keeps cultivating your sense of direction, then gets you used to that direction, before one reverse wick ultimately burns through all your U.
The higher the win rate, the greater the losses; the more closely you watch the charts, the more liquidations you suffer. The market goes “against human nature.”
Surviving in crypto is not about watching charts or having a high win rate, but about your profit-to-loss ratio when closing p
ETH-0.62%
Let’s start with a term: weekend gold prices.
The $XAU on screen isn’t gold moving now; it’s quotes with no takers shifting around.
Only 5.97 million traded in the last hour, compared with 150 million in a single hour a few days ago.
“Breaking above 4205 means a new rally.”
I’ve heard that twice in the past three days. Here are the numbers:
1. 4205.65 was touched only once, at 10-16 22:00, and it hasn’t gone higher since.
2. Since then, over the past 34 hours, it has steadily ground back to 4164.07.
3. The 24-hour range is 4157.36 to 4173.66, a spread of 0.39%.
With a range this narrow, it’s
post-image
XAU-0.17%
$CAKE Current price: 2.19. Key short-term levels are 2.157 (Bollinger lower band) and 2.1967 (MA20). In terms of moving averages, MA5=2.1936 remains below MA20, indicating a weak bearish alignment, but the gap is only 0.003, and the convergence of the moving averages means a directional move is approaching; the MACD histogram at -0.002064 is bearish, but its absolute value is extremely small, suggesting momentum is nearly exhausted; RSI at 48.0 is in neutral-to-weak territory, with neither oversold rebound momentum nor overbought pullback pressure; the price is near the Bollinger lower band a
post-image
CAKE+0.70%
LSK+12.48%
ERA+16.56%
Online Lending Life with a market cap of 110k—are you sure you don't want to buy?
$DOGE Current price: 0.07909. The first resistance above is 0.0799, where the Bollinger midline and MA20 converge. Support is at the lower Bollinger Band at 0.0786; a break below opens up room to 0.0780. The chart is in a bearish alignment: MA5 at 0.07937 is below MA20 at 0.07989, the MACD histogram remains negative at -5.47e-05, and RSI at 41.3 is weak but not oversold. The 30-candle range is only 5.17%, indicating a low-volume drift down rather than panic selling.
The real point of contention is the funding rate: at -0.0009%, it is negative, with shorts continuously paying longs, indicating
post-image
ZEC-1.32%
The bull market is coming, bro 🥹🥹 I relate so much ahhhh $HYP l $ASTER l $SUI holders
post-image
SUI-2.57%
  • 1
Load More

Join 40 M users in our growing community

⚡️ Join 40 M users in the crypto craze discussion

💬 Engage with your favorite top creators

👍 See what interests you

Trending Topics

USSeptemberPPIBeatsExpectations

91.35k Views1.93k Discussing

US September PPI came in at 6.3% YoY, well above the 5.3% market expectation, pointing to renewed producer-side inflation pressure. Weekly jobless claims were 199K, broadly in line with forecasts. Could hotter inflation further reduce room for rate cuts, and what does it mean for $BTC, US stocks, and gold?

GateWCTCS9GlobalTradingCompetition

37.87k Views6.68k Discussing

GateBTCAndETHFuturesVolumeRanksTop3

53.8k Views1.81k Discussing

View More