Share your thoughts
placeholder
Article
morning update
live-cover
LIVE1,864
Makes sense!!
Makes sense!!
Everyone’s staring at LTC’s 50.76—but the 4h chart is quietly screaming a trap.

$LTC /USDT - SHORT

Trade Plan:
Entry: 50.67 – 50.85
SL: 51.60
TP1: 50.13
TP2: 49.71
TP3: 49.08

Why this setup?
Why now? The 1D trend is a *range*, not a breakout—so 50.76 is the fulcrum, not the finish line.
- RSI 15m at 54.49 shows zero momentum behind the bounce; it’s a dead-cat wiggle, not a push.
- ATR 1h at 0.35 means volatility is thin—perfect for a liquidity sweep below 50.25 (invalidation) before shorts fill.
- Entry zone 50.67–50.85 is the same spot where longs got stuck last week. Price loves
LTC-0.02%
Does $BSV Bsv have a trend similar to ZEC? 🤦🤦🤦
BSV+0.17%
I lack vision and can't hold, and the profit on this trade was paper-thin, but I loved every bit of it. A few days ago, the last thing I checked before bed was the chart. $LINK had clearly been moving sideways around 11.416 for an entire day, and every time it was dumped, funds happily stepped in to buy. The signs of bottom consolidation were right there. While others were fearful, I was greedy. I figured there wasn't much room left to fall from there, so I opened a long and took a position.

When I opened the app this morning, wow—it had been pulled straight up to 11.627, and at the key leve
post-image
LINK-1.45%
ZEC+8.66%
BTC-1.75%
Scumbag Watch Episode 4, 26.9.05, Beijing time 8:30
Figure 1: CRCL daily candlestick chart
U.S. stock closing price: 102.05; intraday high: 102.785; low: 97.10; down 1.14%
CRCL opened lower and moved higher yesterday. It still looks relatively strong for now. After filling the small gap around 104, another push toward 120 is not out of the question.
Figure 2: SOL daily candlestick chart
SOL closed above the 5-day moving average. Going forward, continue to monitor whether the 100 level will be decisively broken below again.
CryptoPlayerWithBadIntentions
Jerk Watch, Issue 4, 26.9.04 Beijing time 8:15
Figure 1: CRCL daily candlestick chart
U.S. stock market closing price: 103.23; intraday high: 103.28; low: 91.70; up 16.46%
As the jerk expected, crcl has no problem as long as it does not effectively break below the large bullish candlestick formed previously.
But today's performance did exceed the jerk's expectations, rising over 16% and nearly closing at the high. It completely made it impossible to get on board. So whether it can directly challenge the 150 level next, please wait and see patiently.
Figure 2: SOL daily candlestick chart
After sol found support at the upper boundary of the range, today's daily close provided strong confirmation. We will wait and see whether it will challenge the previous high again next.
Currently, crcl has also broken through the 100 mark. Of course, the SOL line was the one that reached the 100 mark.
The jerk is now launching a new prediction: which one will be the first to reach 150? Leave a comment and repost to participate.
Total prize pool: 200U
repost-content-media
CRCL-1.17%
SOL-1.79%
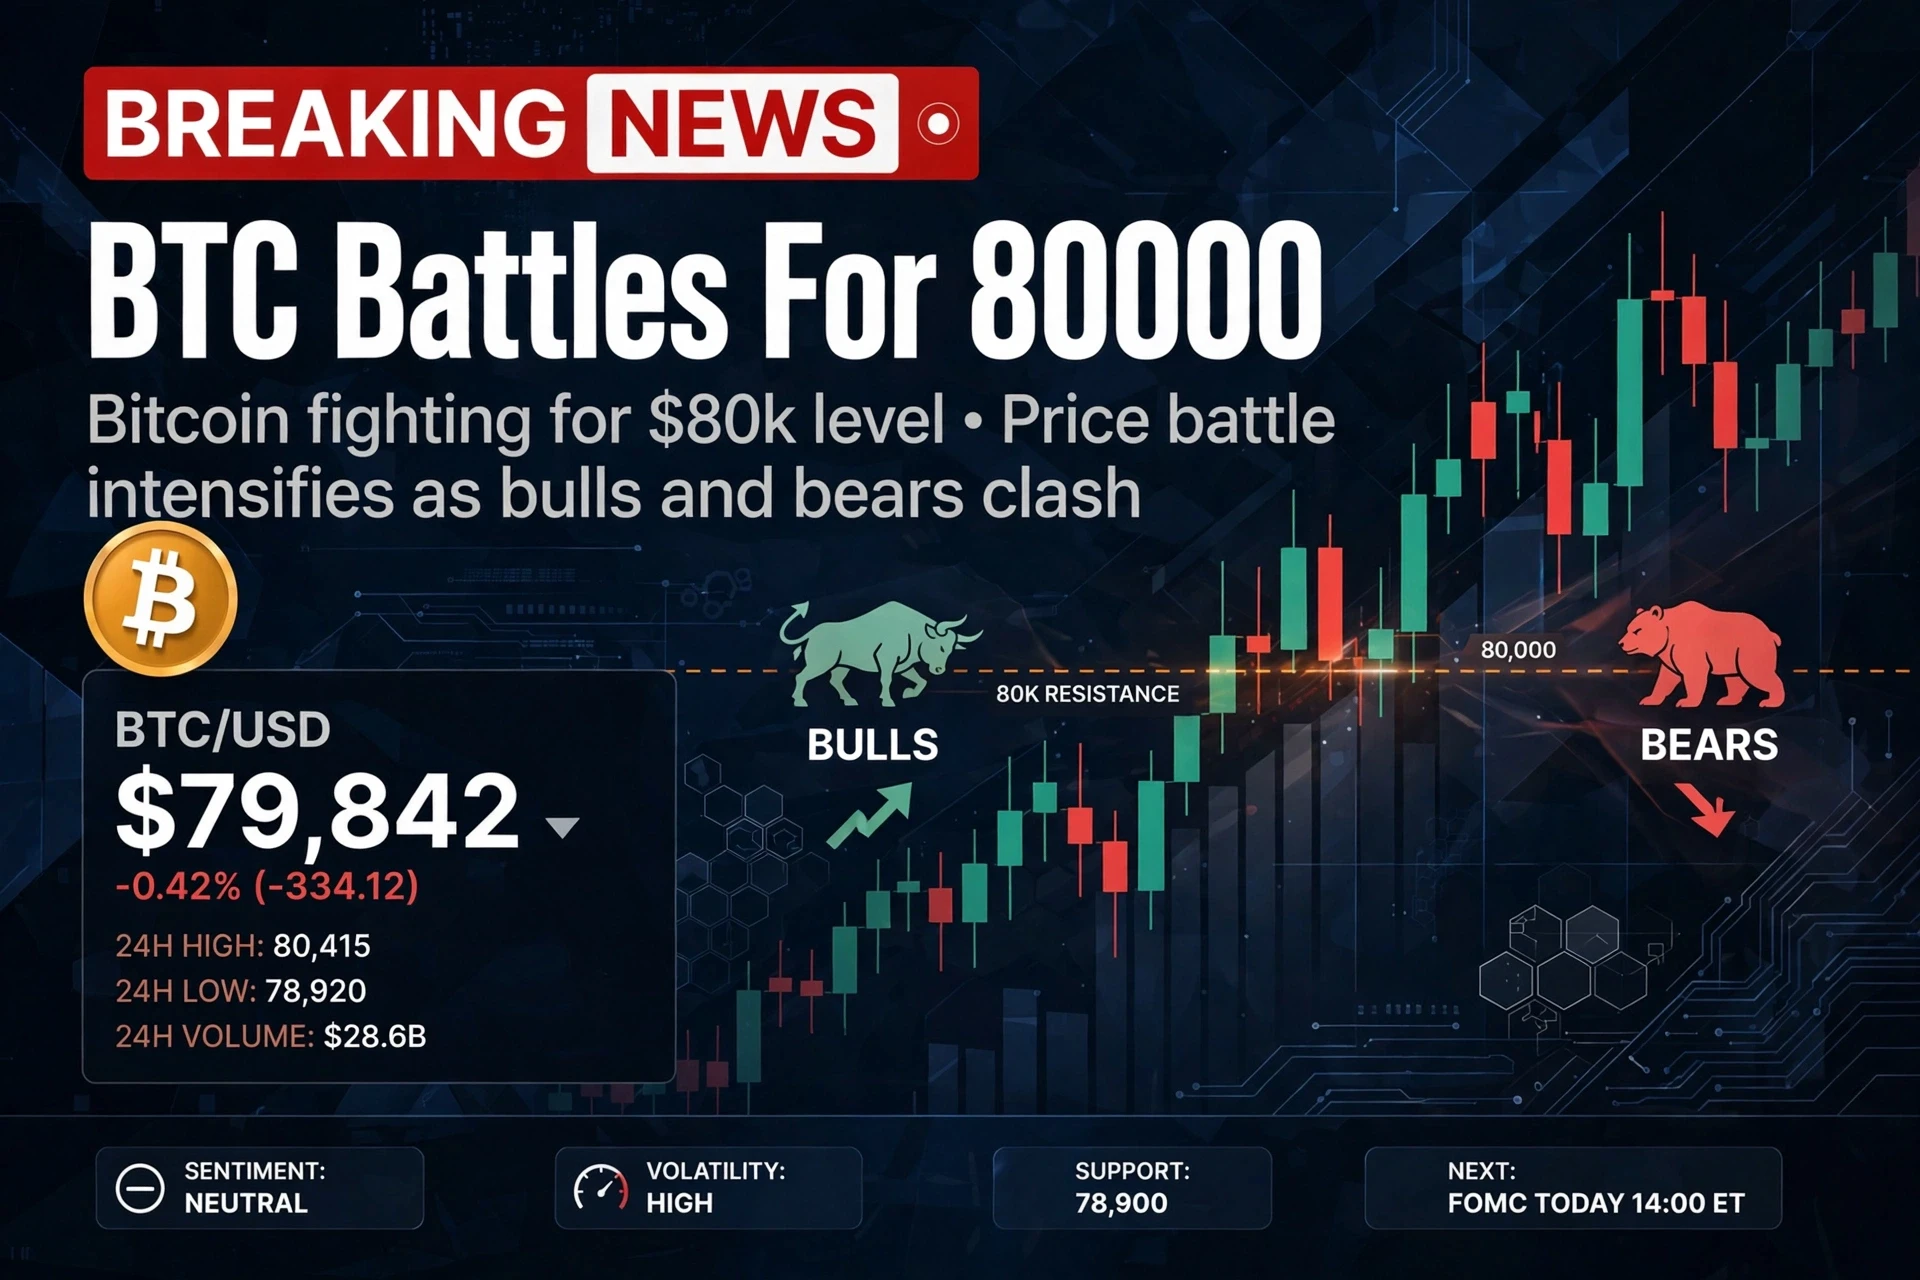
Bitcoin’s next big test is TODAY
BTC is hovering near $76.5K–$77K after US strikes on Iran spiked oil past $94 and revived inflation fears. Now the US jobs report drops today — and it lands into a market already pricing ~60% odds of a September Fed rate hike.
A hot number = more hike pressure = more heat on crypto.
A weak one could flip the whole mood.
Two macro bombs in one week, and BTC’s still outperforming gold and stocks.
Are you positioning before the print or waiting for the dust to settle?
BTC-1.78%
$1.025 to 0.24 in just 6 candles 😅
I know most of you are confused: "should you buy the dip" or "take a short position expecting it to fall? more..."
My suggestion is simple - the $CYS price is already near the 22-23 support zone. If we see any bullish candles with a strong comeback and volume, blindly take it. But losing support here would add fuel to further lows, with 16-17 being the next major expansion zone. Further lows are possible if sellers dominate.
post-image
CYS-7.31%
near finished charging and launched! #Gate用户突破6000万
$SOL Signal】4H large bearish candle + order book imbalance, short-side strike
$SOL The 4H large bearish candle engulfed the previous two bullish candles, with the price falling back to oscillate within the narrow 101.39-101.86 range. The 1H MACD histogram is -0.064, while rebound volume continues to shrink. Order book depth is imbalanced by -6.29%, with sell order thickness suppressing buy orders, and EMA20/50 creating overlapping resistance around 102. OI is stable, and short entries have not triggered panic liquidations. The current risk-reward ratio is 1:1.5, with moderate odds and the bea
post-image
SOL-1.68%
How is this a rebound? This is CPR for my account, isn’t it? $DELL It just hit 522.17, with +727.91% in the bag. I stared at the screen for several seconds to make sure I was looking at the right account.
When I opened the market this morning, buying pressure was clearly getting stronger, and each pullback was becoming smaller. It was obviously not an ordinary dead-cat bounce. Around 453.65, I said it plainly: the risk-reward here was good enough—take the loss if wrong, and if right, it would be a big win.
Looking back now, the timing was perfect. Here’s the position update: I took 75% off the
post-image
DELL+0.77%
SNDK+10.70%
BTC-1.75%
#Gate60MillionUsers , A Major Milestone That Shows The Power Of Global Crypto Adoption
Gate has reached an impressive milestone of 60 million users, marking another important chapter in the growth of one of the world’s major cryptocurrency exchanges. Reaching this level is not simply a number on a screen. It represents millions of people around the world choosing a platform where they can explore digital assets, trading opportunities, financial products, and the rapidly evolving blockchain ecosystem.
The crypto industry has changed dramatically over the years. What was once considered a niche
This move is so obvious I don’t even need to think—the account is dancing on its own. During the intraday plunge, $ACE kept falling just short every time it tried to push higher, with a weak rebound and insufficient buying support. I warned against rushing to catch a falling knife and went short instead, entering at 0.1903. Looking at it now, the current price is 0.1722, with a return of +234.52%—the timing was spot-on.

No vision, can’t hold—these profits are paper-thin, but I love it. I’ve taken 80% profit first, putting the bulk in my pocket, and moved the stop-loss on the remaining 20% t
post-image
ACE-5.60%
SOL-1.68%
ZEC+8.66%
$MARSCOIN Signal】Long Setup: Strong Order Book Support + Pullback Orders
$MARSCOIN Buy-side order book depth imbalance 33.2%, Bid/Ask ratio 1.99, with substantial bids below. The 1H MACD has formed a death cross, with the histogram at -0.0002; bearish momentum is visibly weak. The 4H Bollinger upper band is at 0.2125, while the price is still trading above the middle band. OI is stable, and the funding rate is 0.0498%, so the cost of holding long positions is not extreme.
🎯 Direction: Long
⚡ Entry/Limit Order: 0.1900182 - 0.1905900
🛑 Stop Loss: 0.1886841
🚀 Target 1: 0.1934489
🚀 Target 2
post-image
MARSCOIN+52.49%
BTC-1.78%
ETH-2.04%
SOL-1.79%
$Bull is coming ‌ Bull is coming, continue entering short positions; there is at least twice as much downside remaining👇🏻
post-image
牛来-10.11%
【Price Trend Analysis】
1. K-line patterns:
* 4-hour chart: At 20:00 on September 04, a large bearish candle appeared on heavy volume, followed by two K-lines consolidating at low levels. The current K-line’s closing price is close to its low, indicating that bearish forces are dominant.
* Daily chart: A bearish candle with long upper and lower shadows formed on September 04. Its body was relatively large, with the closing price below the opening price and below the previous day’s close, indicating that bulls faced strong selling pressure after attempting to test the highs.
2. Technical ind
$FONE looks completely dead. Large traders L/S ratio is stil 0.5, but retail traders LS ratio growing and 1.64 for now.
Literaly every green candle in past two days is some big short position being closed.
Open interest slowly drops, meanwhile there was still almost zero long liquidations meaning lot of people still holding their losing long positions waiting for a miracle.
Well, I guess retail traders are just exit liquidity.
‍Better don't long $FONE untill you'll see at least few green candles in a row and increase in open interest. It can realy keep dropping to zero.
#FONE
post-image
FONE-35.93%
I was just about to go to the forum and start cursing, but then I looked at my balance and let it go—the market is always right. The order I placed before bed a few days ago was supposed to go to waste, but today $SKHYNIX gave me the answer directly—entered at 1235.91, now at 1275.1, with an unrealized gain of +224.58%. Feels great, brothers.

I didn’t use any fancy analysis this time; I simply looked at whether the buying support was strong enough. Before the market had fully started moving, every pullback held above the key level, showing that someone was supporting it from below. Since so
post-image
SKHYNIX+5.07%
ADA-4.40%
ETH-2.00%
This trend doesn’t even require me to think—the account is dancing on its own. When I checked the chart after lunch, the volume-price action was already off. The price rose without volume, with no one following in; every push upward fell just short. I’m most wary of this kind of bloated rally, so I decisively followed the rhythm.

From 1500.51 to 1729.57, with +1083.93% secured, those on board should be laughing themselves awake. I didn’t panic at all while others were rushing out, because the logic had long been laid bare: volume failed to keep up, the rebound lacked strength, and this kind
post-image
BTC-1.75%
XRP-3.31%
Load More

Join 40 M users in our growing community

⚡️ Join 40 M users in the crypto craze discussion

💬 Engage with your favorite top creators

👍 See what interests you

View More