Square
Following
Hot
News
Notifications
Profile
Share your thoughts
placeholder
Article
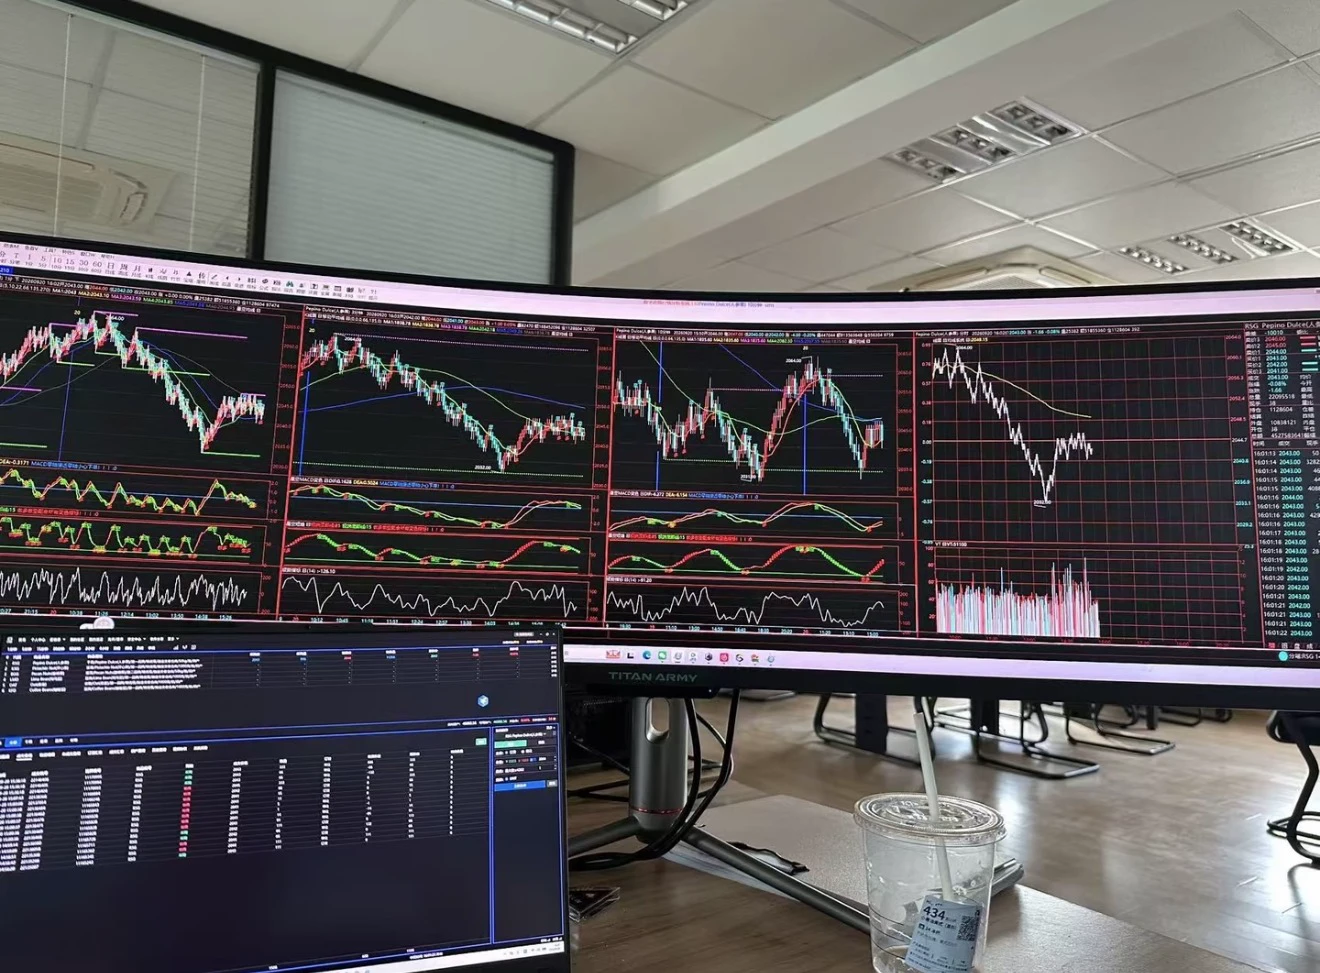
This chart is a trader with ADHD’s worst nightmare 💀
post-image
Longed $120k of oil
Let's see what we get
post-image
Trenches
ZIG
Z
bade
b
ZIG
0x8c...1145
Market Cap
$.
Change
.
24h Vol
$.
Holders
.
BTC
B
bade
b
BTC
C5xp...pump
Market Cap
$.
Change
.
24h Vol
$.
Holders
.
STONK
S
bade
b
STONK
6GmA...UNgx
Market Cap
$.
Change
.
24h Vol
$.
Holders
.
IDOL
I
bade
b
IDOL
0x3b...ab07
Market Cap
$.
Change
.
24h Vol
$.
Holders
.
scamsem
s
bade
b
scamsem
41Wp...pump
Market Cap
$.
Change
.
24h Vol
$.
Holders
.
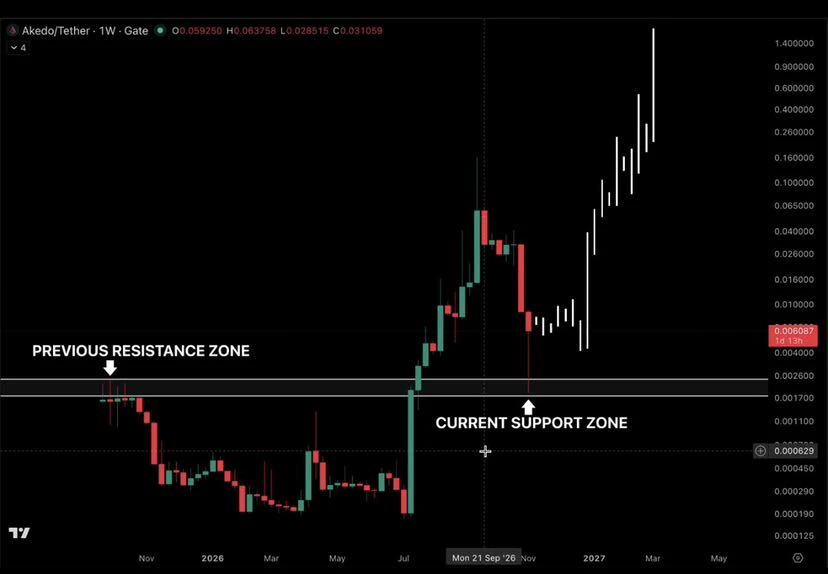
$AKE went from sitting in the basement to making a serious move

Now it's testing the same zone that previously capped its upside

This is where the chart gets interesting

Either the breakout gets validated, or the market reminds everyone that not every green candle deserves a victory lap

Waiting for some green candles here
post-image
AKE+6.07%
Sort all market action into four scenarios, and naked-candlestick trading becomes simple. The market may change in a thousand ways, but fundamentally it follows only four patterns. Once you recognize which one is playing out, the right move becomes automatic. Scenario 1: Breakout (the start of a trend) Characteristics: Price breaks through a key level on high volume, with a large-bodied candle closing beyond it. Approach: Don’t chase the first candle; wait for a retest that holds, then enter. Stop-loss: Just inside the breakout level. Trap: A breakout on low volume is probably false. Scenario
post-image
BTC-0.65%
$ONG /USDT BREAKDOWN CONFIRMED Sellers Pressing Lower

Pair: $ONG /USDT

Direction: SHORT

Entry: 0.0660500

Stop Loss: 0.0672038

Targets
TP1: 0.0651847
TP2: 0.0646078
TP3: 0.0637424

ONG rejected sharply from the ~0.070 local high and has since broken below MA7 (0.06626), MA25 (0.06715) and MA99 (0.06802) a full bearish MA stack. Price just pushed to a fresh short-term low, confirming continuation of the downtrend after the earlier breakdown.

$ONG ‌
ONG+0.08%
OpenAI CFO: Data center investments will not change due to the midterm elections.
live-cover
LIVE17
“He Was Liquidated Three Times; the Third Time, He Mortgaged His House”
Lao Li is 47 and used to be a factory supervisor.
He was liquidated three times; the last time, he put his house up as collateral.
He is still trading, and his account has been stable for six years.
I asked him how he survived.
He said: “It’s not that I got better; I finally admitted that I can be wrong.”
His four rules now are dead simple, but he hasn’t blown up in six years
1. Lose only 1% of your total capital per trade—not 2%, not 5%, but 1%.
With a 120,000 U account, the most he can lose on one trade is 1,200 U.
Once
post-image
BTC-0.65%
ETH-1.23%
Berkshire Hathaway reported third-quarter operating earnings of $12.705 billion (down 5.8% year-over-year) while accelerating its share repurchases to a record $9.6 billion under CEO Greg Abel.
‍#ShareWeekly #USAIStocksHitHard
post-image
BRKB-0.20%
I just saw a liquidation record that made me even more confident in my bearish view on $TRUMP
: a trader’s $2.68 million short position was liquidated outright. More importantly, he had already taken a hit on Bitcoin before. After two consecutive blowups, he still dared to put such a heavy short position on a small-cap contract with only $30 million in open interest. This was simply a lack of risk management, and it’s no surprise he got stopped out. The short liquidation shows that the price did surge upward at one point, but the rally did not reverse the overall direction.
The current price i
post-image
TRUMP-0.90%
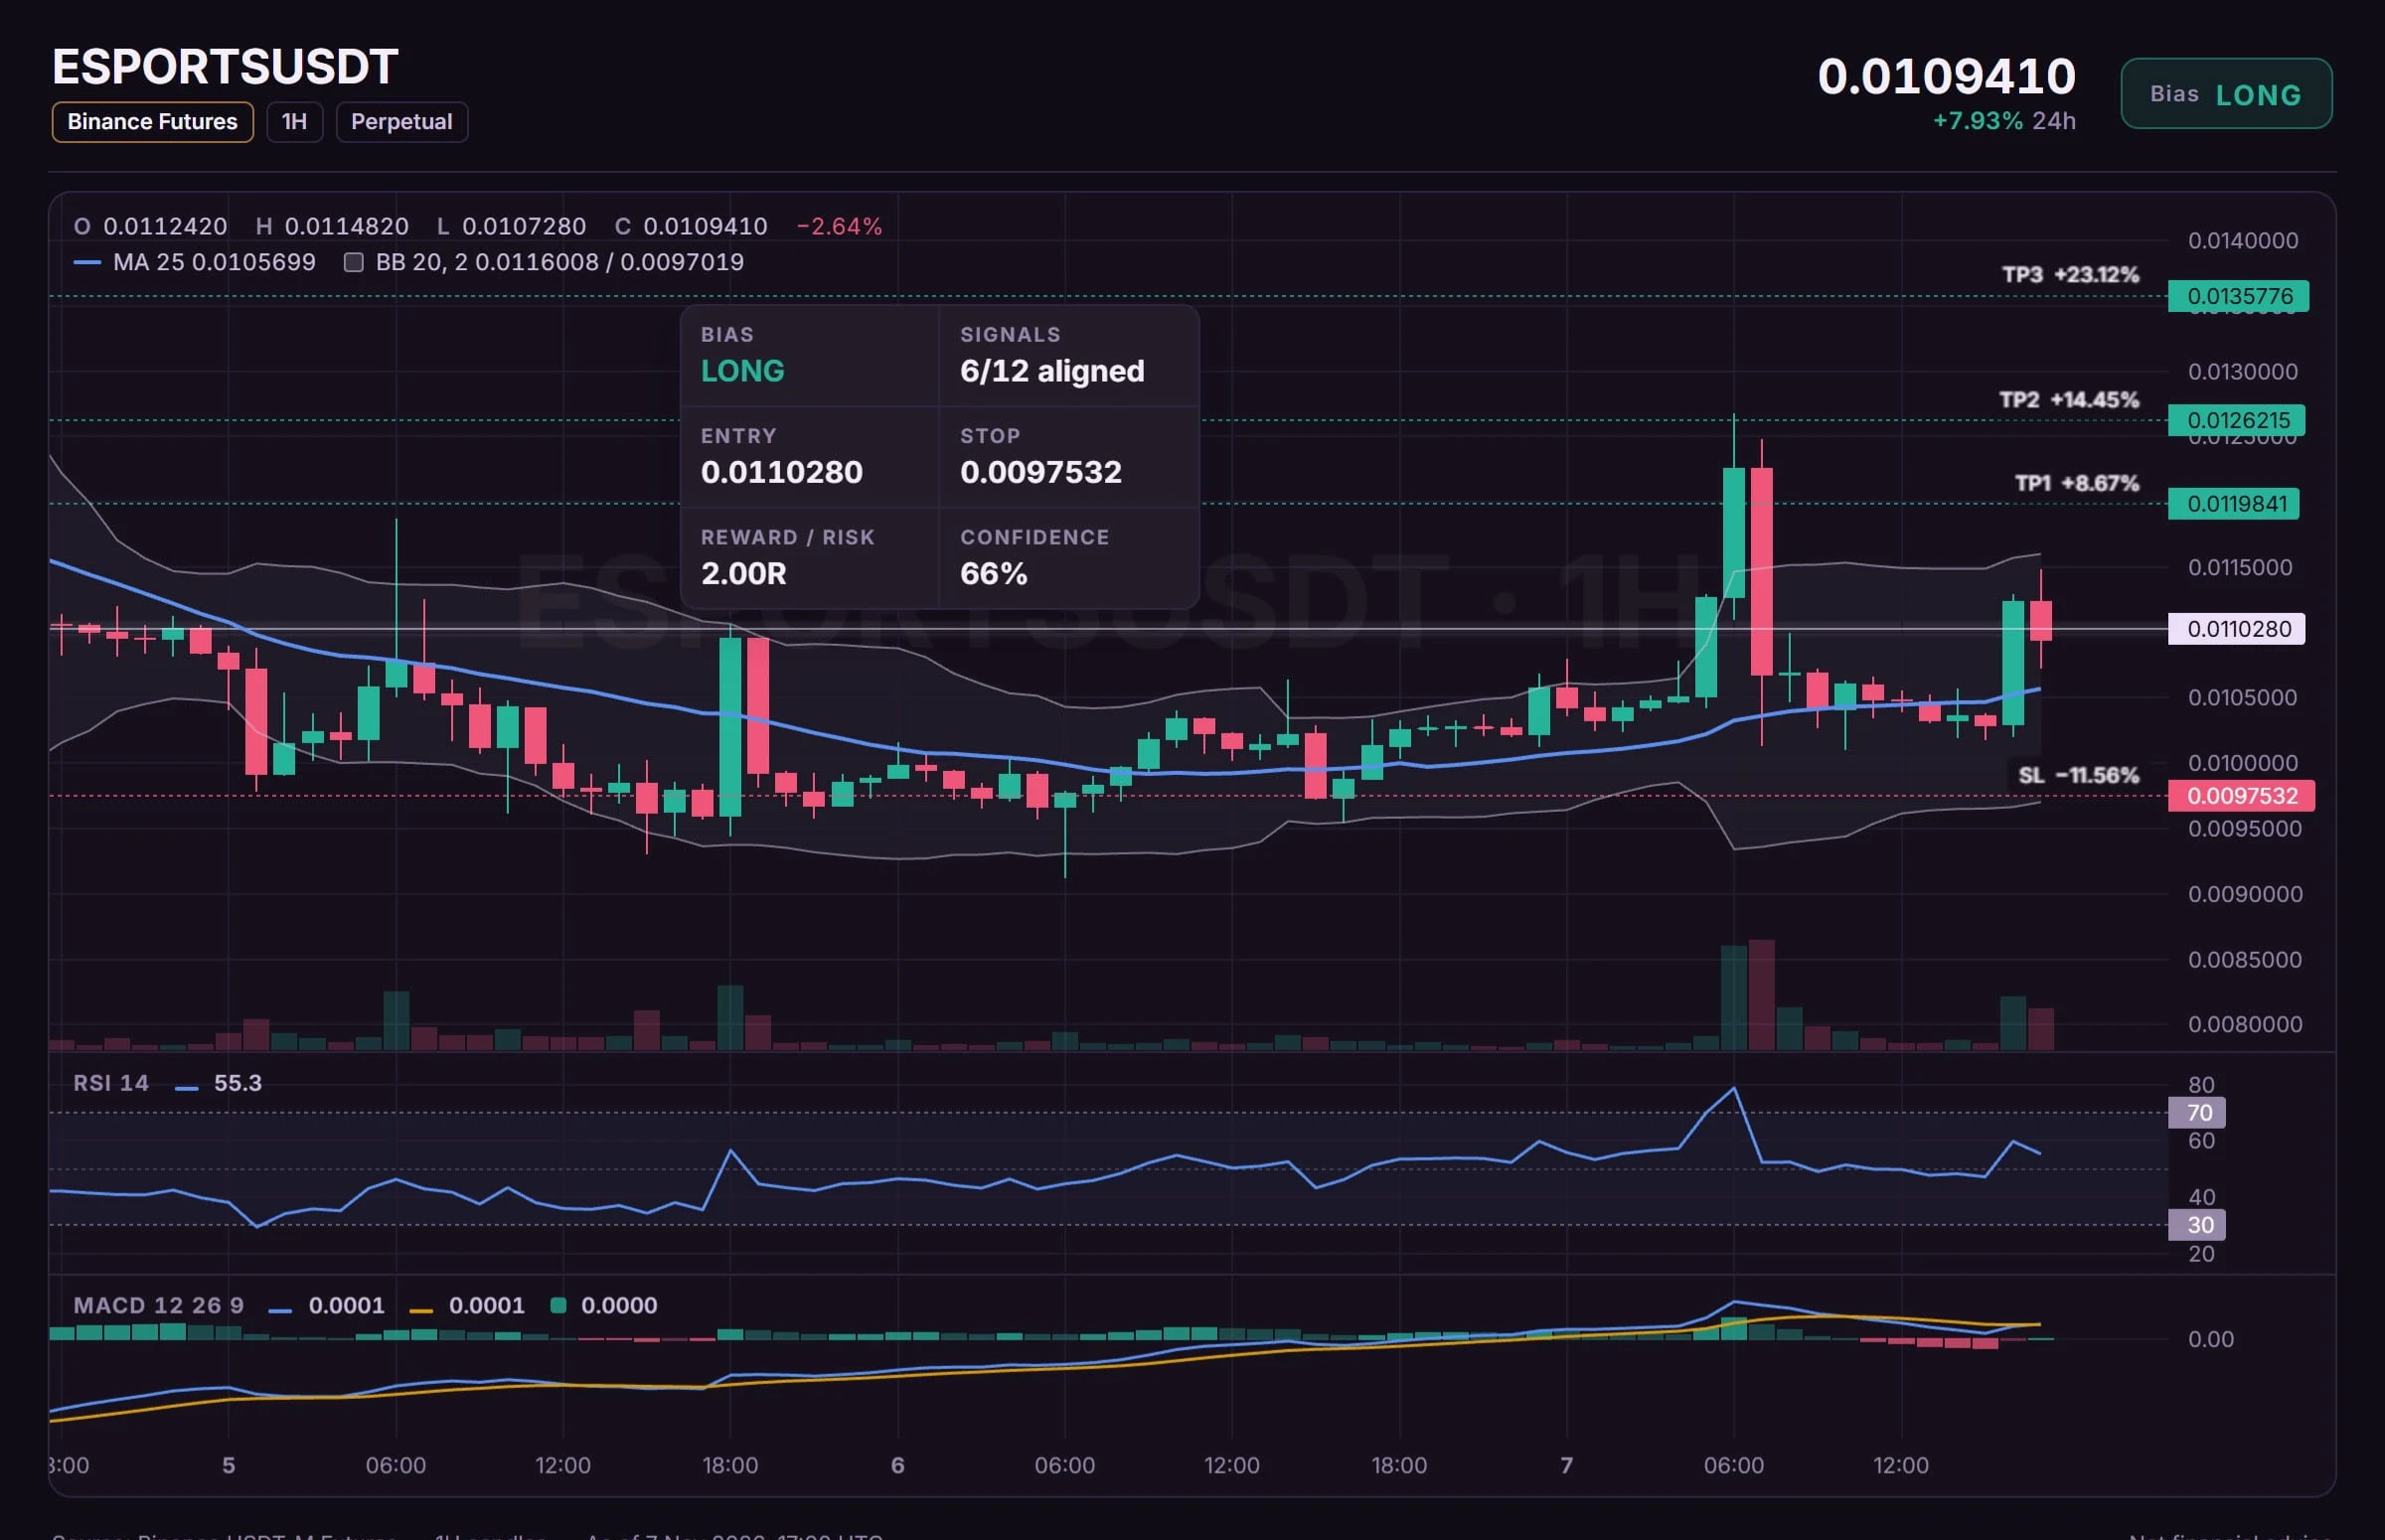
BULLS ARE TAKING OVER $ESPORTS USDT Long Setup is Live

$ESPORTS /USDT

Direction: LONG

Entry Zone: 0.0110280

Take-Profit Targets
🔹 TP1: 0.0119841
🔹 TP2: 0.0126215
🔹 TP3: 0.0135776

🛑 Stop-Loss: 0.0097532

$ESPORTS ‌
post-image
ESPORTS-4.77%
ZEC price is consolidating between the 1400 and 1100 levels. Scalping for bounces off support and resistance is also a good opportunity.
#SquareTradingExpert
#WCTCS9
$ZEC ‌
post-image
ZEC
LONG
SHORT
WAIT
5 Participants
Ends In 1 Day
ZEC+1.29%
  • 1
The right way to read naked candlesticks: from big to small, from stillness to movement.

Step one: Set the “map” first; don’t rush to look at candlestick patterns. Open the weekly chart and ask just one question: Are we at the mountaintop, halfway up, or in the valley? Sideways after a continuous decline → valley; look for long signals. Accelerating after a continuous rise → mountaintop; look only for short signals or stay out. In the middle → blank map; not trading is the best trade.

Step two: Find the “battlefield” on the daily chart. Draw two lines between a clear high and low (support/re
post-image
BTC-0.65%
crypto market update 🥰
live-cover
LIVE19
A bull market never starts with a cannon blast; it unfolds in “five progressive steps”
1. It falls until no one dares mention it (bottom signals)
Trading volume shrinks to extreme lows, communities go silent, KOLs collectively switch careers, and mainstream media declare “crypto is dead.” The price stops making new lows, but every rebound is dismissed as a “dead-cat bounce.” This is the easiest step to miss, because nobody wants to buy then.
2. BTC moves first, and moves “irrationally”
The first shot of a bull market is always fired by Bitcoin. The signs: rising on low volume, shallow pullback
post-image
BTC-0.65%
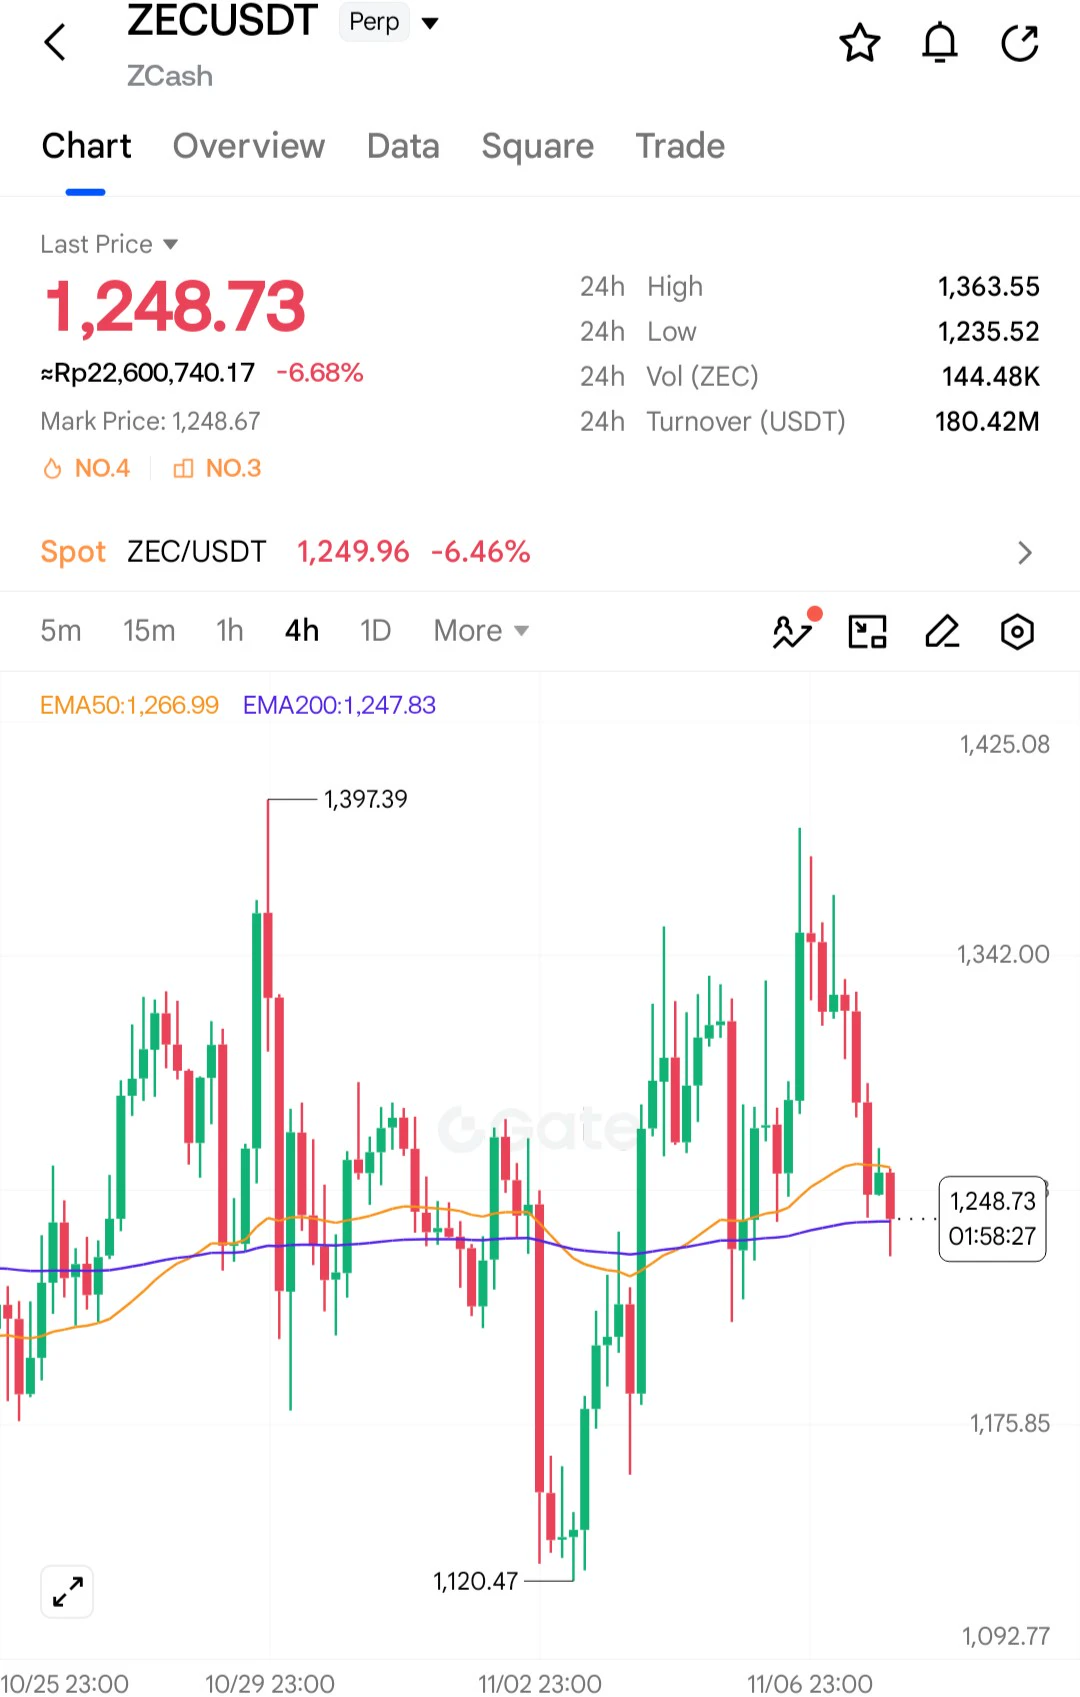
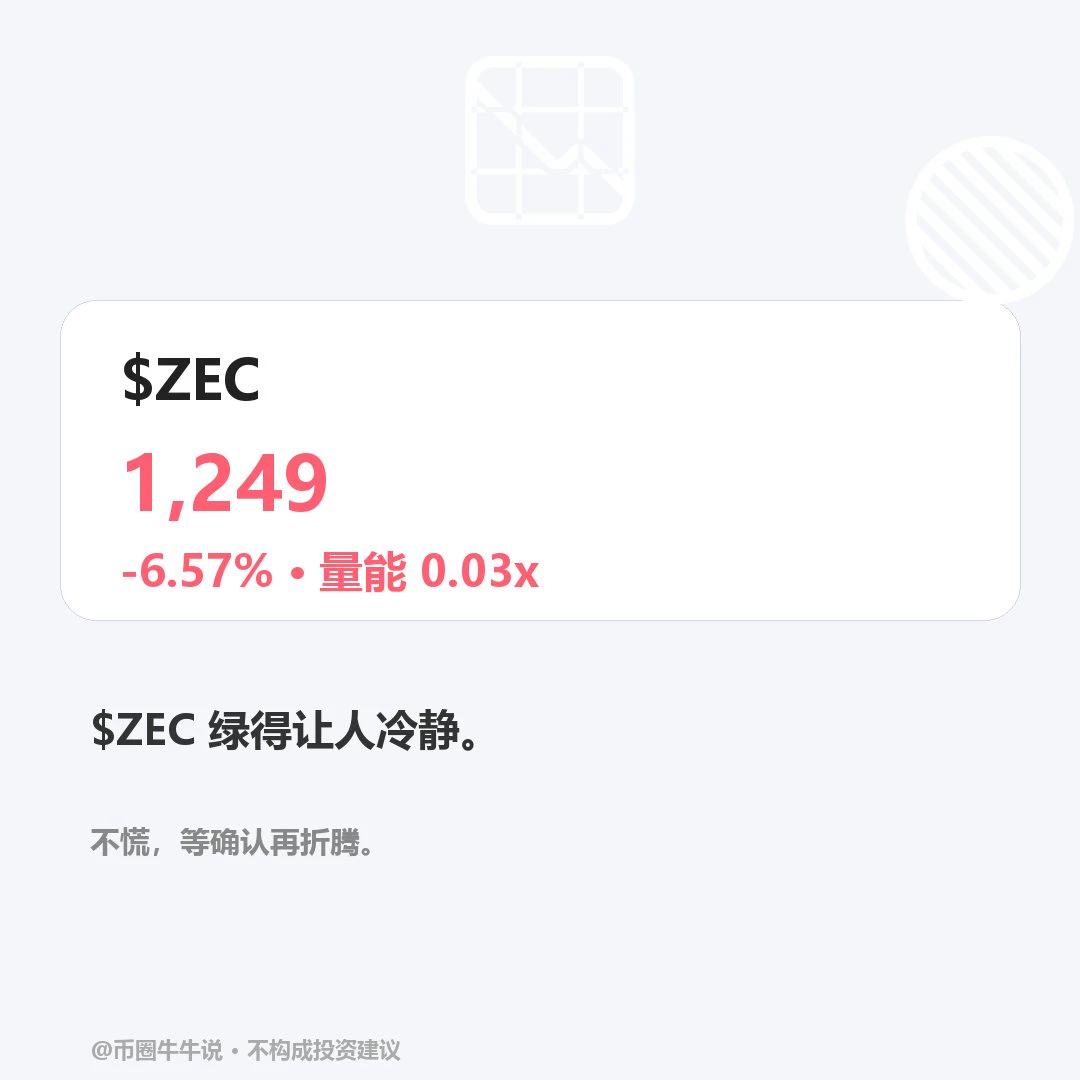
$ZEC Currently at 1248.69, 24H -6.57% (range 1236.65–1364.08). The 1H trend is weak, with RSI14.07 in oversold territory; price is below EMA20 at 1279.88, and the volume ratio is 0.03. The 4H trend is weak, with RSI51.89; price is below EMA20 at 1283.09. Watch for a sustained move above the 1364.08 resistance; a break below the 1236.65 support would weaken the structure. For review, check whether price holds above 1364.08 and reclaims 1236.65; volume is only 0.03x. A low-volume hold or a breakdown that is not reclaimed would invalidate the setup. Markets are volatile; for observation only.
post-image
ZEC+1.16%
State Street, which manages more than $6.3 trillion, has grown its tokenized liquidity fund SWEEP 79.26% in the past 30 days to $284.13M.
More than $75.07M of it now sits on Stellar, where the fund held nothing 30 days ago.
@StateStreet @StellarOrg
XLM-0.64%
☀️ Good morning this Sunday.
​
The morning light is just right, and everything is lovely.
​
No rat race talk today—let’s just enjoy life. Give this a like and kick off an energetic day!✨
post-image
Load More

Join 40 M users in our growing community

⚡️ Join 40 M users in the crypto craze discussion

💬 Engage with your favorite top creators

👍 See what interests you

Trending Topics

USAIStocksHitHard

21.44k Views3.68k Discussing

U.S. stocks sold off sharply on Thursday, November 5 (UTC). The Nasdaq closed down around 5.5%, entering correction territory, while the Philadelphia Semiconductor Index plunged roughly 12%, with chip stocks including $NVDA and $AMD posting steep losses. Beyond profit-taking, investors are growing concerned about the pace of AI data center construction, capital spending, and future returns on investment. The key question now is whether the AI sector’s lofty growth expectations need to be repriced. Where do you think the next opportunities will emerge: chip stocks, tech giants, or other sectors?

USNonfarmPayrolls

35.66k Views4.35k Discussing

StakeOnLaunchpoolToShare450KVLX

10.5k Views831 Discussing

View More