


Square
Following
Hot
News
Notifications
Profile
Share your thoughts
placeholder
Article
Why do some traders review their trades every day and continue trading for a long time, yet never improve their performance?

They record every trade, study every loss, and even keep adjusting their strategy parameters.

But months later, the same problems remain: losses keep recurring, trading rules are repeatedly changed, historical backtests look increasingly impressive, yet live trading shows no clear improvement.

The problem may not be a lack of effort in reviewing trades, but a flawed review process.

1. Remembering winning trades while overlooking the details of failures

People easily
post-image
$XAU Keep shorting gold! Short it whenever it bounces! It’s unlikely to rise much further on the higher timeframes! Target: 4090. If you’re not in a position, short at market! Wait patiently for the waterfall!
post-image
XAU+0.38%
Trenches
ZIG
Z
bade
b
ZIG
0x8c...1145
Market Cap
$.
Change
.
24h Vol
$.
Holders
.
BTC
B
bade
b
BTC
C5xp...pump
Market Cap
$.
Change
.
24h Vol
$.
Holders
.
STONK
S
bade
b
STONK
6GmA...UNgx
Market Cap
$.
Change
.
24h Vol
$.
Holders
.
ANSEM
A
bade
b
ANSEM
9cRC...pump
Market Cap
$.
Change
.
24h Vol
$.
Holders
.
牛逼
牛
bade
b
牛逼
0x96...7777
Market Cap
$.
Change
.
24h Vol
$.
Holders
.
morning market update xrp
live-cover
LIVE2,291
How can you tell whether a trading strategy has a genuine statistical edge rather than making money through luck?

In trading markets, one of the easiest mistakes to make is treating profits as evidence that a strategy works.

A string of profitable trades could mean the strategy has an edge, or it could simply mean the market happened to be favorable to it.

So how can you tell the difference?

The key is not to look at how much a few trades made, but to determine whether the strategy has a repeatable positive expected return after costs under sufficiently reasonable testing conditions.

I. F
post-image
$XRP Large long position now, sell later at $1.4370; long entry at 1.1218 $XRP 👇
post-image
XRP-1.15%
  • 2
Why isn’t a trading strategy with a higher win rate necessarily more profitable than one with a lower win rate?

Many traders have an intuition: the higher the win rate, the stronger the trading ability, and the more money they should make.

But in real trading, this judgment is often wrong.

Some strategies win seven out of ten trades, yet the account keeps shrinking; others win only three or four out of ten, but may perform better over the long term.

Why?

Because long-term trading performance is determined not only by the win rate, but also by average profit, average loss, trading costs, a
post-image
$ETH
ETH Market Analysis:
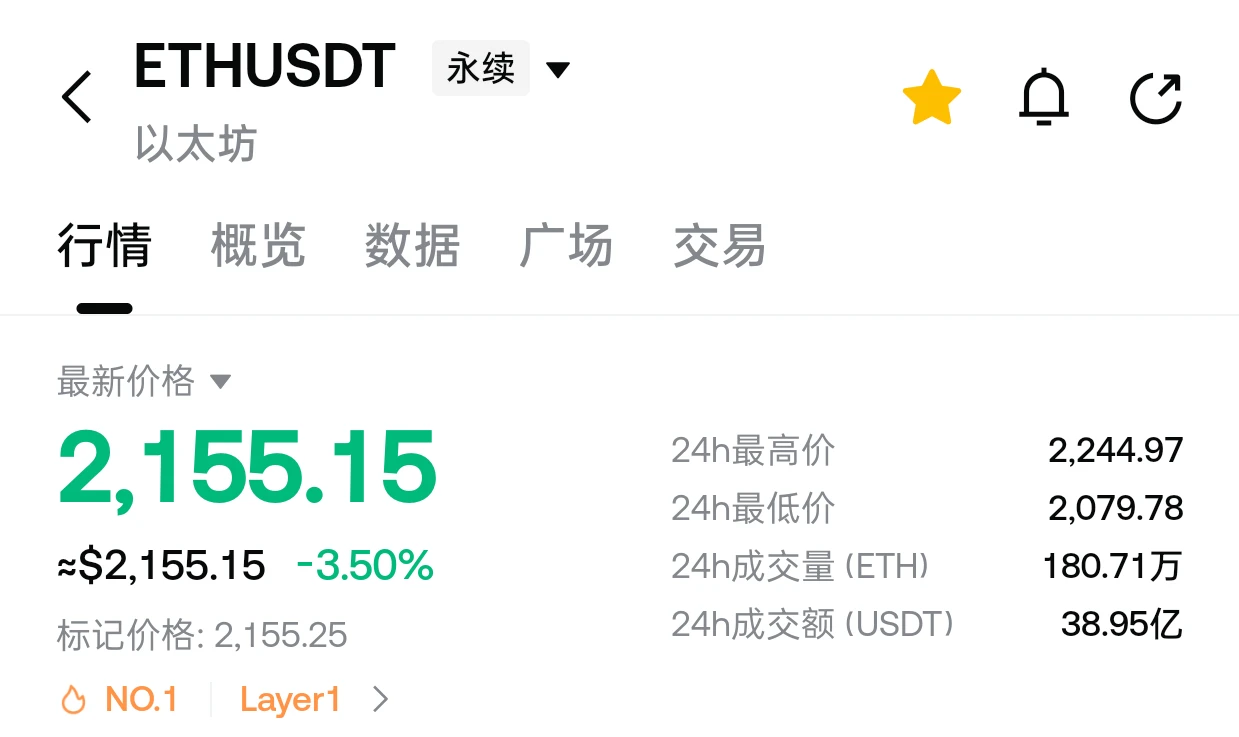
The lower time frame is following the downtrend, but the rebound has not been as strong as BTC’s. Next, watch how strong the rebound is and keep an eye on the key support zone below!
The key support zone below is 1960-2000. If the price reaches this zone, it could be a good area to gradually enter and buy the dip!
post-image
ETH-1.26%
BTC-0.67%
☀️ GM! A new week begins—what’s in store for the markets? 🎬
Last week, nonfarm payrolls came in above expectations, and the Nasdaq rebounded on Friday, though it remained under pressure for the week. BTC briefly fell below $75K, and CPI is due tomorrow night. 👀

📌 Today’s featured topic: What do you think the market will do next?
₿ BTC: Stabilize and rebound, or keep looking for support?
💻 AI tech stocks: Can Friday’s rebound continue?
📊 US CPI: What impact will the new data have on the markets?

🎁 Share your market outlook and trading strategies on Gate Square. Post to earn red envelope
post-image
NAS100-0.07%
BTC-0.67%
  • 28
  • 3
🔹AI Stocks Plunge, but Tech Giants Say Demand Hasn’t Disappeared! Is This AI Sell-Off an Overreacti
live-cover
LIVE1,283
Why Is the Liquidation Price Different from the Market Price You See?

You open your trading app and see that BTC’s latest traded price has not yet fallen to your liquidation price.

But your account’s risk warning has already changed, or your position has even been forcibly liquidated.

Why does this happen?

One important reason is that in contract trading, the market price you see, the price the platform uses to assess liquidation risk, and the price used as a reference for the broader market may not be the same.

Understanding the differences between the latest traded price, mark price, an
post-image
BTC-0.65%
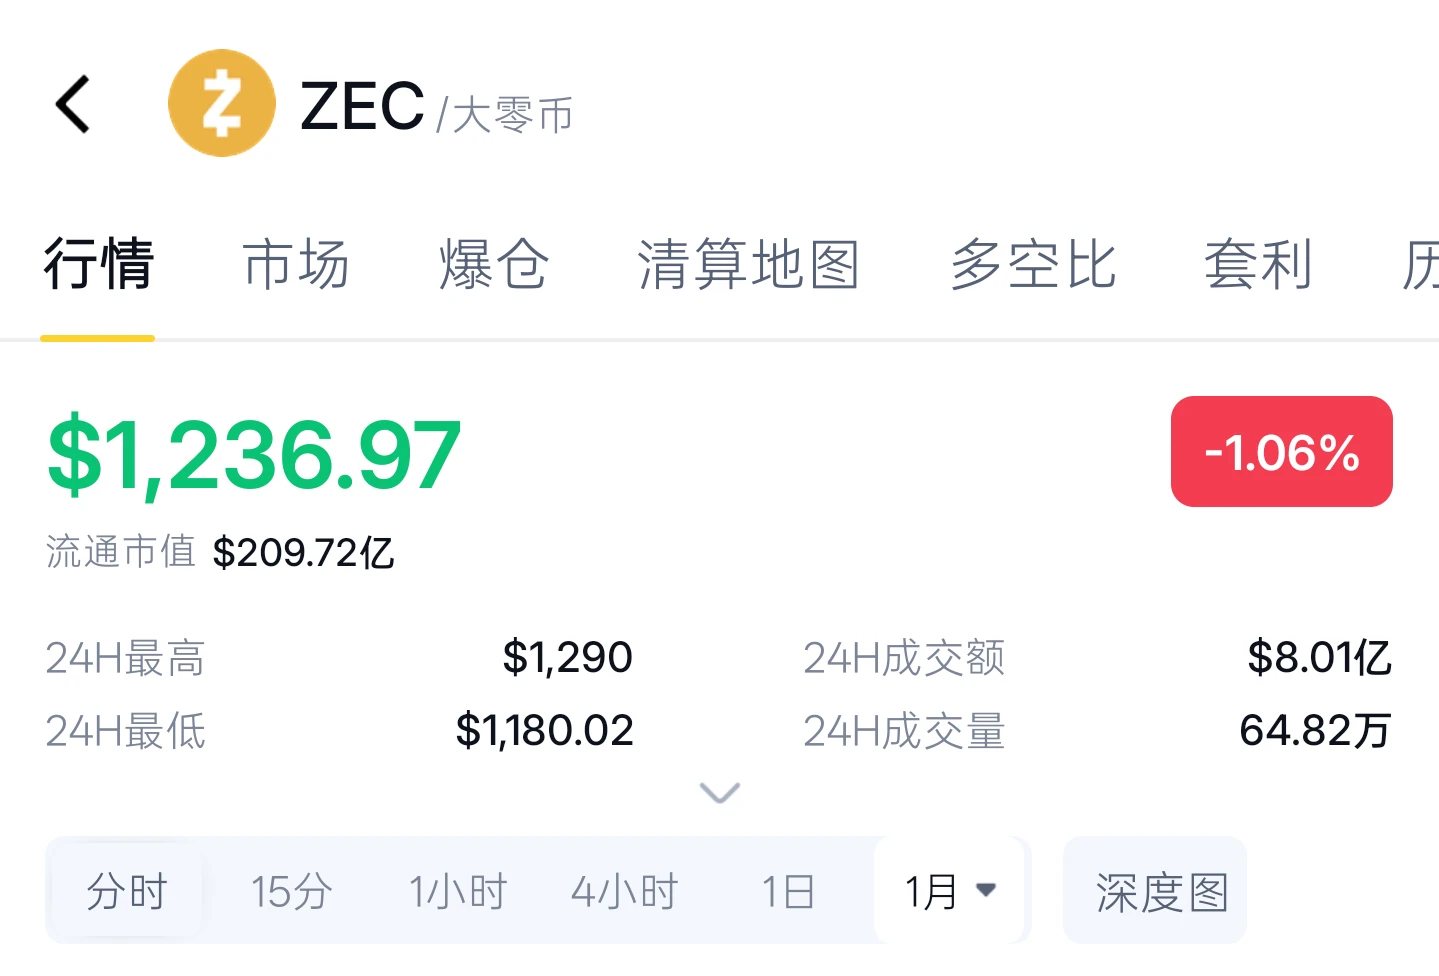
Zcash broadly weakened alongside the crypto market today but showed relative resilience: its 24-hour range was 1,190–1,287. After dipping to around 1,190 in the morning, it found support and rebounded, and is currently trading near 1235. Its 24-hour decline was only about 1.6%, noticeably smaller than Ethereum’s and roughly on par with Bitcoin’s; it has recovered more than 2% in the past hour, showing greater resilience than major coins.

Structurally, after retreating from a high of 1310, ZEC’s 1,190–1,200 support zone held up under pressure. This is exactly the “1200–1180 after 1240 gives wa
post-image
ZEC+1.16%
ETH-1.26%
BTC-0.67%
🤯 Former FBI agent stole $2.47M in crypto from the FBI’s own database!
Patrick Yaroch pleaded guilty to wire fraud and money laundering.
↳ 79 wallets, 35 investigations, 100 transfers
↳ At least 10 wallets belonged to crime victims
↳ $2.4M+ in restitution, 1.38M SUI forfeited
↳ Sentencing: March 4, 2027, up to 20 years in prison for each count
The person who was supposed to catch crypto criminals ended up stealing crypto himself.
post-image
SUI-1.05%
11.9 Market Overview Analysis

ETH Strategy Reference Setup
Rebound range: go long around 2130--2140
Stop loss: 2100
First target: 2180, second target: 2230

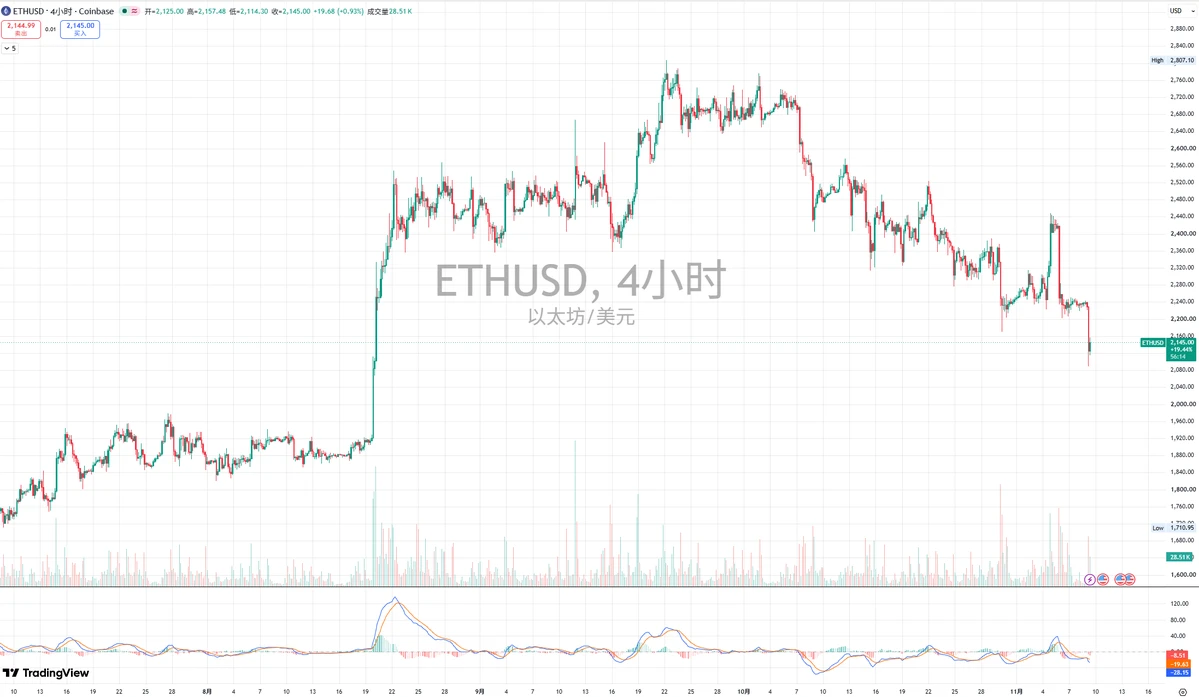
This is a short-term ETH candlestick chart. After a rapid, sharp drop to a low of 2050.32, small candles appeared and the price stabilized and began recovering. MACD bearish momentum is gradually contracting, forming an oversold rebound structure after the sharp decline. The current price is 2143.71, in the bottoming consolidation and recovery phase after the decline, with bulls betting on an oversold rebound.#BTC闪崩插针 #70%山寨币跌破200日均线 #Gat
post-image
BTC-0.65%
ETH-1.23%
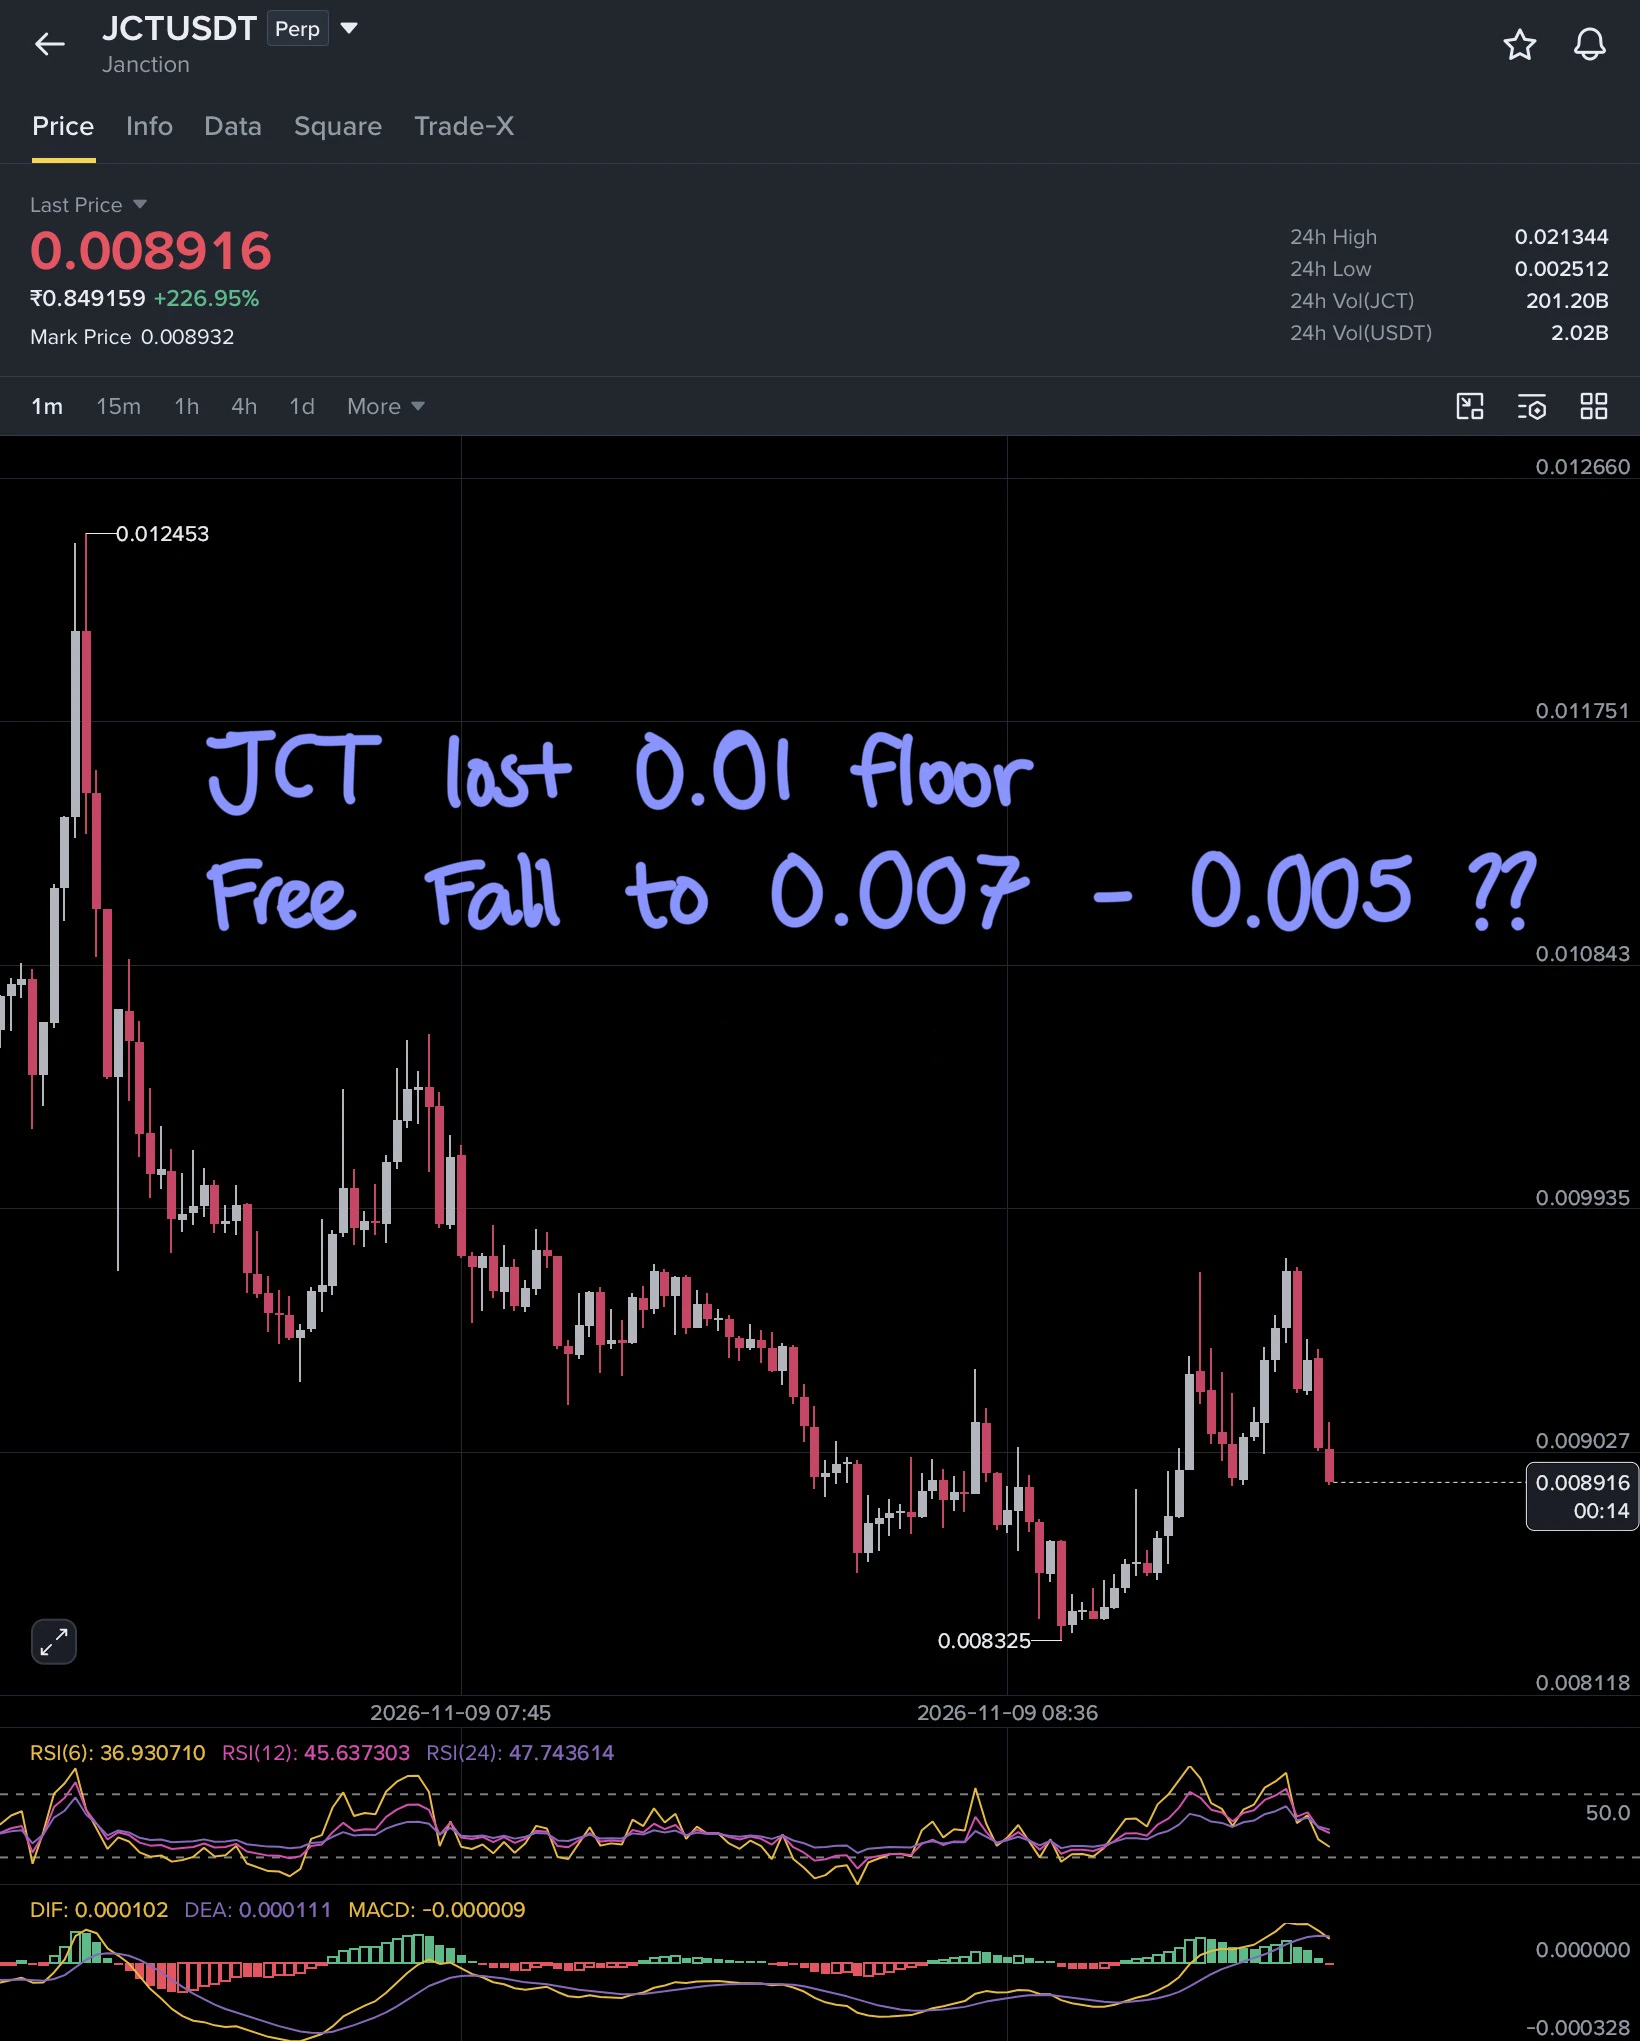
$JCT JUST LOST 0.01 , loosing 0.008325 will leads heavy sell pressure.

Price coming into Ground after Sharp Rally 🔻
post-image
CryptoSat
Good Morning Everyone, $JCT Trading signal for you . Have a Safe Ride 🥰
JCT-3.26%
🏆 #GateSquareContentMining | Top 20 Quality Content Engagement Rewards Revealed
The Top 20 Outstanding Creators leaderboard for October 26 – November 1 is now officially announced. Congratulations to all the creators who made the list!

💰 Post Quality Content to Earn Extra USDT Rewards
Publish high-quality original content, share valuable market insights, and actively engage with the community for a chance to receive extra USDT rewards from the platform.

🚀 Join Gate Square and Make Every Piece of Quality Content Valuable

📝 Post Now: https://www.gate.com/post
📋 Event Details: https://www
post-image
  • 3
🔥 Get a first look at this week's market opportunities!
Gate Live hosts daily live trading sessions, sharing trading insights and helping you track market movements in real time!

📈 How can you gauge the market direction?
🚀 Which sectors are gaining momentum?
👀 Which key signals are worth watching?

Tune in to Gate Live and find the answers in the livestream 👉 https://www.gate.com/live
GateLiveChinese
🔥 Get a first look at this week's market opportunities!
Gate Live hosts daily live trading sessions, sharing trading insights and helping you track market movements in real time!

📈 How can you gauge the market direction?
🚀 Which sectors are gaining momentum?
👀 Which key signals are worth watching?

Tune in to Gate Live and find the answers in the livestream 👉 https://www.gate.com/live
repost-content-media
How do you choose the right trading timeframe for BTC?
In BTC trading, many people switch back and forth between different timeframes every day. One moment they’re looking at 15-minute candlesticks for short-term opportunities; the next, they’re opening the 4-hour chart to gauge the swing trend. When they see a pullback on the daily chart, they start questioning their trading direction.
In fact, different trading timeframes represent different trading logic. Choosing a timeframe that suits you is more important than blindly chasing more trading opportunities.
First, long-term trading mainly fo
post-image
BTC-0.67%
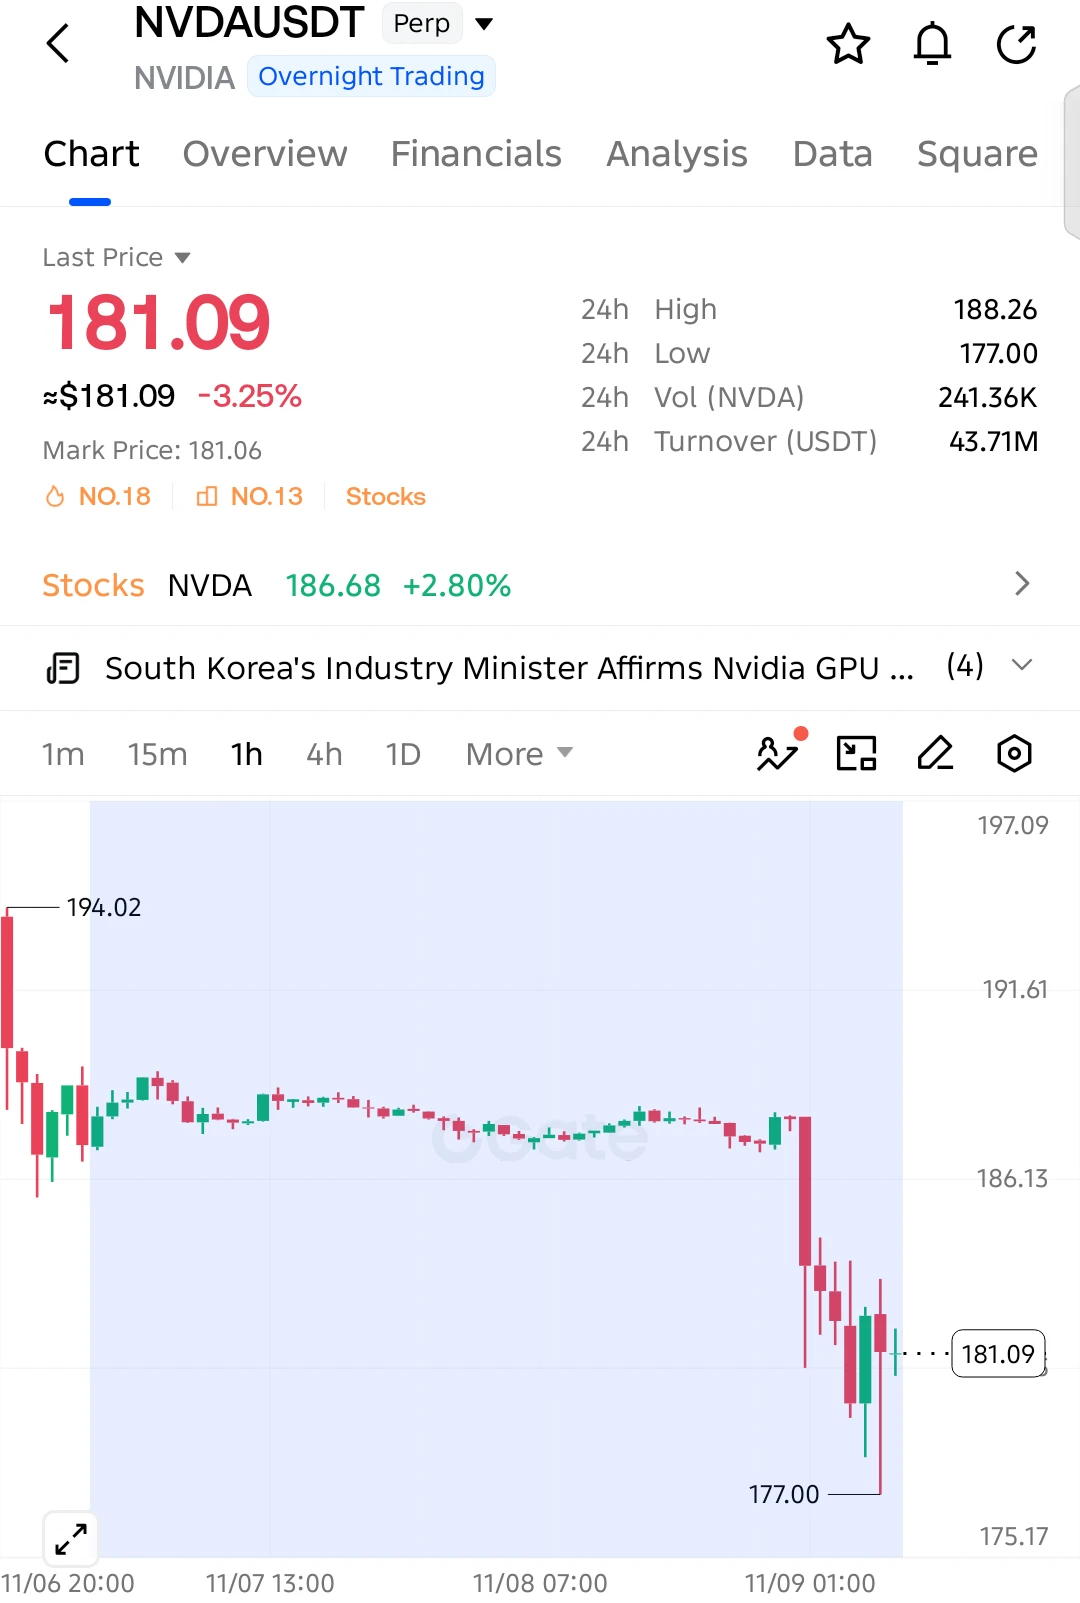
$NVDA SHORT SETUP — SELLERS TAKING CONTROL!

$NVDA is down 3.25% after a sharp breakdown from the 187 area. Buyers are struggling to recover, and another downside move could be developing!

Entry: 181.09
SL: 184.50

TP1: 177.00
TP2: 175.20
TP3: 172.50
Final Target: 170.00

Selling pressure remains strong as $NVDA trades below its previous support. The latest bounce from 177.00 shows some buying interest, but sellers still have the advantage below 184.50. A fresh breakdown below 177.00 could extend the decline toward 172.50 and potentially lower.

Invalidation: A sustained recovery above 184.50
post-image
NVDA-0.35%
$JCT This vertical pump is nearing its end, everyone.
Let’s look at the chart—if you still haven’t caught on, the best short opportunity of the week is about to slip right through your fingers. JCT just printed an almost absurd +320% vertical spike, surging straight to $0.020. It looks like a dream, but for those chasing the rally, the chart is already screaming a warning. That huge red rejection candle is right there: price tried to push higher, got slammed straight back down, and is now bleeding lower.
When a coin surges 300% in a single day, smart money doesn’t buy at this level; they’re d
post-image
JCT-3.26%
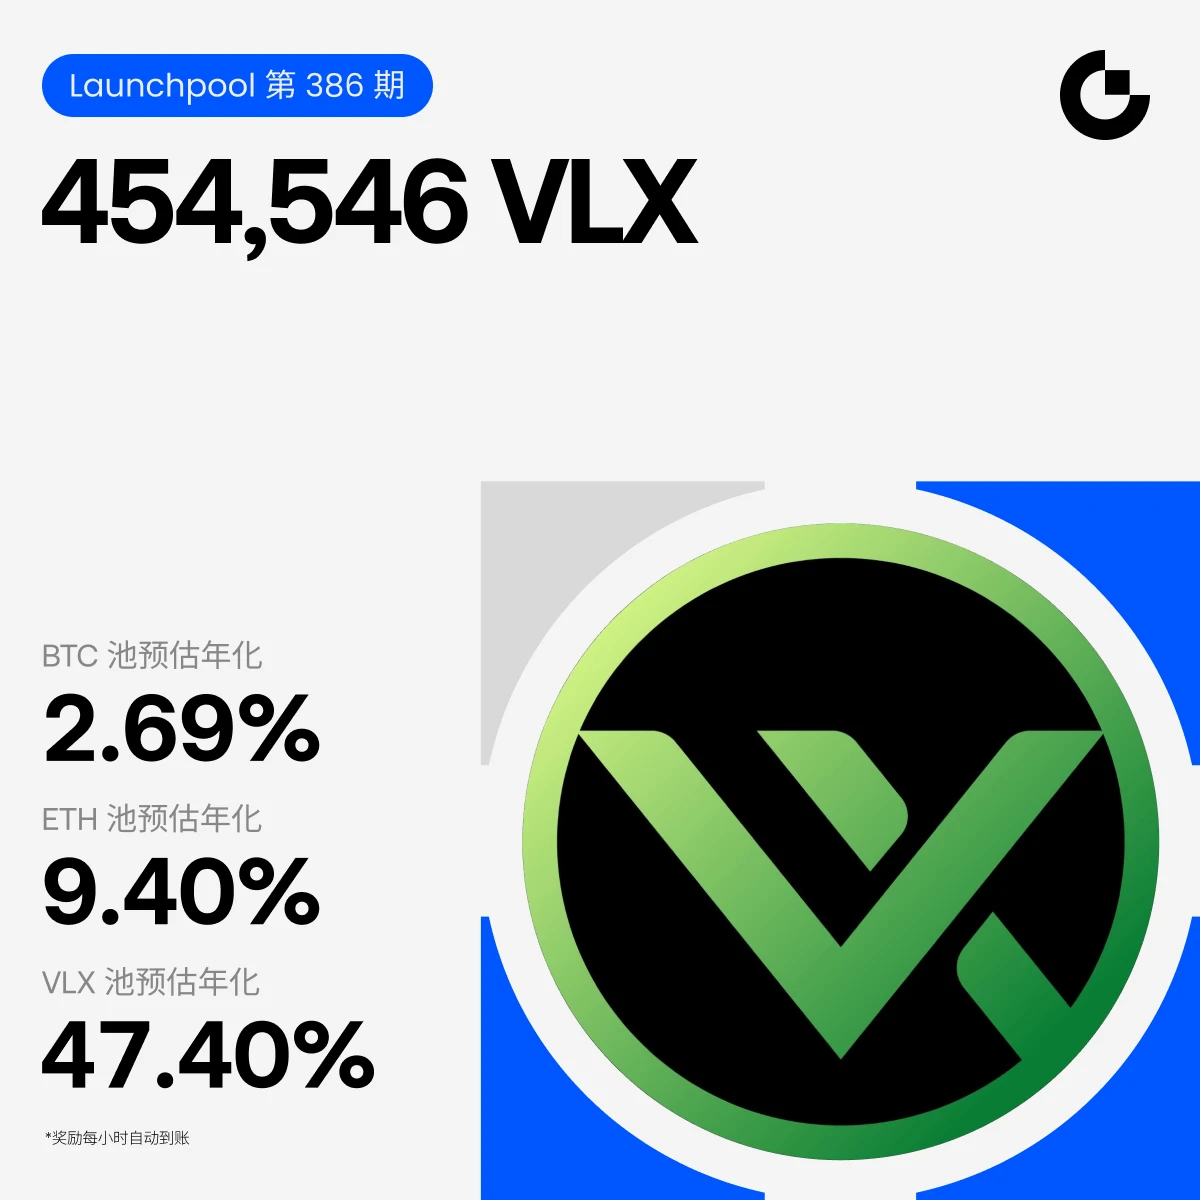
Gate Launchpool Round 386: Stake $BTC $ETH $VLX to earn 454,546 $VLX

🔹 Estimated annualized yield of up to 47.40%
🔹 Earnings are automatically credited every hour
🔹 New feature upgrade: Staking limits for $BTC and $ETH dynamically unlock at a 1:1 ratio based on net deposits; higher limits unlock with more net deposits
🔹 Supports staking in advance: Start earning as soon as the event opens

📅 November 7, 19:00 - November 21, 19:00 (UTC+8)​

Stake now: https://www.gate.com/launchpool/VLX?pid=557
More details: https://www.gate.com/announcements/article/102656
post-image
BTC-0.67%
ETH-1.26%
VLX+0.00%
  • 4
Load More

Join 40 M users in our growing community

⚡️ Join 40 M users in the crypto craze discussion

💬 Engage with your favorite top creators

👍 See what interests you

Trending Topics

USCPIDataIncoming

22.8k Views1.73k Discussing

The U.S. October CPI report will be released on November 10 at 8:30 a.m. ET. September CPI came in at 3.7% year over year, and markets will be watching closely for signs that inflation is cooling, especially in core CPI. A softer-than-expected reading could strengthen rate-cut expectations, while hotter inflation may pressure risk assets through higher Treasury yields and a stronger dollar. How do you think this CPI print will move $BTC, U.S. stocks and gold?

RedBullDoublePodiumInBrazil

309.58k Views30.5k Discussing

BTCFlashCrash

22.73k Views66.06k Discussing

View More