
Square
Following
Hot
News
Notifications
Profile
Share your thoughts
placeholder
Article
5-minute predictions are no game; it's gambling😇. At this point, the people I owe the biggest apology to are my family$BTC
post-image
Crypto
What price will Bitcoin hit in 2026?
↓ 55,000
54%1.85x
↓ 50,000
28%3.51x
$442.28K 24H+44 more
BTC-0.65%
#PCEAndGDPDataNextWeek
📊 #PCEAndGDPDataNextWeek

Next week could be very important for the financial markets as investors prepare for the latest US PCE inflation and GDP data.

These reports may bring strong movement in Bitcoin, gold, stocks, and the US dollar.

If inflation comes lower than expected, the market may become more positive because investors could expect easier monetary policy.

However, stronger inflation or GDP numbers may increase uncertainty and create selling pressure in risk assets.

For Bitcoin traders, it is important to watch market reactions, key support and resistance
BTC-0.67%
XAU+0.38%
Trenches
PIEVERSE
P
bade
b
PIEVERSE
0x0e...25a9
Market Cap
$
Change
.
24h Vol
$.
Holders
.
IDOL
I
bade
b
IDOL
0x3b...ab07
Market Cap
$.
Change
.
24h Vol
$.
Holders
.
JAGENT
J
bade
b
JAGENT
0x8e...ae15
Market Cap
$.
Change
.
24h Vol
$.
Holders
.
Singularity
S
bade
b
Singularity
7R4M...pump
Market Cap
$.
Change
.
24h Vol
$.
Holders
.
mihao
m
bade
b
mihao
4Cxj...pump
Market Cap
$.
Change
.
24h Vol
$.
Holders
.
$XRP Downside alert... Is 0.87227 the next target? XRP was rejected near the 0.93860 resistance level, and the second red candle has also confirmed the downward trend. Volume is about 2.3 times the recent average. As long as XRP stays below 0.93860, the short-term bearish outlook remains intact. A move back above 0.93860 would weaken this setup. The bears are gaining momentum. Can they extend this decline? Sell and trade $XRP
$BULLA $ELSA
post-image
XRP-1.15%
BULLA+10.92%
ELSA+5.80%
#GoldNears3500 #XAU #WCTCS9
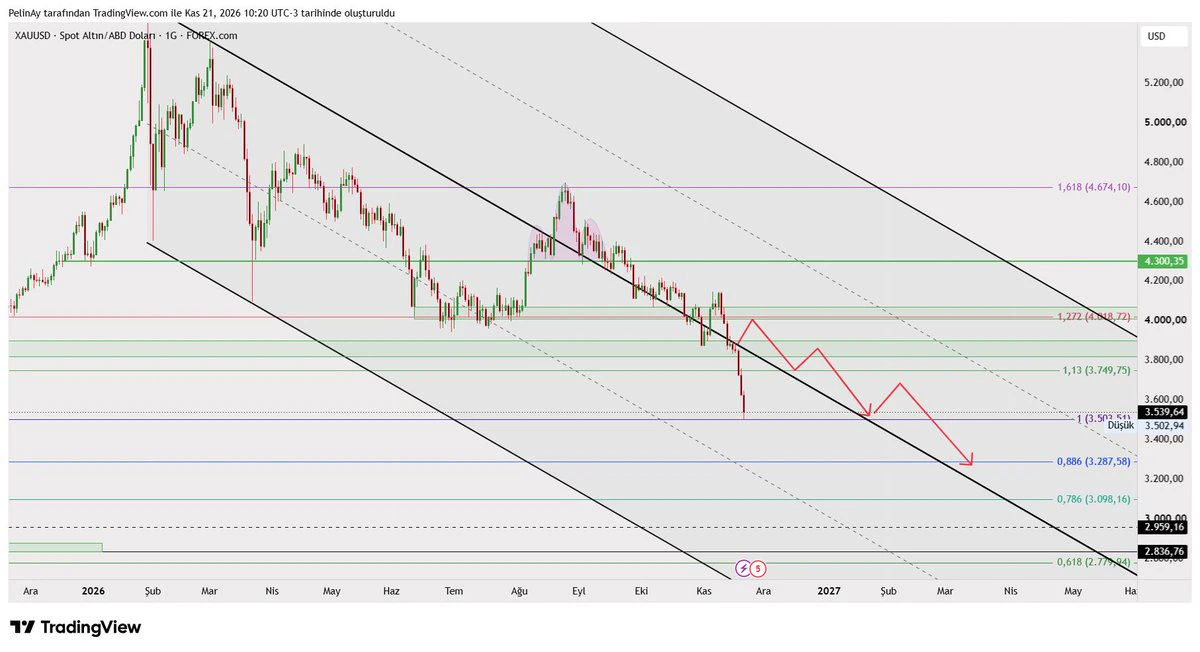
Gold currently trades in the region of 3,520 to 3,540 dollars per ounce following a sharp multi-session decline that carried prices to the lowest levels since September 2025, with an intraday trough near 3,502 to 3,514 dollars. This represents a weekly loss of approximately 8.7 to 9.4 percent, marking the steepest weekly drop since March and extending a broader correction that has erased roughly 30 to 37 percent from the peaks recorded earlier in 2026 near 5,500 to 5,589 dollars. Over the past month the metal has declined around 12 to 14 percent, while year-to-date
XAU+0.38%
XAG+0.47%
ANT-8.68%
#GoldNears3500
Gold’s Safe-Haven Role in a Cross-Asset Selloff

Gold’s simultaneous drop alongside equities—falling roughly 9.4% on the week to touch $3,502.49 on November 20 (down more than 35% from its January 2026 record peak near $5,405)—does not mean its safe-haven status is permanently broken, though it does highlight which risks gold actually hedges.

Inflation & Rate-Hike Regimes vs. Growth Shocks: Gold is a hedge against currency debasement, systemic banking stress, and growth-driven recessions where central banks cut rates. When inflation surprises to the upside—fueled by sticky con
XAU+0.38%
Gold per ounce has fallen to $3500. I expect a rebound from the $3200-$3500 range. Then it will drop to $2800 and begin rising. #XAUUSD #Altın
⚠️ This is not investment advice.
post-image
XAUUSD-2.40%
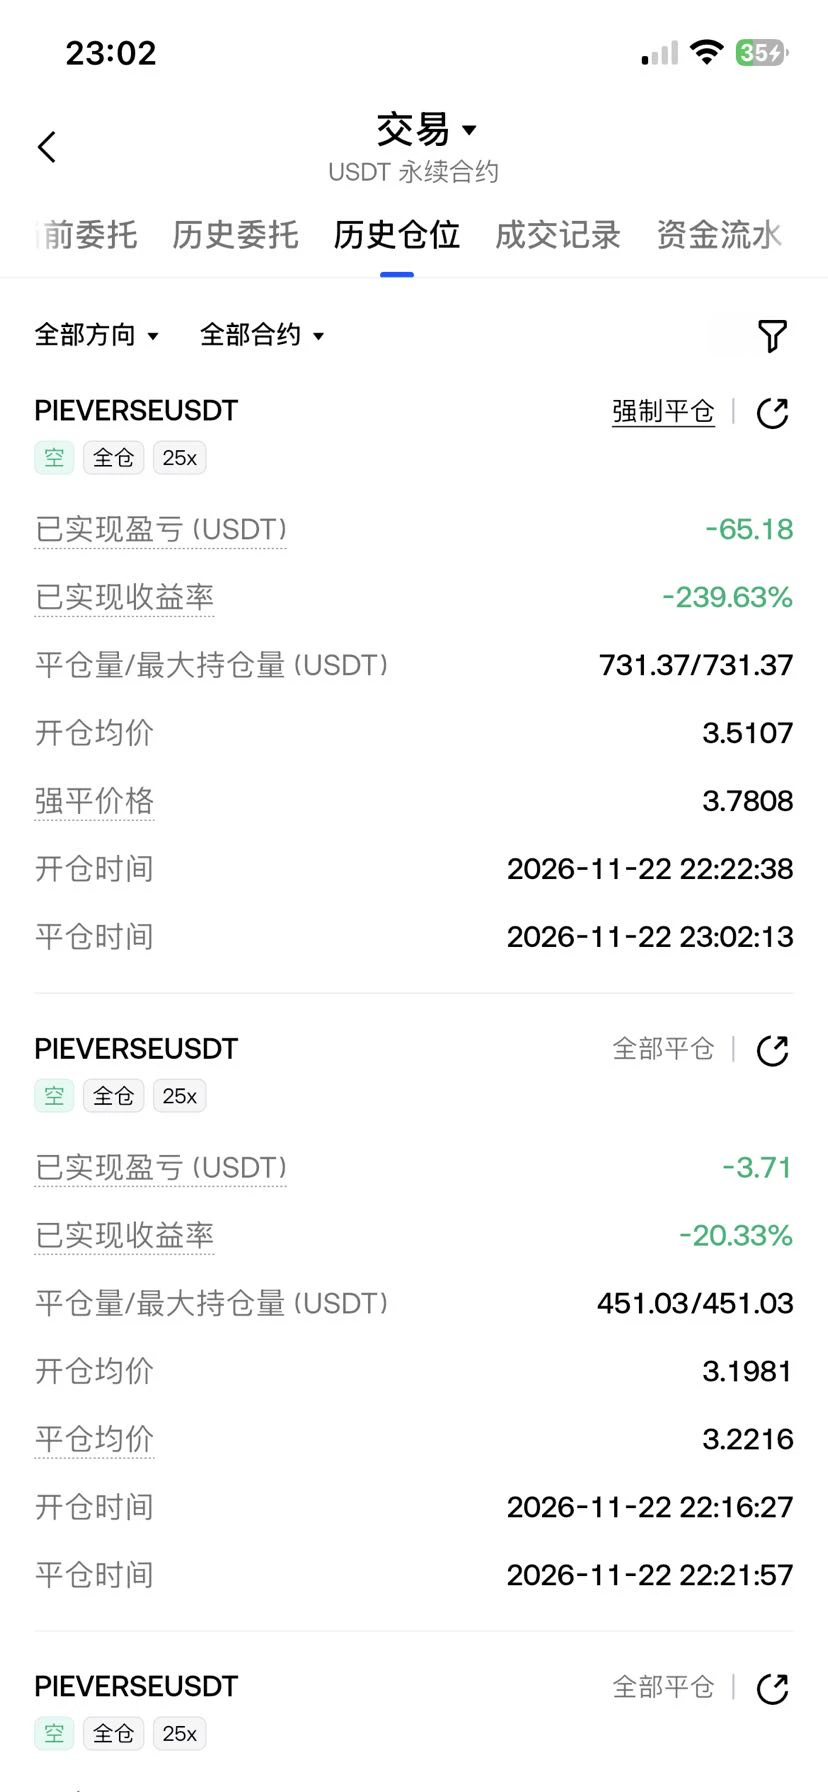
$PIEVERSE Take any screenshot, and it looks like it's all bots buying and selling, with every order at 7.44
post-image
PIEVERSE+0.58%
  • 1
Mining rig rumors remain unconfirmed; $ETH 24h +1.2%, I'm bullish
$ETH is quoted at 1712.68, up 1.2% in 24h, with an intraday range of 1648.37 to 1732.22. I'm bullish.

Word is going around that older Antminer S19, Whatsminer M60, and Whatsminer M66 rigs have reached their shutdown prices—but the rumors are unconfirmed, and the market is already trading on them: ETH rose from 1683.8 to 1711.41, while BTC at 60957.06 is holding near the bottom of its 30-day range.

First, the daily RSI is just 25.9, deep in oversold territory;

Second, the 30-day change is -28.32%, and the price is near the bo
ETH-1.26%
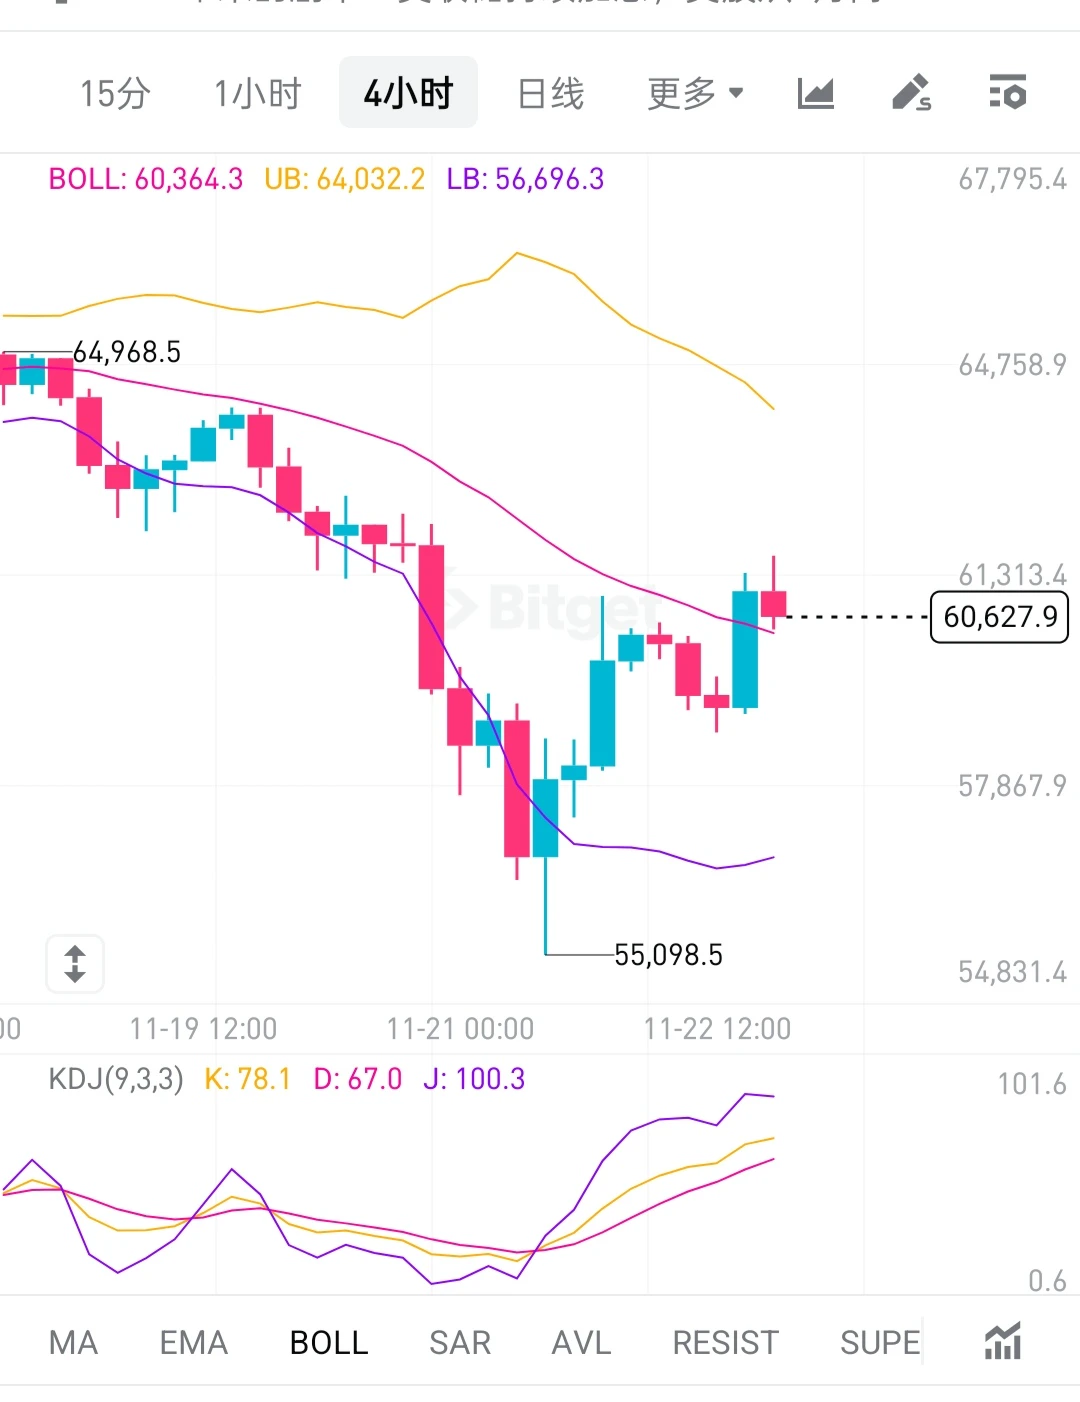
11/22 BTC:

On the 4-hour chart, the current price is near the middle band, with the low touching around 55100. This is a rebound recovery after a sharp drop. The upper band resistance is around 64000, and the lower band support is around 56700. The overall larger structure remains bearish, with the area near the middle band serving as the short-term bull-bear dividing line.
​
KDJ indicator: K is 78.1, D is 67.0, and J is 100.3. It is nearing overbought territory. Short-term rebound momentum is strong, but the price could face resistance and pull back, so chasing the rally is not recommended.
post-image
BTC-0.67%
Crypto Fear and Greed Index drops to 11, market sentiment plunges to freezing point.
live-cover
LIVE1,181
BTC-0.67%
SOL-0.77%
ETH-1.26%
XRP-1.15%
USDC+0.01%
An extra layer of protection for stock trading — trade with greater peace of mind https://www.gate.com/campaigns/7100?ch=9989&ref_type=132
post-image
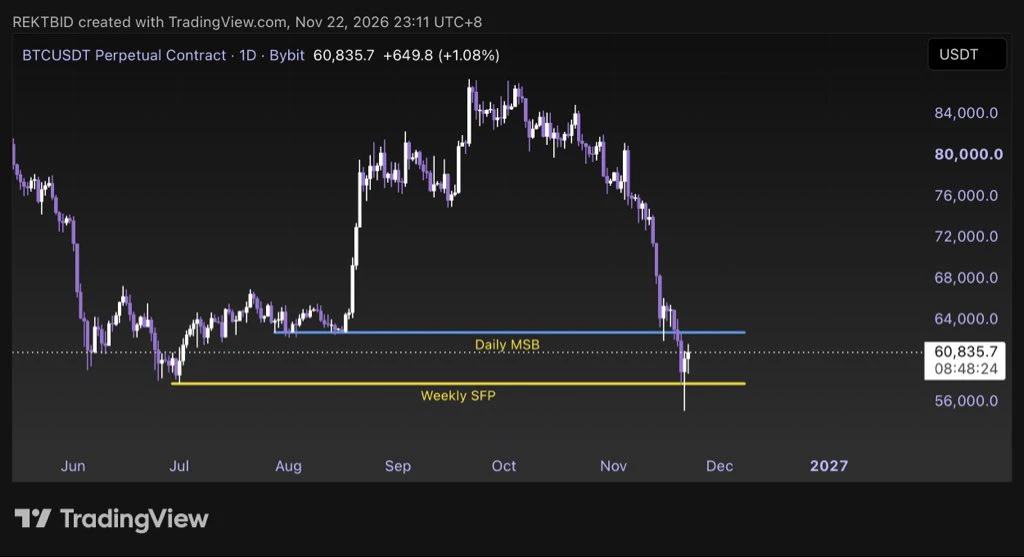
If weekly put in a SFP while daily confirmed a MSB with a LL. So the question is which side do you stand on? How would you position yourself ?
Shorting HL or Long the SFP?
post-image
SFP-1.85%
HL-5.56%
  • 1
(New Streamer) BTC market update
live-cover
LIVE1,575
BTC-0.67%
ETH-1.26%
NVDAG-0.24%
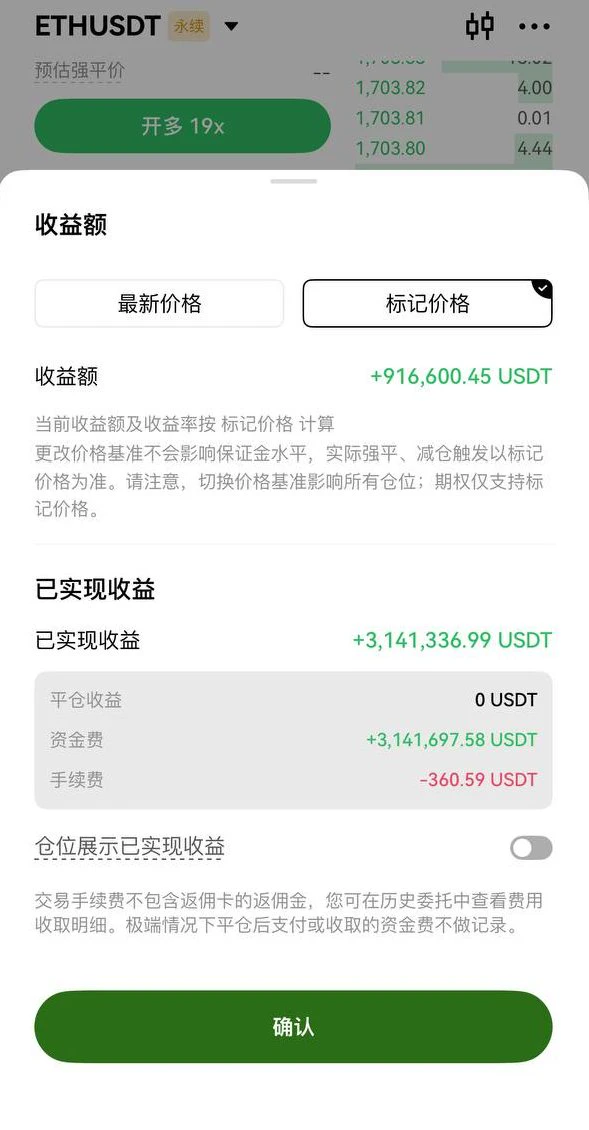
The position is still open, and the fees are killing me.
post-image
#BLESS #WCTCS9 #ShareWeekly
BLESS RICE ANALYSIS: Is This a Genuine Recovery or Another Bull Trap? Key Levels, Market Momentum, and Trading Opportunities

BLESS is entering a critical phase where both bulls and bears have strong reasons to remain active. After a powerful weekly recovery followed by a sharp daily correction, the market is presenting an important question: are buyers preparing for another upward move, or is the recent rally losing strength? Based on the November 21, 2026 reference snapshot, BLESS was trading around $0.012484, with a 24-hour low near $0.010288 and a high around $0
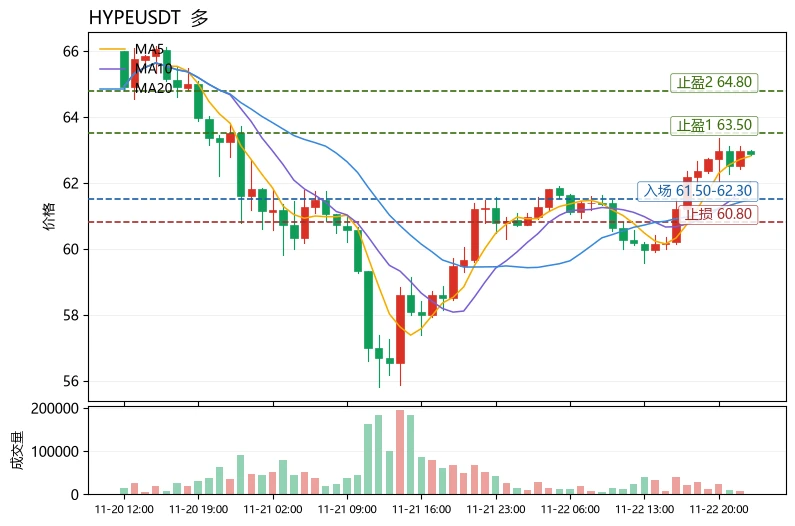
$HYPE Current price: 62.88. The upper Bollinger Band at 63.52 is the first resistance, while MA20 at 61.50 is the short-term bullish defense. A break below 61.50 would invalidate this bullish structure, with the next support at the lower Bollinger Band at 59.48.
Bullish case: MA5 has crossed above MA20, and the MACD histogram at +0.2432 remains bullish. However, RSI at 63.3 is nearing overbought territory, and the price is hugging the upper band, making the risk of chasing higher significant. Volatility-wise, the 30-candle range is about 8.3%, moderately high; no single position should exceed
post-image
HYPE+0.24%
MMT-2.35%
NEAR+1.17%
One research finding on why chimpanzees did not evolve into humans suggests that a virus emerged 7 million years ago and affected chimpanzees’ brain development, preventing them from developing intelligence, while humans are immune to the virus.

This seems like a fairly plausible theory, and it finally answers a question I could never figure out as a child
post-image
Load More

Join 40 M users in our growing community

⚡️ Join 40 M users in the crypto craze discussion

💬 Engage with your favorite top creators

👍 See what interests you

Trending Topics

BTCReboundFaces60KTest

2.1M Views30.1K Discussing

BTC rebounded from around $55,300 on November 21, briefly reclaiming $60,000 before pulling back to around $59,300. The $60K level is back in focus as traders assess whether the recovery can last. Is this rebound a sign of stabilization or a short-lived recovery? Would reclaiming and holding $60K be enough, or do you need confirmation from trading volume and fund flows?

PCEAndGDPDataNextWeek

259.8K Views2.6K Discussing

GateDirectIPOPhase3ANTAllocates92100Shares

842.8K Views5.1K Discussing

View More