Square
Following
Hot
News
Profile
Share your thoughts
placeholder
Article
new stimers
live-cover
LIVE1,629
Microsoft, Google, Amazon, Apple, or Nvidia: Who has the best shot? Tech giants’ next trump card may not be in revenue!
The Magnificent Seven’s earnings reports are all about revenue on the surface, but in reality, the question is who can turn AI into profits most effectively.
For Microsoft, keep an eye on Azure cloud and paid conversion for Copilot; Alphabet needs to prove that Google Cloud and AI products can contribute revenue consistently; Amazon’s key question is whether AWS growth can cover infrastructure spending.
Apple faces a different test: Can AI drive demand for new devices, rather
NAS100+0.58%
  • 31
Trenches
Kimchi
K
bade
b
Kimchi
CSoc...pump
Market Cap
$.
Change
.
24h Vol
$.
Holders
.
CNPY
C
bade
b
CNPY
0xc6...ddd2
Market Cap
$.
Change
.
24h Vol
$.
Holders
.
AGT
A
bade
b
AGT
0x5d...e274
Market Cap
$.
Change
.
24h Vol
$.
Holders
.
kimchi
k
bade
b
kimchi
B1Y2...pump
Market Cap
$.
Change
.
24h Vol
$.
Holders
.
ZIG
Z
bade
b
ZIG
0x8c...1145
Market Cap
$.
Change
.
24h Vol
$.
Holders
.
[New Streamer] 🔹Musk Explores a Potential SpaceX-Tesla Merger! Could Combining the Two Giants Resha
live-cover
LIVE2,195
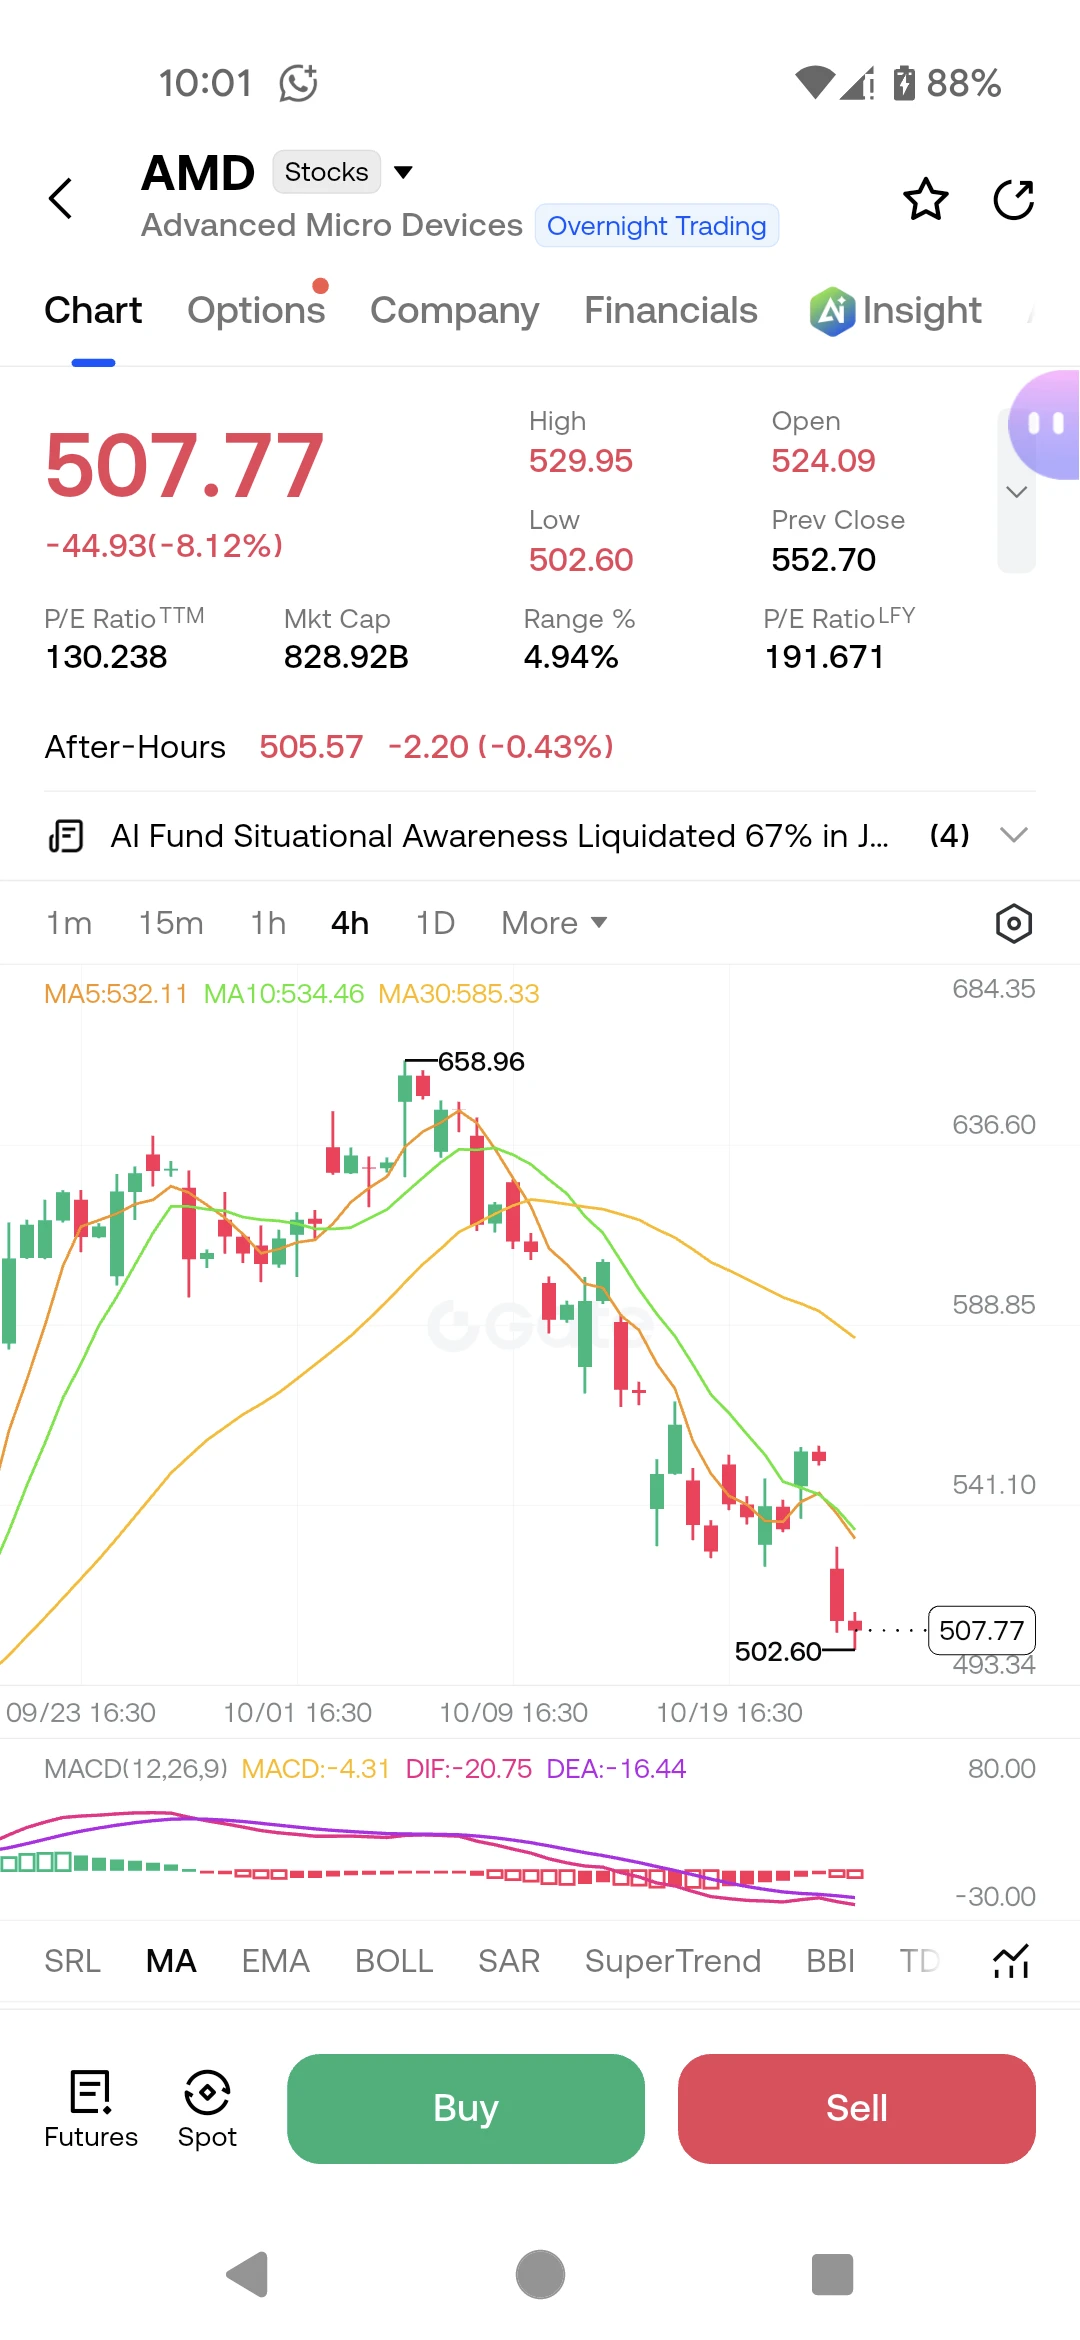
$AMD ‌ is in freefall after a major AI fund liquidation, and the chart shows no signs of a floor yet.
Trading Plan Short AMD
Entry: 505.00 - 512.00
SL: 540.00
TP1: 502.60
TP2: 485.00
TP3: 460.00
AMD is down a massive 8.12% today at $507.77, and the 4-hour chart is a textbook example of a cascading breakdown. The price is trading far below all key moving averages: MA5 at $532.11, MA10 at $534.46, and MA30 at $585.33. The MACD histogram is deeply negative at -4.31, with DIF at -20.75 below DEA at -16.44, confirming that the selling pressure is accelerating.
The real catalyst here is the news fl
post-image
AMD-8.12%
Is this the best CT has to offer these days jfc
post-image
CT-14.27%
#USTechStocksSellOff $NVDA $META $AMD #ShareWeekly
Heavy day for tech, but I’m not reading it as “the AI trade is over.” My view: this is a de-risking of the most crowded corner, AI chips and big AI spenders, driven by funding and supply worries, not by valuation alone. The semiconductor index lost about 6.7% and the tech-heavy index 2.6%, while the Dow finished flat.
1. Read the breadth before the headline
The Dow closed roughly unchanged and the S&P 500 fell 1.2%, its worst day since July. That gap says the damage was concentrated in AI-linked names. NVDA fell about 4.4%, AMD about 8%, Mar
NVDA+1.19%
META+0.65%
AMD+2.59%
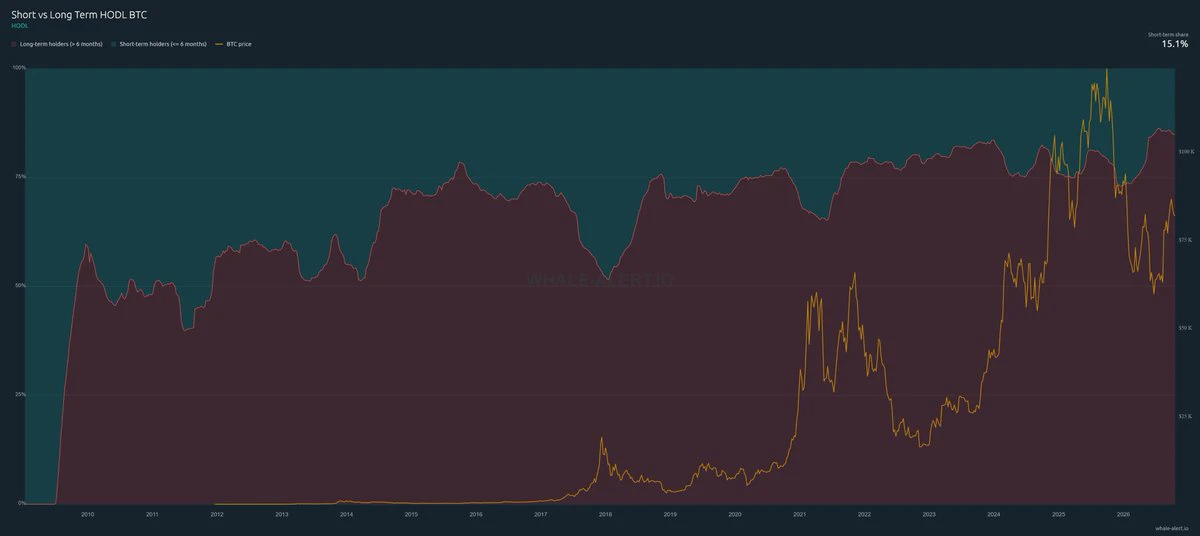
📊 📊 📊 We have updated the dashboard analytics with a new look, a few QoL upgrades and two very cool new graphs showing the unrealized profits for long and short term HODLers and the % of total coin supply held by both short and long term HODLers.
Check it out here:
post-image
😶‍🌫️ MORE THAN $1 TRILLION WIPED OFF THE METALS MARKET!
📉 Metals markets tumbled across the board as oil prices surged, stoking inflation concerns ahead of next week's Fed meeting.
🔻 Notable declines:
🥈 Silver: -5.8%
🥇 Gold: -2.8%
⚙️ Platinum: -4%
🔩 Palladium: -3.7%
🟠 Copper: -2.8%, hitting a five-week low.
💸 More than $1 trillion in market value has vanished! Based on CompaniesMarketCap supply data, gold lost about $810 billion, while silver shed more than $190 billion in estimated market capitalization.
⚠️ Notably, pressure is not coming only from oil prices and inflation fears; it
post-image
Why are some people nowadays reluctant to have children?
A big part of the reason is that they’re afraid the children they raise might grow up to turn around and physically abuse them, or even harm them.
If the child is just lazy and gluttonous, at most it means one more place setting at the table.
But if they’re the kind of person who’s always getting into trouble, there’s a good chance that all the savings their parents worked hard to build up over a lifetime will go down the drain.
post-image
🚀 $IRYS
Strong bullish breakout……Bulls are in full control, targeting higher resistance levels……Go long now with 10x leverage: Entry range: $0.0270 – $0.0282Take profit 1: $0.0300Take profit 2: $0.0320Final target: $0.0350Stop loss: $0.0233$IRYS Currently trading at around $0.02868, up 42.76% in 24 hours, the daily chart shows strong bullish momentum. The price is approaching the key psychological resistance level of $0.0300. A decisive breakout above this level on high volume could open the way to $0.0320, or even $0.0350.⚠️ Chasing the price after such a sharp rally is very risky. It is re
post-image
IRYS+70.69%
Sprint from ¥800 to ¥100,00, and make a name for yourself on Gate again through live trading from start to finish!
After weathering countless trials, we’re still young at heart—just get it done
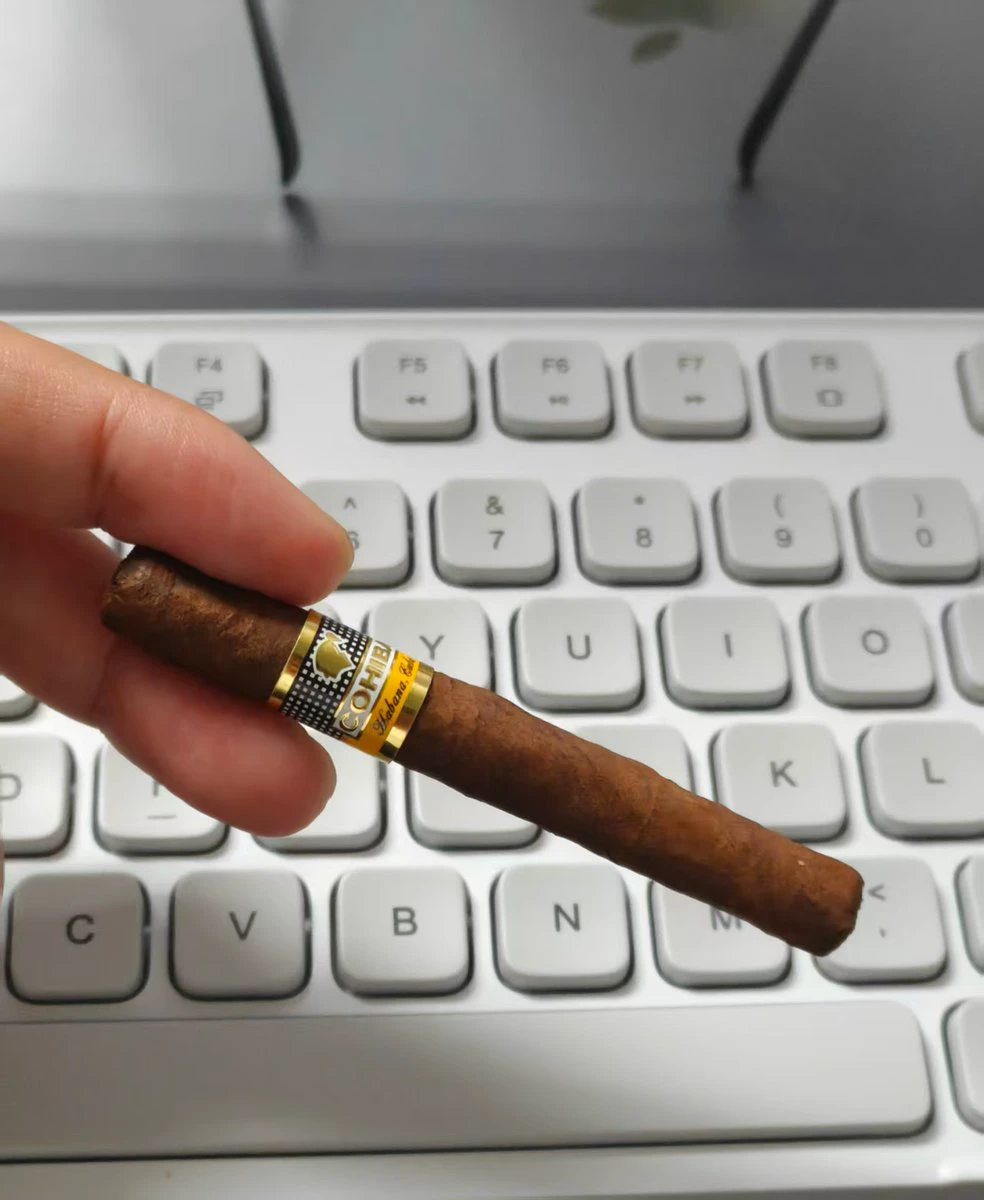
Even the smallest Cohiba is still a Cohiba.
The little one is cute too 🤏
post-image
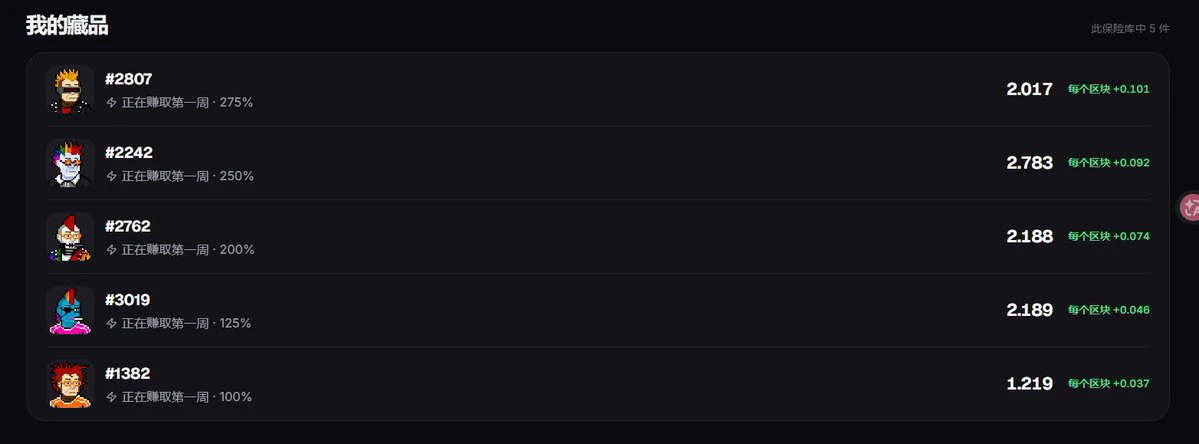
Bought a few privacy Rune NFTs in the BTC ecosystem, holding a share $SHNAKAS
I’m no expert in this area; my friends talked me into it. The BTC ecosystem has its own style, and it can pump just as hard. I’m participating a little. (I specialize in POW new coins; I’m a novice at everything else. NFA DYOR)
post-image
BTC-0.33%
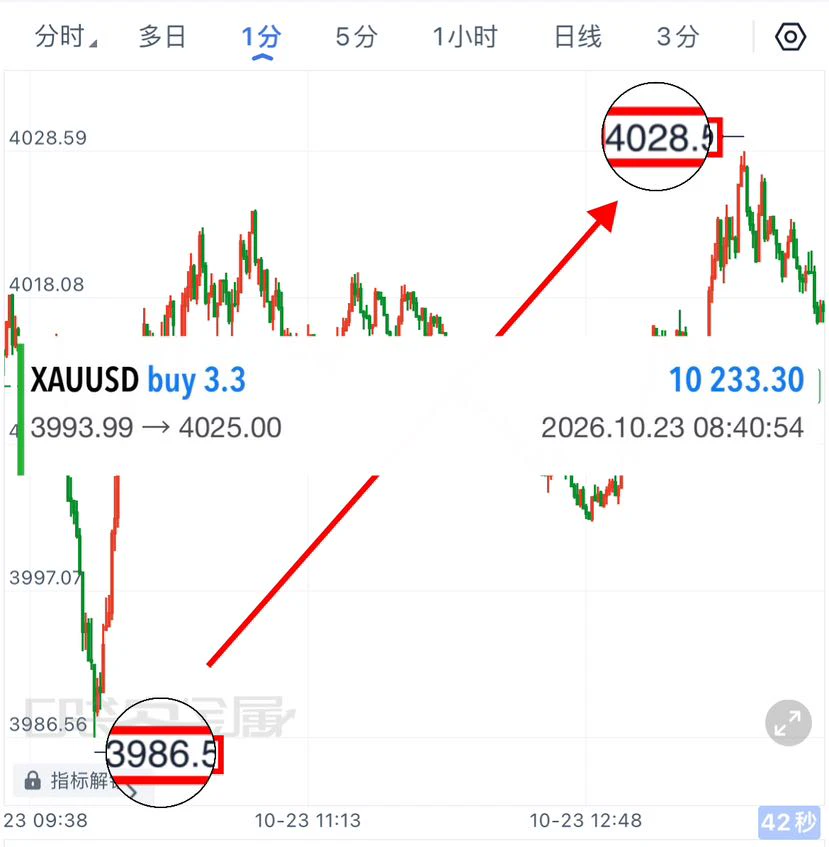
A long position entered around 3993 hit take profit at 4025, capturing a full 32-point move and locking in 10233🔪.
$XAUT
post-image
XAUT-1.67%
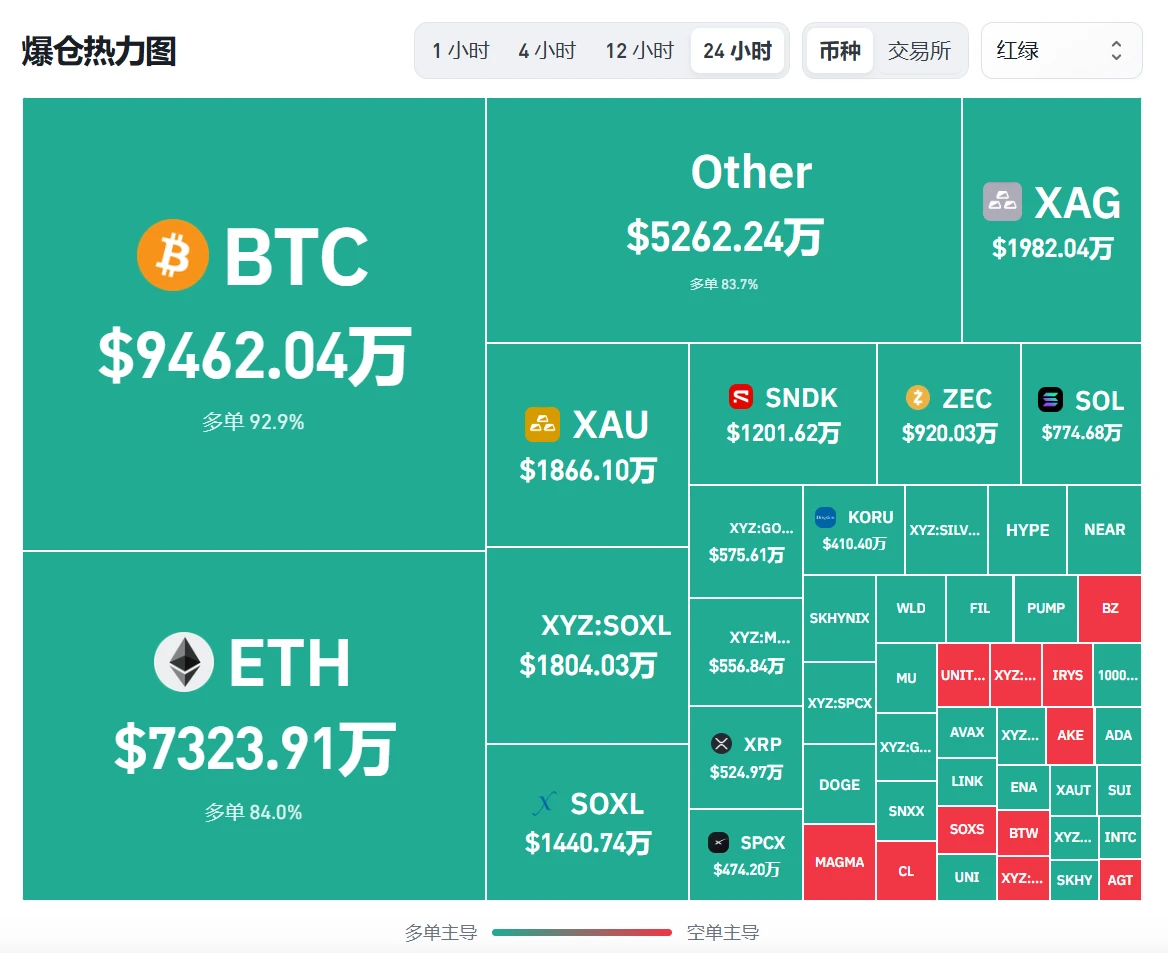
Is BTC’s 4,000-point plunge just an appetizer? Don’t buy the dip on the rebound—the bears still have a big move up their sleeve! Early long positions were brutally liquidated. After the big players “cleaned house” above 84300, long liquidations caused open interest to plunge, and the market simply lacks the momentum for a short squeeze. The current rebound is only an oversold correction and a retest of the daily gap—not a reversal! Trading plan: decisively go short near 82500! This is an excellent resistance level after the gap is filled, with targets at 80000–78000. Still stubbornly holding l
post-image
BTC-0.33%
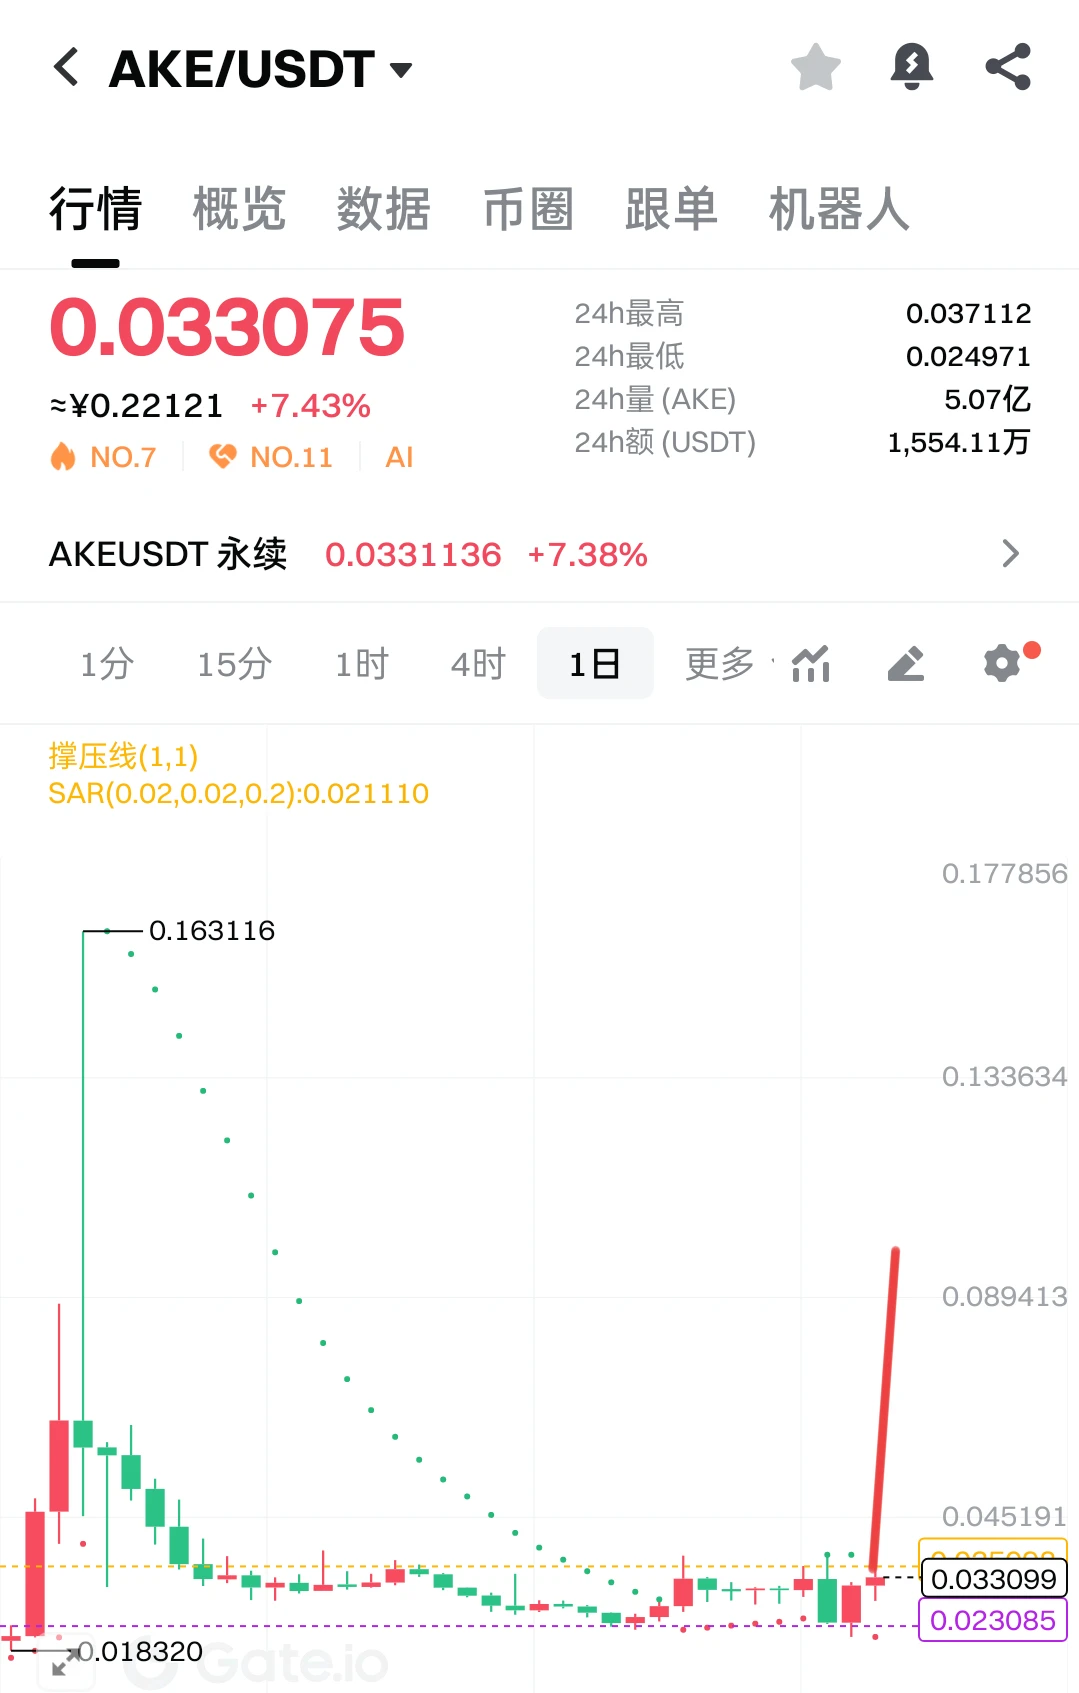
#AKE Retail traders have no spot; they're all short. Take off.
post-image
AKE+27.49%
10.23 ETH Analysis
The 1-hour ETH chart shows a converging recovery structure after a peak divergence. After retesting support at the lower Bollinger Band, the price staged a weak rebound and is now trading under pressure below the middle band. The BBW indicator continues to narrow, with volatility entering a compression phase. The TTMU long/short ratio is tilted bullish, but the long premium lacks confirmation from incremental capital. The rebound is a passive recovery after oversold conditions, not a trend reversal. Resistance from the upper band is clear, rebound momentum is fading step by
post-image
BTC-0.33%
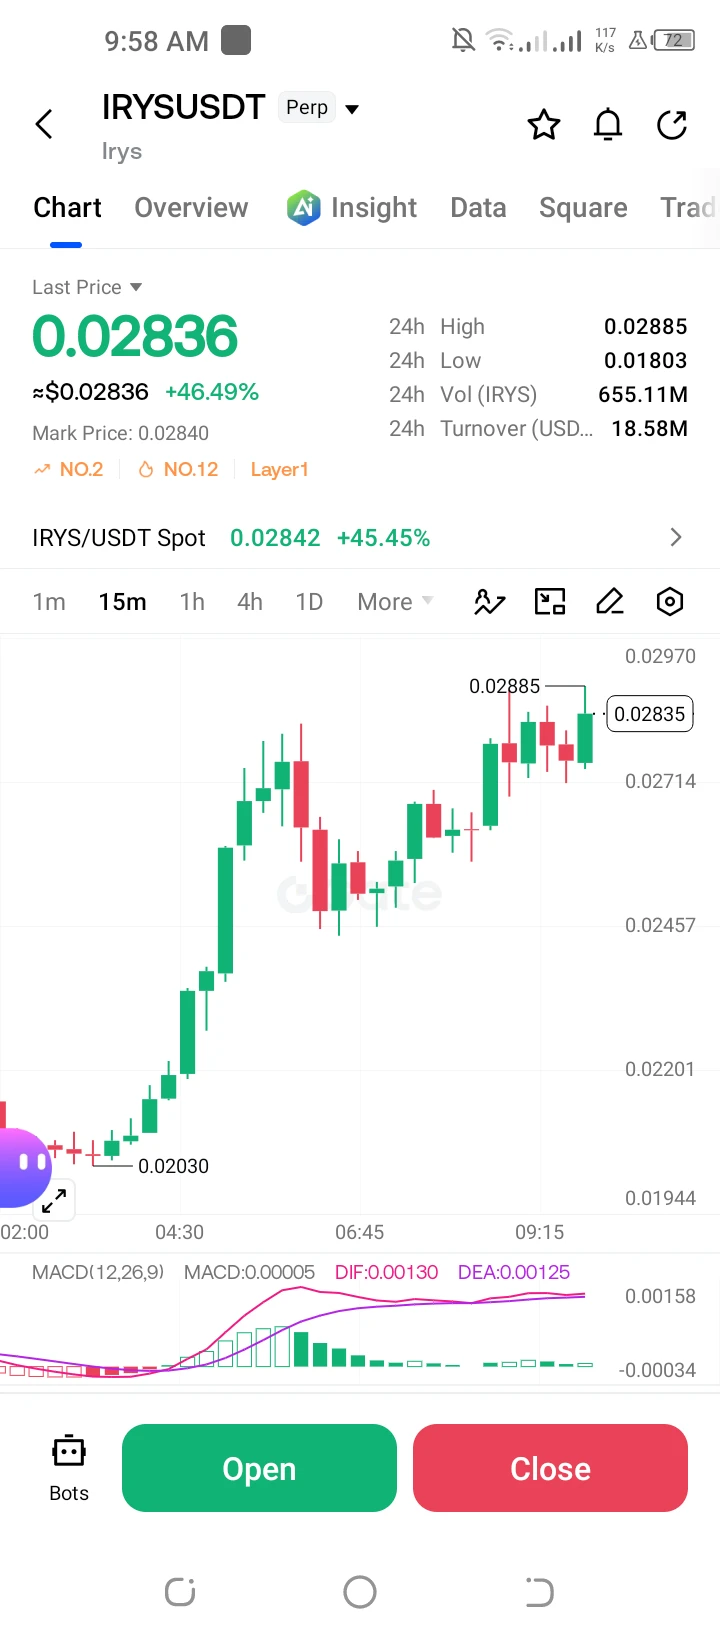
**$IRYS /USDT Perp – "Bullish Continuation – Long"**
Trading Plan Long $IRYS
Entry: 0.02836
SL: 0.02714
TP1: 0.02885
TP2: 0.02970
IRYS is up +46.49% and holding above the 0.02714 level after the 0.02885 high. MACD is bullish; targeting the 0.02970 level.
post-image
IRYS+70.69%
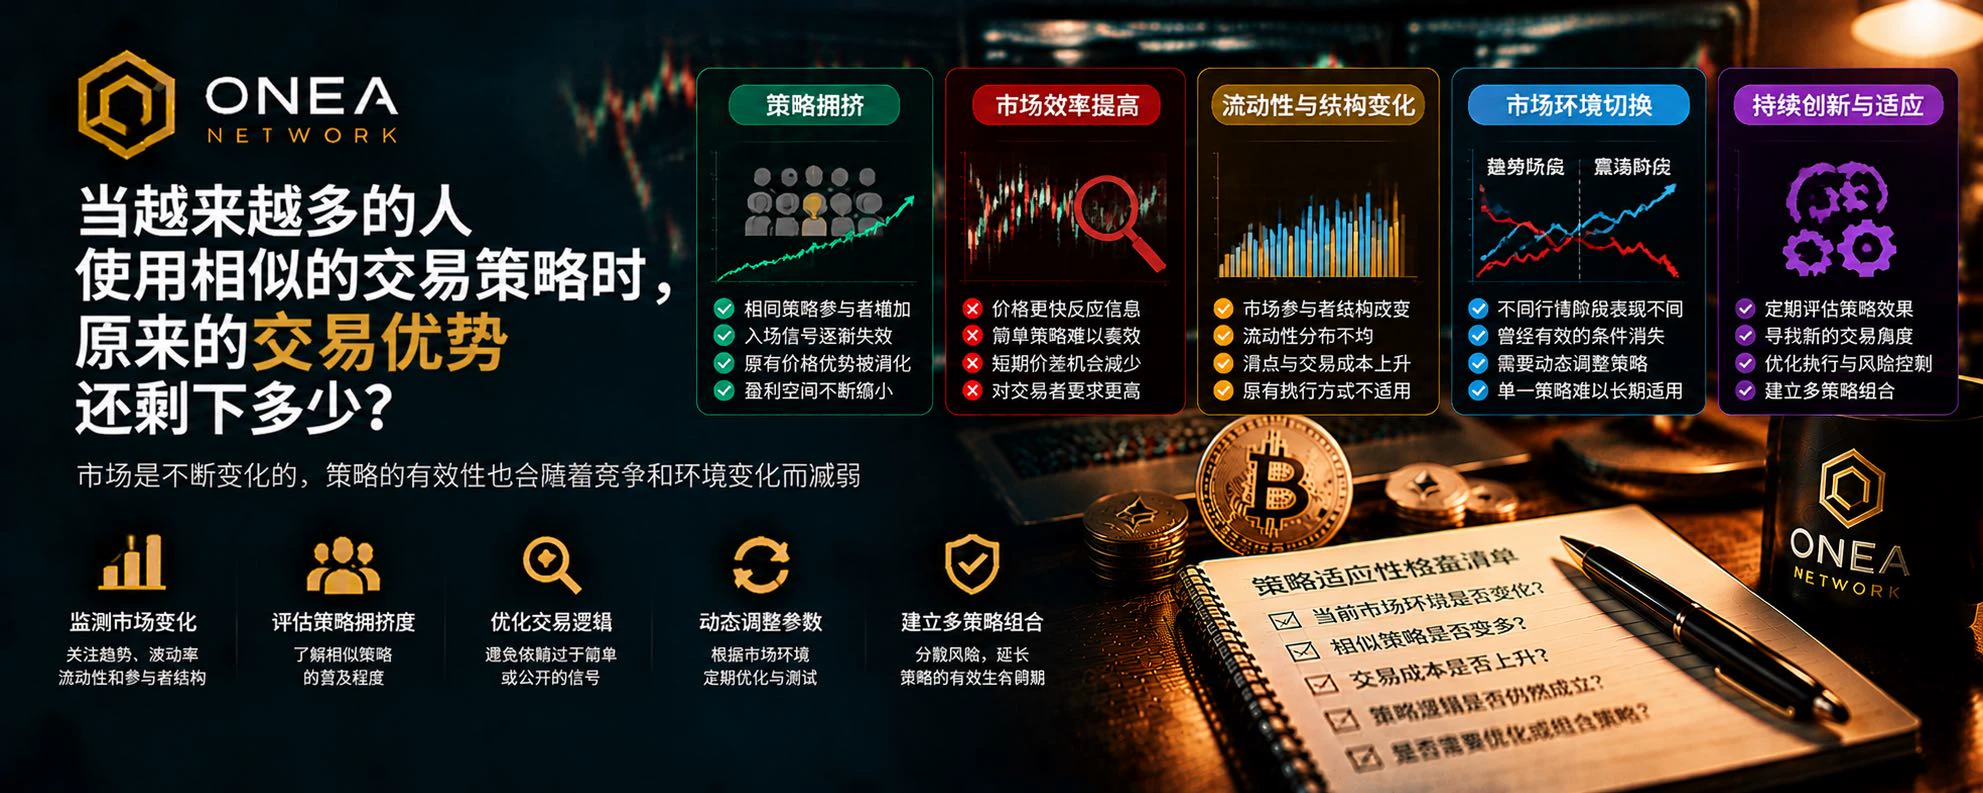
Where do profits come from when everyone is using similar trading strategies?
A question worth thinking about:
If a trading strategy really works, why can't it work forever?
Suppose a simple breakout strategy was able to capture trends in past markets. As more and more traders discover this pattern, they start buying at similar price levels and placing stop-losses at similar levels.
The initial edge may begin to change.
This involves an important concept: trading edges are affected by the behavior of market participants.
1. What happens to the market when an edge is widely used?
First, trading
post-image
  • 3
Load More

Join 40 M users in our growing community

⚡️ Join 40 M users in the crypto craze discussion

💬 Engage with your favorite top creators

👍 See what interests you

Trending Topics

USEarningsSeason

4.51k Views2.73k Discussing

The U.S. Q3 earnings season is in full swing, with major tech companies including Tesla and Meta reporting results. Market focus is shifting beyond revenue and profit toward AI spending, capital expenditure, margins and forward guidance. Which company’s earnings are you watching most closely?

GateWCTCS9GlobalTradingCompetition

404.74k Views7.58k Discussing

BTCDropsBelow81000

46.25k Views37.98k Discussing

View More