
Share crypto content and earn up to 60% commissions through content mining.
placeholder
gatefun
$MAGMA got hit hard, plunging from 0.4559 straight to 0.2664 in 24 hours, down 37%, with $100 million in trading volume. It now looks like it is catching its breath at 0.2835, but I strongly advise you not to get itchy-fingered and buy the dip—this price is nowhere near the bottom; it is merely scenery halfway down the mountain.
Don’t tell me “it’ll rebound after falling so much.” Look at the data: the rebound has no volume, while the sell-off is well supplied—a classic whale distribution pattern. If you are truly bullish on MAGMA, you should be asking, “What makes it capable of surviving amon
MAGMA-36.35%
View Original
post-image
post-image
post-image
  • Reward
  • Comment
  • Repost
  • Share
Nvidia returns to $5.4 trillion: The AI bull market is not over, but the era of “buying with your eyes closed” may be
Nvidia’s market cap has climbed back above $5.4 trillion, meaning capital markets have once again pushed the AI leader into the spotlight.
In the latest session, Nvidia rose more than 3%, becoming a major force behind the rebound in U.S. technology stocks.
The most noteworthy aspect of this rally is that the market has started trading on the core logic that “AI demand will continue to grow” once again.
Previously, the market had worried that AI capital expenditures might be ove
NVDA1.78%
View Original
post-image
post-image
post-image
  • Reward
  • 45
  • Repost
  • Share
CoinWay:
Enter by buying the dip 😎
View More
$SOL Signal】Go long + 1H/4H bullish momentum continuation
$SOL Order book imbalance is 9.06%, with buy-side order depth clearly dominant and active capital absorption. The 1H MACD fast line at 1.3739 is above the signal line, while the histogram at 0.2391 has contracted slightly. RSI at 68.43 has not entered overbought territory. The 4H Bollinger upper band is at 105.77, with price advancing near the upper band. The 4H MACD histogram at 0.6189 continues to expand. The bullish structure remains intact on the 4H timeframe.
🎯Direction: long
⚡Entry/limit order: 104.6451 - 104.9600
🛑Stop loss: 1
SOL4.30%
View Original
post-image
  • Reward
  • Comment
  • Repost
  • Share
Nvidia has returned to a $5.4 trillion market cap; what’s truly frightening is that AI is still expanding
Nvidia has reclaimed a $5.4 trillion market cap, and the market has once again begun discussing a familiar question: Has Nvidia become too expensive to touch?
My answer is: Whether it is expensive depends on what you use to measure it.
If you look only at market cap, $5.4 trillion is indeed a staggering figure. But viewed against the broader backdrop of the AI industry boom, what Nvidia is truly enjoying is not the valuation of an ordinary chip company, but the premium brought by the super
NVDA1.78%
View Original
post-image
post-image
  • Reward
  • 17
  • Repost
  • Share
CoinWay:
Enter at the bottom 😎
View More
#Gate60MillionUsers reached a historic milestone in the cryptocurrency sector. With its secure infrastructure and wide range of assets, the platform has earned the trust of investors worldwide and once again cemented its leading position in the digital transformation of global finance with this major milestone. The exchange, which continues to grow, is carrying the digital asset ecosystem into the future together with its global community.
My first experience was an excitement that grew as I earned... 📈✨ But the best part of this journey was not the earnings, but the wonderful friendships I
View Original
post-image
  • Reward
  • Comment
  • Repost
  • Share
BTC returns to $78,000! The market rebounds after finding support, is it time to buy the dip or wait
gate liveLIVE
10
  • Reward
  • Comment
  • Repost
  • Share
$BR Signal】Long: 1H pullback stabilizes + 4H momentum continues
$BR 4H RSI 80.04, with the price hugging the 4H Bollinger upper band at 0.3182. 1H MACD has formed a death cross, while the price holds around 0.316 and selling pressure is being absorbed quickly. Order book depth imbalance is 16.07%, with a buy/sell ratio of 1.38 and substantial bids below. The funding rate is 0.0092%, showing no signs of overheating. 4H momentum has the edge, the 1H consolidation is resilient, and the short-term structure is bullish.
🎯Direction: Long
⚡Entry/limit order: 0.3156402 - 0.3165900
🛑Stop-loss: 0.300
BR41.51%
View Original
post-image
  • Reward
  • Comment
  • Repost
  • Share
The short position I set a few days ago before bed had already made me feel too embarrassed to take a screenshot by the time I woke up. 😏 $STRK was surging pretty aggressively then, but the volume simply didn’t keep up, with volume continuously declining at the highs—isn’t that a textbook sign of a weak rebound? I went short at 0.03656 as planned. When I checked the chart after lunch, the price had already slid to 0.02779, with +1156.52% in floating profit. The brothers on board must have woken up laughing. It really dragged beforehand, but the outcome is truly sweet. The strategy is simple:
STRK3.95%
ETH5.03%
ADA10.92%
View Original
post-image
  • Reward
  • Comment
  • Repost
  • Share
Kimi Confidentially Files for a Hong Kong IPO, Bringing AI Foundation Models into the “Capital Monetization Phase”
If the news ultimately materializes, Kimi’s parent company Moonshot AI having confidentially submitted an A1 filing to the Hong Kong Stock Exchange would mean that this star Chinese foundation-model company has formally put an IPO on the table. It should be emphasized that the company has so far responded “no comment” to the relevant news, so at this stage it is more appropriate to view it as a market signal that the IPO process has begun, rather than as a confirmed listing
Why is
View Original
post-image
post-image
  • Reward
  • 47
  • Repost
  • Share
CoinWay:
Get on board quickly! 🚗
View More
this is a sucker's rally, and it will fail like the others
post-image
  • Reward
  • Comment
  • Repost
  • Share
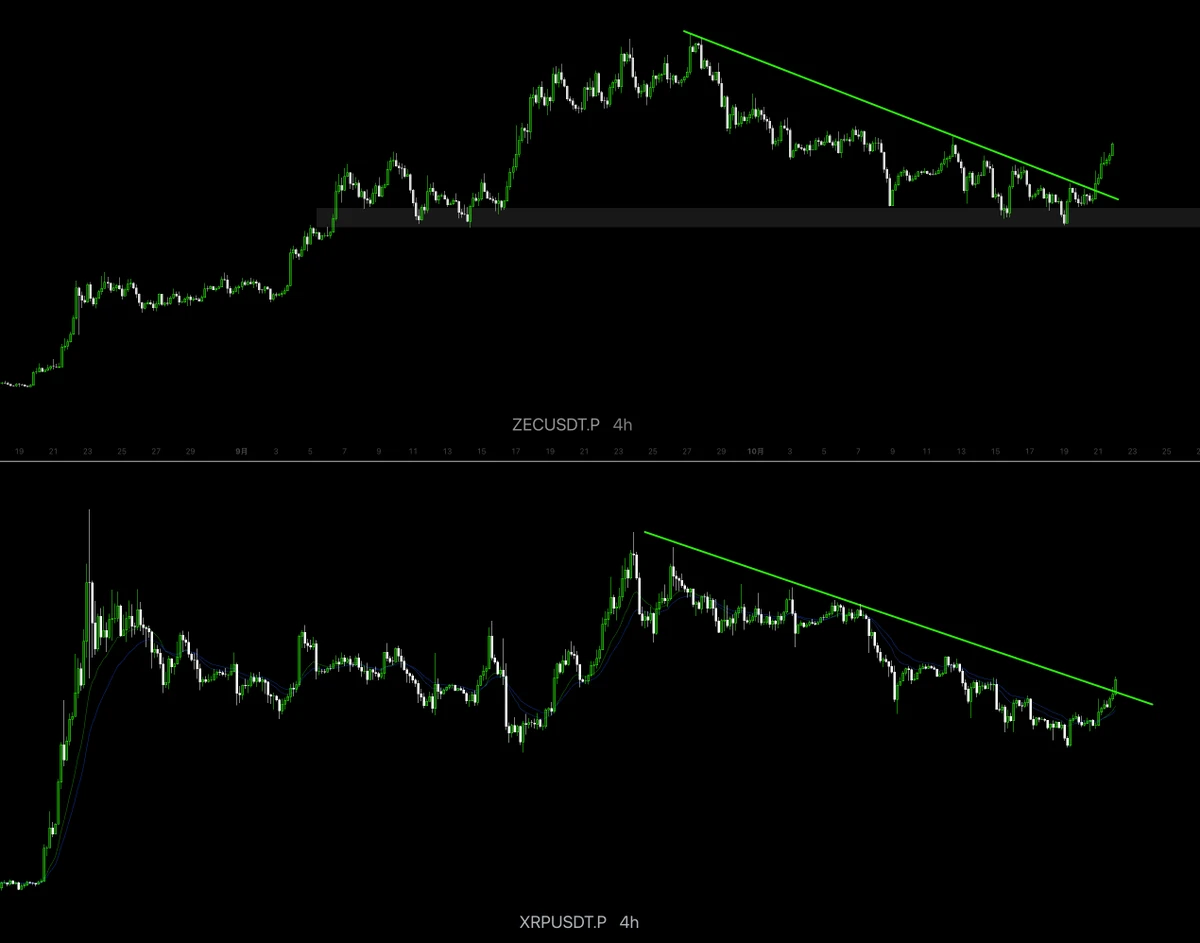
With this move, I don't even need to think—the account is dancing on its own. While everyone else was still waiting and watching, I already felt something was off. It had clearly moved sideways at the highs for so long, selling pressure kept growing, yet trading volume kept shrinking. That's not a good sign.
I saw it even more clearly while it was grinding out a bottom intraday: support was insufficient, and no one was stepping in to buy as it moved up. This kind of price-volume divergence can't hold for long. So around 0.5243, I directly went with a short-side approach, focusing on following
ZEC17.41%
SNDK0.31%
View Original
post-image
  • Reward
  • Comment
  • Repost
  • Share
No trading, no analysis, just sheer luck—this performance is embarrassing even to talk about🤪 When the screen was glowing green, everyone else was running, but I was watching something else—the size of the rebound. Trading volume was pitifully low, while the sell orders were heavy, and every rebound looked like it was barely hanging on. The resistance above was obvious; in this situation, short positions were practically free money. I remember clearly that the signal came at 0.06403, while the current price is 0.06139, with a return of +81.18%—enough to treat yourself to a good meal😌 Money e
LAB5.99%
BTC5.43%
View Original
post-image
  • Reward
  • Comment
  • Repost
  • Share
$CHIP Signal】1H downside-resistant sideways movement + negative funding rate short squeeze setup
$CHIP 4H RSI 73.18, 1H MACD histogram contracted to 0.0001, sell-side order book depth is 4 times that of the buy side, yet the price remains sideways above 0.0555. The negative funding rate of -0.0005% has still failed to push the price lower.
🎯Direction: Long
⚡Entry/limit order: 0.0553933 - 0.0555600
🛑Stop-loss: 0.0550044
🚀Target 1: 0.0563934
🚀Target 2: 0.0568101
🛡️Trade management: - Reduce the position by 50% upon reaching Target 1, and move the stop-loss up to breakeven; if the price fa
CHIP32.32%
BTC5.42%
ETH5.02%
SOL4.29%
View Original
post-image
  • Reward
  • Comment
  • Repost
  • Share
September 4 Jinman Gold Morning Review:
Spot gold consolidated sideways at high levels in early trading. It opened today at 4471.10, essentially flat versus yesterday’s close, and is currently quoted at 4475.76. The intraday high reached 4478.72, while the low was 4471.10. Overall volatility has narrowed, with the market in a consolidation phase to build momentum after the sharp rally.
Yesterday, gold prices staged a one-way surge, climbing more than 200 points from the interim low of 4282.53 to reach around 4510 at the high, as bullish momentum was released in concentrated fashion.
Technicall
BTC5.42%
ETH5.02%
View Original
post-image
  • Reward
  • Comment
  • Repost
  • Share
What truly tests people in this kind of market is not whether they dare to act, but whether they dare to enter when everyone else has yet to react. After the two-hour triangle consolidation completed, the price returned to 77609.8, with clear support near the moving averages. I judged that this was not a consolidation continuation, but the starting point of a new move.
After entry, the price quickly moved away from the cost basis, with even the pullback lasting only a short time, indicating that the buyers remained in control. From entry to the current 81147.2, the unrealized profit is +790.46
SOL4.30%
DOGE8.03%
View Original
post-image
  • Reward
  • Comment
  • Repost
  • Share
$SNDK
Sleeping giant.
$1,600 is the level. Give me the break with volume and this thing is ready to explode.
$1,750 is the target.
SNDK0.13%
post-image
  • Reward
  • Comment
  • Repost
  • Share
9.4 Gold Morning Strategy
Overnight, the gold price surged to around 4510 before coming under pressure and retreating. The market has entered a high-level consolidation phase, with the pace of gains slowing noticeably.
The hourly Bollinger Bands are gradually flattening. The price has retreated from the upper Bollinger Band and is currently trading above the middle band. The broader bearish backdrop brought by Woshi's previous hawkish remarks remains in place. This round of market action is primarily defined as a corrective rebound after a sharp drop, so chasing longs at high levels is not rec
XAUT1.97%
View Original
post-image
  • Reward
  • Comment
  • Repost
  • Share
I had just switched the app to the background when it suddenly popped back up—what, is it playing hide-and-seek with me? A few days ago, I took a quick look before bed: $WLFI was facing clear overhead resistance, with sell orders continually pressing it down, while the candlesticks kept grinding along without breaking higher. I figured shorting from this level offered a decent risk-reward ratio, so I opened a position at 0.05841. When I woke up this morning, it had put on a spectacular cliff dive, reaching 0.05803 and handing me +49.8%—that felt damn good. All that waiting paid off. As for exe
WLFI2.70%
LAB5.99%
XRP7.75%
View Original
post-image
  • Reward
  • Comment
  • Repost
  • Share
After seeing this kind of market structure many times, the first reaction is not to chase as soon as volume expands, but to first confirm whether there is real support after the breakout. Price broke above it once earlier but failed to hold, then held the neckline on the second pullback, so the bullish structure remained intact. This trade was entered only after the pullback was confirmed.

The entry was at 828.40. At the time, the moving averages were beginning to converge, while volume was no longer continuing to contract, indicating that this move was unlikely to be a fakeout. The market h
LAB5.99%
ETH5.03%
View Original
post-image
  • Reward
  • Comment
  • Repost
  • Share
Load More

Join 40 M users in our growing community

⚡️ Join 40 M users in the crypto craze discussion
💬 Engage with your favorite top creators
👍 See what interests you
  • Pinned