Share your thoughts
placeholder
Article
Most traders will fade this $SLX /USDT short before the 4h close—here’s why that’s a mistake.

$SLX /USDT - SHORT

Trade Plan:
Entry: 0.06997 – 0.07029
SL: 0.07167
TP1: 0.06898
TP2: 0.06821
TP3: 0.06705

Why this setup?
- RSI 15m at 48.34 = zero momentum to push higher, just dead air.
- ATR 1h (0.000641) shows shrinking volatility—breakouts fail fast in range.
- Entry ref 0.07013 sits below 1D range mid; TP1 0.06898 is only 1.6% away.
- Why now? The “Armed” status means the trap is set before the weekend liquidity hunt.

Debate:
Are you shorting the breakdown to TP2 or waiting for a
SLX+1.84%
Everyone’s watching $BTC /USDT’s range—but the 4h clock just started ticking against the bulls.

$BTC /USDT - SHORT

Trade Plan:
Entry: 79603.5 – 79727.1
SL: 80259.1
TP1: 79220.0
TP2: 78923.1
TP3: 78477.8

Why this setup?
Why now?
- Price is pinned at 79,665 with RSI (15m) at 39.7—weak momentum, not oversold yet.
- ATR (1h) at 247 shows low volatility, but that’s a coil before a snap.
- Range-bound 1D trend means breakouts fake out—but our SHORT targets TP1 at 79,220 and TP2 at 78,923 are only 0.5% away.
- The invalidation at 79,079 is close—so if we lose this, the thesis flips fast
BTC+0.03%
Everyone’s staring at BNB’s 771.6—but the real trap is 788.7, not the floor.

$BNB /USDT - SHORT

Trade Plan:
Entry: 769.8 – 773.4
SL: 788.7
TP1: 758.8
TP2: 750.3
TP3: 737.5

Why this setup?
- 4h bias is SHORT with 55.4 confidence, yet 1D trend is *range*—so this isn’t a breakout, it’s a fade.
- RSI 15m at 49.58 = zero momentum; price is coiling inside a 769.8–773.4 pocket.
- Why now? ATR 1h (7.1) is shrinking—volatility compression precedes a 2–3% expansion. Targets 758.8 (TP1) then 750.3 (TP2) are the path of least resistance if 771.6 breaks down.
- Invalidation is clean: 714.6. Ris
BNB+7.27%
JUST IN: Long-term holding can beat timing, as Bitcoin’s annual gains cluster in a few days. Across 2010–2026, removing the top 10 days often flips profitable years to losses; 2019 would be -40% without its top days. $BTC
post-image
BTC+0.05%
What if the silver trade you're watching is already priced for a trap?

$XAG /USDT - SHORT

Trade Plan:
Entry: 66.28 – 66.34
SL: 66.59
TP1: 66.10
TP2: 65.96
TP3: 65.74

Why this setup?
$XAG /USDT sits at 66.31, but the 1D trend is just *range*—no fuel for a breakout.
- 4h bias is SHORT with 55% confidence—not a slam dunk, but a lean.
- RSI 15m at 56.55 shows weak momentum, not exhaustion.
- ATR 1h of 0.118 means tight moves—your TP1 at 66.10 is only 0.3% away.
Why now? Because the range is squeezing, and the next 4h candle decides if we see 65.96 or a fakeout to 66.52.

Debate:
Is
XAG+0.11%
Why did Arbitrum get so arbitrary? Because it decided to surge without warning.
$ARB ‌ARB/USDT – Up 24%, facing resistance near 0.17045
Short (rejection from resistance)
Entry Zone: 0.1660 – 0.1680
TP1: 0.1620 / TP2: 0.1580 / TP3: 0.1540
SL: 0.1720
Long (pullback to support)
Entry Zone: 0.1580 – 0.1590
TP1: 0.1620 / TP2: 0.1660 / TP3: 0.1700
SL: 0.1550
Key Levels
Resistance: 0.16665 / 0.17045 (recent peak)
Support: 0.1620 / 0.15904 / 0.14764 / 0.13623
⚠️ Not financial advice. DYOR and manage your risk.
ARB+22.73%
Everyone’s staring at $HOME /USDT’s 0.0061—but the 95% short signal says they’re looking at the wrong exit.

$HOME /USDT - SHORT

Trade Plan:
Entry: 0.0061 – 0.0061
SL: 0.0062
TP1: 0.0060
TP2: 0.0060
TP3: 0.0059

Why this setup?
Why now? The 1D trend is bearish, and 4h momentum is cracking. RSI (15m) at 53.37 is a weak bounce, not a reversal—it’s the last gasp before the drop. Entry 0.0061, TP1/TP2 at 0.0060 (tight but real), TP3 at 0.0059. Invalidation is clear: 0.0062. That’s a 1:2 risk-reward with a 95% confidence stamp—don’t overthink the micro-noise.

Debate:
Are you fading this 15m R
HOME+1.50%
Everyone’s watching the 4h chart, but the 15m RSI at 65.89 just screamed something about SKYAI they’re ignoring.

$SKYAI /USDT - SHORT

Trade Plan:
Entry: 0.06090 – 0.06152
SL: 0.06414
TP1: 0.05901
TP2: 0.05755
TP3: 0.05535

Why this setup?
- Daily trend is bearish, yet the 15m is overbought—this is the classic “dead cat bounce” setup.
- Entry window is tight: 0.06090–0.06152. We’re sitting right at the edge while TP1 sits 3.6% below.
- With 95% confidence on the short, the risk/reward favors the drop, not the hop.

Debate:
If price rejects 0.06121 twice, do you trust the 95% or fade i
SKYAI+6.39%
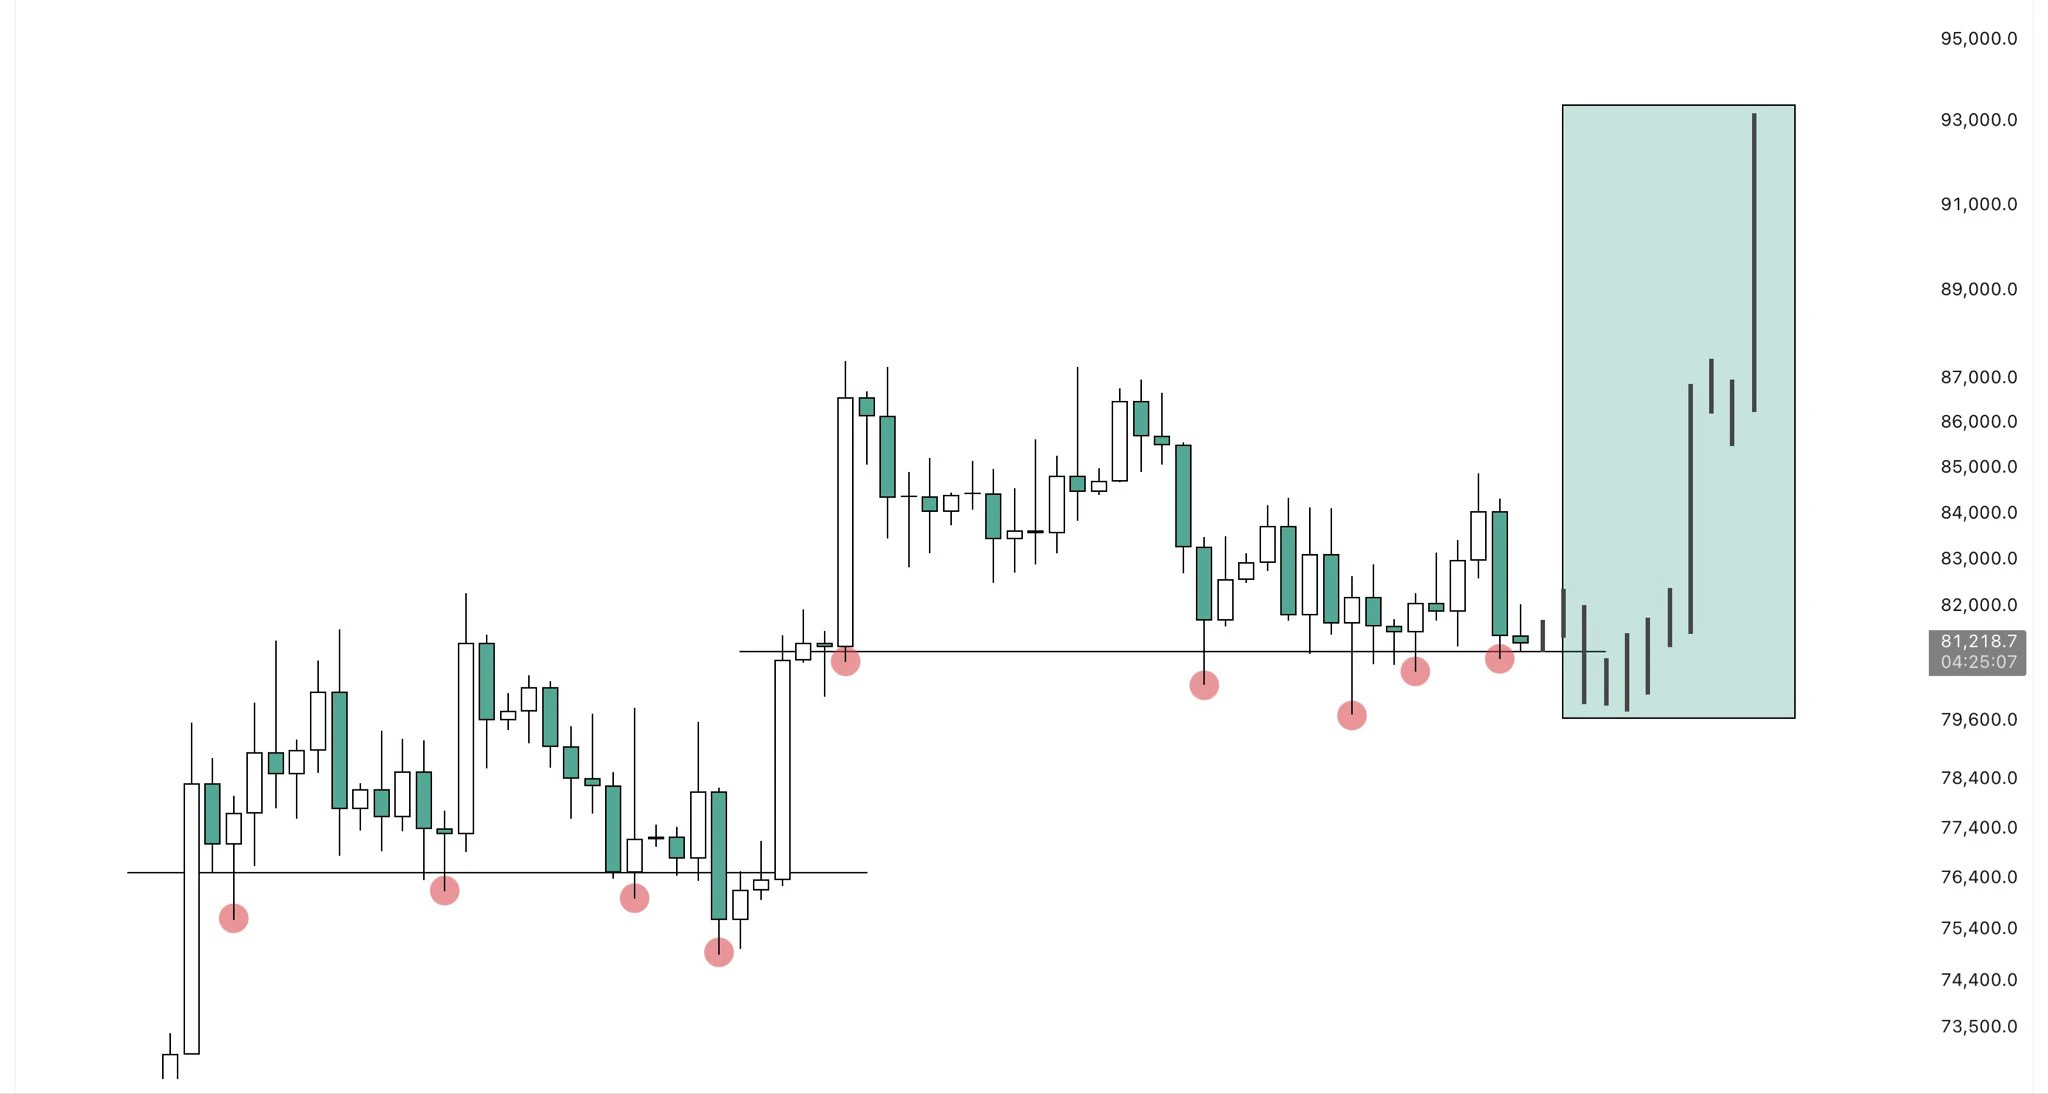
#晒出我的持仓收益 You can enter first, or check yesterday’s post and wait for a wick to enter#BTC收复8万美元
post-image
BTC+0.05%
"I'm once again telling you to buy $URCOIN "
post-image
Let’s just say Robinhood has been good
Wanna give some back to the guys that are here grinding each and every day
Find me them
post-image
HOOD-2.12%
$4 Signal】MACD dual-timeframe expansion, follow long
$4 RSI (4H) 80.32, 1H 77.68; MACD dual-timeframe bars expanding, with price moving along the upper Bollinger Band. The latest 4H candle closed at 0.034113, with aggressive buy orders accounting for 52%. The funding rate is 0.1381%, long position costs remain high, and the order book has not been overwhelmed. Order-book depth imbalance is -0.78%, with slightly greater sell-side depth. Risk-reward ratio 1.5; trade the momentum and do not overstay.
🎯Direction: Long (long)
⚡Entry/limit order: 0.03403459 - 0.03413700
🛑Stop-loss: 0.03379563
🚀T
post-image
4+37.54%
BTC+0.05%
ETH+1.05%
SOL+1.57%
Everyone’s long XLM, but the 4H clock just ticked against the crowd.

$XLM /USDT - SHORT

Trade Plan:
Entry: 0.18373 – 0.18449
SL: 0.18771
TP1: 0.18141
TP2: 0.17960
TP3: 0.17690

Why this setup?
Why now? The range-bound 1D trend is your tell—no momentum to break higher.
- RSI (15m) at 48.2: neutral, giving sellers room to push without overbought friction.
- ATR (1h) at 0.0015: tight volatility—perfect for a clean slide to TP1 (0.18141) and TP2 (0.17960).
- Entry at 0.18411 is armed; invalidation sits at 0.18203, so the risk is defined and tight.

Debate:
Is XLM faking the dip below 0
XLM+2.65%
Everyone’s long ETH here—but the 4h tape is quietly whispering a different name.

$ETH /USDT - SHORT

Trade Plan:
Entry: 2471.39 – 2476.31
SL: 2497.44
TP1: 2456.16
TP2: 2444.36
TP3: 2426.67

Why this setup?
- $ETH /USDT sits at 2473.85, pinned in a 1D range while the 4h bias flips SHORT (conf: 55).
- RSI on 15m is hot at 62—buyers are exhausted, not impulsive.
- ATR 1h at 9.8 means the squeeze is tight; invalidation at 2460.15 is the line in the sand.
- Why now? We’re waiting at entry, but the path of least resistance is down toward TP1 2456, then TP2 2444.

Debate:
If 2460 breaks, d
ETH+1.02%
I don’t have the big-picture view and can’t hold on, but these profits are as thin as paper—and I love it. When I opened the chart this morning, the short position was still alive, and the price once again opened lower at a level that even surprised me a little.
Actually, entering this trade was quite straightforward: when the price rebounded to around 0.015588 a few days ago, there was no follow-through on the upside. It spent two hours grinding without breaking that high, while trading volume kept shrinking. This was an obvious key level; I would have been wasting the opportunity if I hadn’t
post-image
BTC+0.03%
ETH+1.02%
$AKE Signal】Long + Negative Funding Rate Short Squeeze
$AKE Funding rate -0.0437%: shorts are paying to hold positions, order book depth imbalance 8.13%, Bid/Ask 1.18. The 1H candlestick pulled back to EMA20 before bouncing with a lower wick; current price 0.01908 is near the Bollinger middle band. The 4H MACD histogram remains positive, RSI 63, with no signs of overbought conditions.
🎯Direction: Long
⚡Entry/Limit order: 0.0190228 - 0.0190800, current price can be entered directly
🛑Stop-loss: 0.0181260
🚀Target 1: 0.0205110
🚀Target 2: 0.0212265
🛡️Trade management:
- Upon reaching Target 1
post-image
AKE+43.30%
BTC+0.05%
ETH+1.05%
SOL+1.57%
BTC MARKET UPDATE
live-cover
LIVE88
This was purely the market being in a good mood and casually scattering some gold coins, with one happening to land right on my head. During the repeated intraday swings, $XRP fell just short every time it pushed higher. The candlesticks looked limp, but when I looked at the trading volume, buying pressure had actually been quietly strengthening all along. When everyone was afraid to move, I instead felt it was time to act.

The long position signaled at 1.3845 is now at 1.4149, +204.92%. Feeling good, brothers. This kind of bottoming structure tests your patience the most, but as long as you
post-image
XRP+1.09%
BTC+0.03%
ZEC-1.52%
This move doesn't even require me to think—the account is dancing on its own. When the screen was all green, everyone was selling at a loss, but I didn't panic watching the market. It was bottoming without breaking support, while funds quietly entered—the signal worked better than any analysis.

$SNDK $LAB
post-image
SNDK+1.88%
LAB+2.32%
btc market trend
live-cover
LIVE33
Load More

Join 40 M users in our growing community

⚡️ Join 40 M users in the crypto craze discussion

💬 Engage with your favorite top creators

👍 See what interests you

View More