Square
Following
Hot
News
Notifications
Profile
Share your thoughts
placeholder
Article
🔥Today's BTC outlook played out
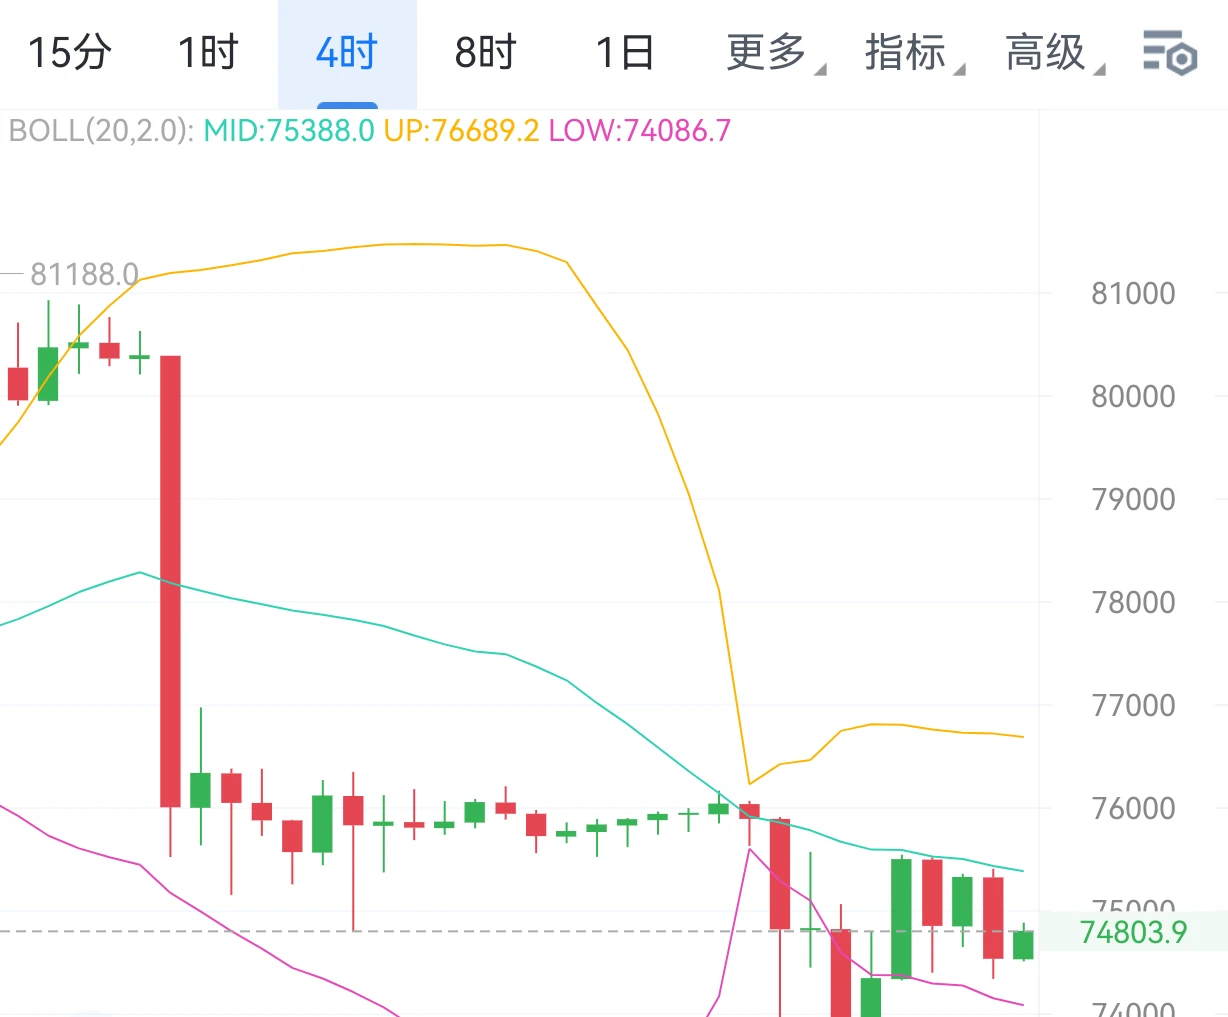
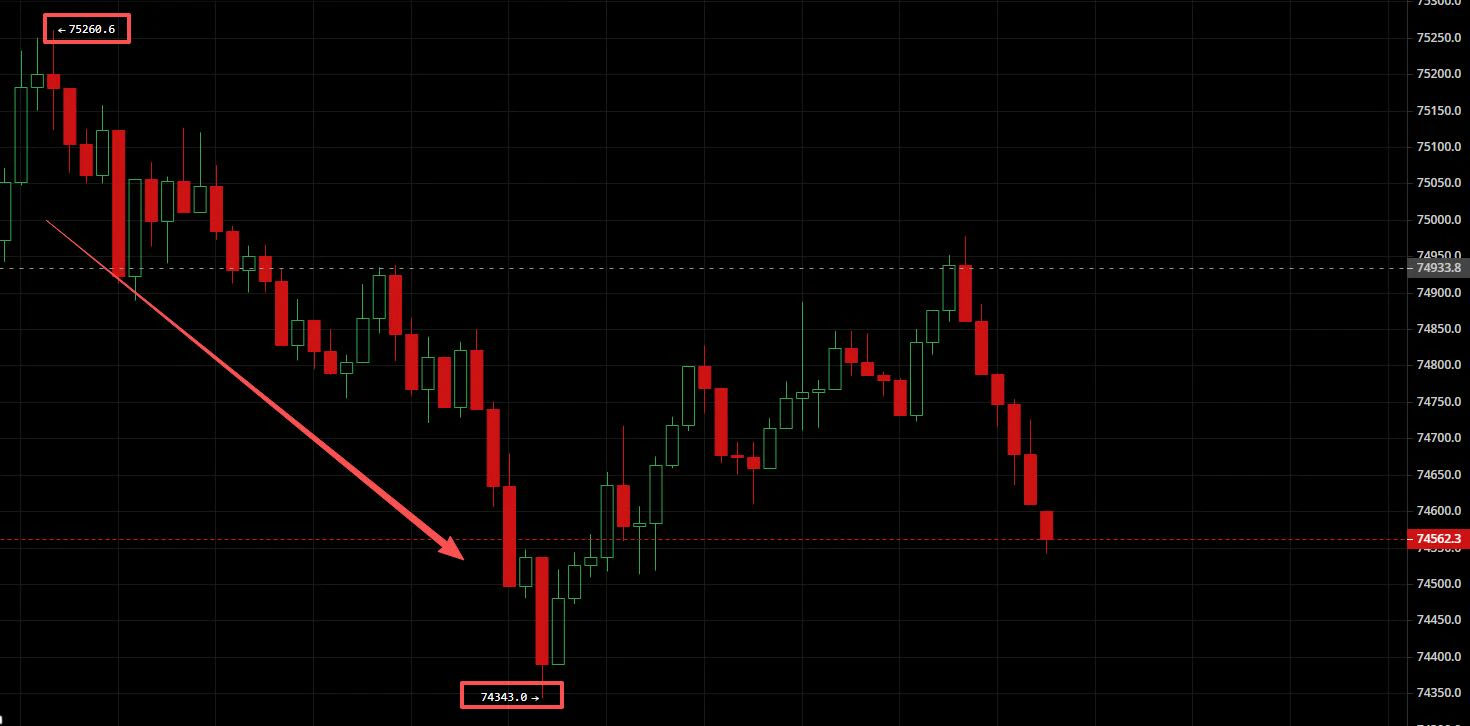
We anticipated resistance around 75400, followed by a pullback after a push higher. The market met resistance precisely at 75411 and fell, breaking straight through the first target of 75000 before extending its decline. We called the direction right.
post-image
YaoYao
Yaoyao | 11.10 BTC outlook
Entry: 75300-75800
Stop-loss: above 75600
Target: 75000

Price attempted to rise for a second time but faced resistance near 75400, failing to break above the previous high of 75547.7. The lower second peak indicates fading bullish momentum;
After the spike, consecutive bearish candles sent prices lower, with selling pressure emerging at the highs—a profit-taking move after the rally;
The market is currently just range-bound, not in a strong one-way uptrend. Price pulled back after facing resistance. As long as it does not decisively break above the previous high, the bearish trading thesis remains valid#BTC闪崩插针

BTC-0.67%
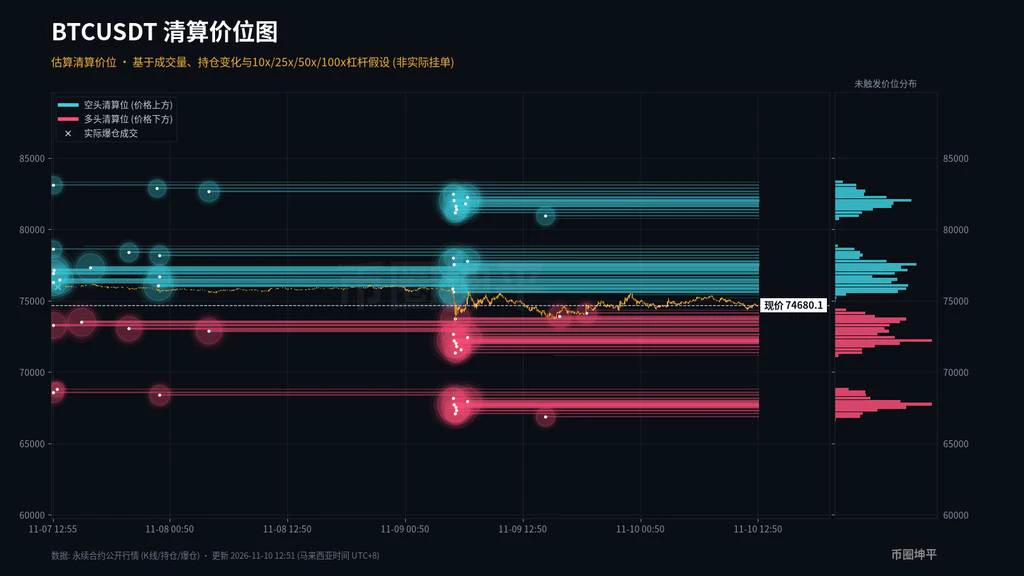
$BTC Still grinding below 75000, with several pushes higher getting stuck near 75400 before pulling back. The current price is around 74700, and today's low touched 73740. Estimated long liquidation levels are densely packed around 72000-73800 below. Above, 75800-78500 is the estimated short liquidation zone, with the largest cluster around 77500. If it can reclaim and hold 75800, I’ll be looking toward 77500; if it breaks below 73700, don’t rush to buy the dip. Which side are you leaning toward here? Share your thoughts.
post-image
BTC-0.67%
Trenches
牛逼
牛
bade
b
牛逼
0x96...7777
Market Cap
$.
Change
.
24h Vol
$.
Holders
.
PIEVERSE
P
bade
b
PIEVERSE
0x0e...25a9
Market Cap
$
Change
.
24h Vol
$.
Holders
.
STONK
S
bade
b
STONK
6GmA...UNgx
Market Cap
$.
Change
.
24h Vol
$.
Holders
.
ON
O
bade
b
ON
0x0e...1d48
Market Cap
$.
Change
.
24h Vol
$.
Holders
.
FLOAT
F
bade
b
FLOAT
Bv1a...BMmr
Market Cap
$.
Change
.
24h Vol
$.
Holders
.
A love story of 1500 beneath the Eiffel Tower at The Parisian Macao
post-image
This guy lost a lot of money on $CASHCAT and decided to hijack a new launchpad today.
The people who created $MANTRA ran CASHCAT and he sniped 13% of supply to hold hostage.
This is crazy. Bro can nuke the chart anytime he wants.
post-image
CASHCAT-0.08%
MANTRA-1.61%
market updates
live-cover
LIVE2,097
$AVAX MACD is about to cross bullish on the daily and higher timeframes.
This doesn't mean the price will start moving up today or tomorrow. It suggests momentum may be shifting towards an uptrend.
$NVDA $AMD #SOL #SUI #CRYPTO #STOCKS
AVAX-0.10%
NVDA-4.34%
AMD+13.35%
SOL-0.77%
SUI-1.05%
Is the BTC Rebound Just an Illusion?
live-cover
LIVE1,431
Tesla sold just 8,817 cars in China in October.
Data released by the China Passenger Car Association on November 9 showed a 66.1% year-over-year plunge, down 86.4% from September. It was the worst month since July 2022 and the first time in more than three years that sales fell below 10k. This marks the fifth consecutive month of year-over-year declines, with its share of new energy vehicle retail sales falling from 5.98% in September to 0.80%.
Wholesale deliveries from the Shanghai factory rose 10.3% to 67,829 in October, but 59,012 were shipped overseas. Exports accounted for a record 87%, l
post-image
TSLA+5.53%
You Probably Make Predictions Every Day Without Even Thinking About It.
You call the winner before a football match kicks off. You have an opinion about where Bitcoin is heading. You see a major announcement and start thinking about what happens next.
Everyone has these opinions. The interesting part is what happens when you put your conviction to the test.
That is what draws me to prediction markets.
Instead of endlessly debating what might happen, you can find a market around that event, look at what other participants are pricing in, form your own view and take a position.
And there is alwa
post-image
BTC-0.67%
Those who bought GTA6 can already pre-download it···
Looks like it won’t be delayed again this time, so we can play as soon as next Thursday···
My cat and I are both really looking forward to seeing just how fun GTA, which is said to once again shatter expectations, will be.
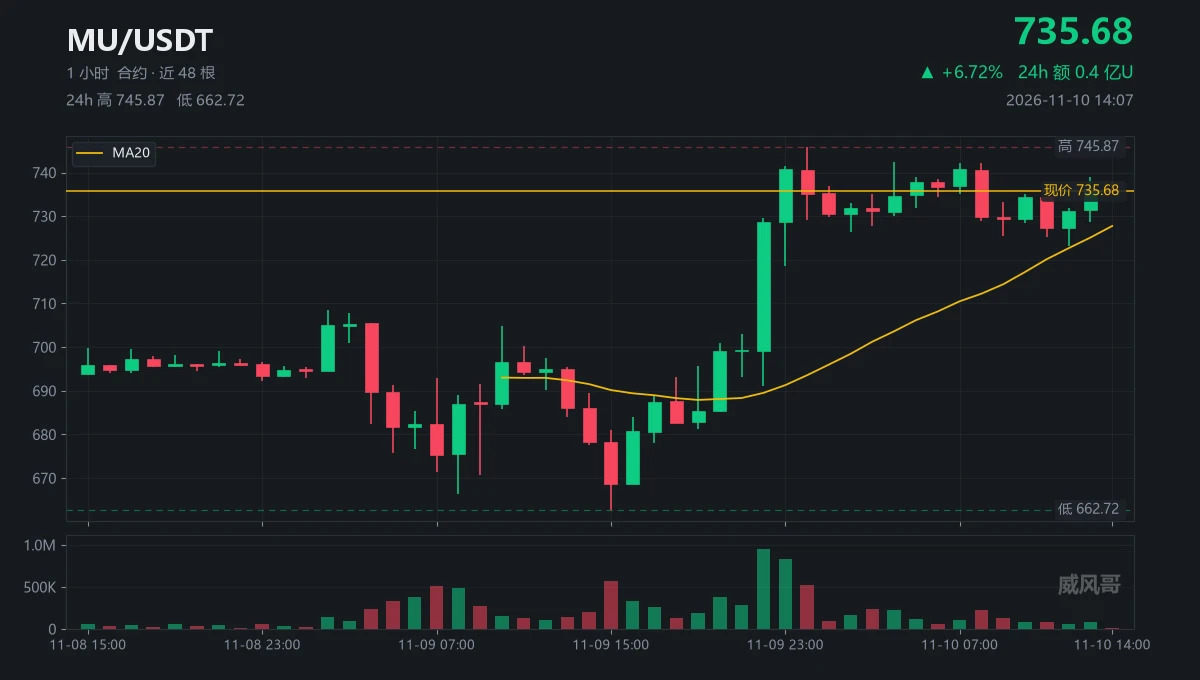
At 8 a.m., I wrote that it was up 8.5 points; now it’s up 7.5. Same stock, different numbers.
Three hours | Fourteen hours
2.299 million shares | 1.697 million shares
699.12 to 745.87 | 745.87 to 735.68
+6.7% | -1.4%
The fourteen hours on the right used 74% of the volume on the left
Yet the price didn’t even come close to 745.87 again, topping out at just 742.46
$MU is now at 734.91, the chart closed at 735.68, with MA20 at 727.76 providing support
24-hour volume: 43.73 million U, among the heaviest for this batch of stock tokens
I’m only doing one thing: waiting for it to return near 727.76
post-image
MU-0.63%
My girlfriend was clubbing until the early hours of the morning, and her legs were completely clear when she got home.
But when she woke up, these weird lines had suddenly appeared...
What on earth are they? How did they get there?
The journey of love starts here🐶🐶🐶
Nov 10 $BTC Analysis
Although recent news has been broadly bearish, the market’s reaction to negative news is changing, creating conditions for a rebound:
· ETF outflow pressure has been partly absorbed: Although spot BTC ETFs have recently recorded net outflows, the price has not collapsed and instead found support above 73,000. This usually means selling pressure may have been absorbed by the market. If outflows slow or turn into inflows, the rebound could gain strength.
· Political uncertainty has been resolved: After the U.S. midterm election results became clear, concerns about tighter r
post-image
BTC-1.31%
ETH-1.26%
$ARIA This 25.1M in trading volume drove a 28% 24-hour swing, and the buying sweep from 0.15 to 0.1921 isn't something retail traders can pull off. At 0.1850, price is holding above the previous high of 0.178, with volume and price rising together and no divergence—the breakout structure is confirmed. The order book shows dense buy orders supporting price around 0.18; if the pullback holds above 0.175, that's a second entry point. Trading plan: take a small position at the current price or around 0.185–0.188, place a stop-loss below 0.172 (admit you're wrong if it breaks below the previous hig
ARIA+22.03%
When the market is bleak, go level yourself up!
Leg press 80kg for sets (~1.23x my body weight)
post-image
$XMR ‌ UNDER PRESSURE: HEAVY DISTRIBUTION SIGNALS A FURTHER DROP. 🩸

Do not ignore the red flags on Monero right now. The asset is bleeding at $561.9 after a sharp -5.74% drop, and the overall Market Structure has firmly flipped to Bearish. The big players are exiting their positions fast.

Here is the exact breakdown of the current situation:

📊 The Market Overview:

· Market Cap: $10.58B
· Volume Change: 1% of Mkt Cap
· Open Interest (OI) Change: -3.7%
· Funding Rate: -1.0000% (Long/Short ratio is 0.71x)
· Volatility Score: 30/100
· Liquidity Score: 67/100

🐋 Whale & Maker Activity:

· W
XMR-3.39%
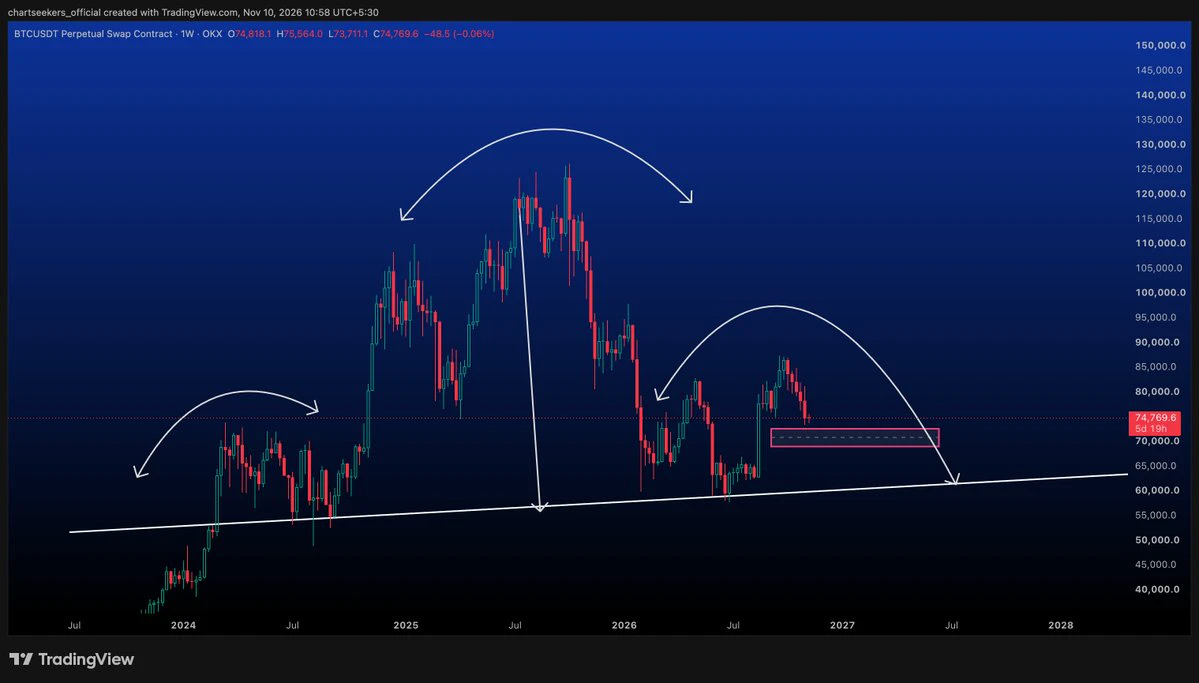
$BTC
which pattern is this comment below
post-image
BTC-1.31%
$KORU Kou Rou keeps going long! The rebound is very strong! I noticed something: the people who commented under my post a couple of days ago saying it couldn't rebound and was going to crash have disappeared 🤪🤪🤪🤪
post-image
KORU-1.22%
What Are Long Squeezes and Short Squeezes? Why Can Concentrated Positions Amplify Price Volatility?

In the cryptocurrency market, prices can sometimes surge or plunge suddenly over a short period, with sharp volatility even when there is no obvious new news. One reason behind this is that concentrated leveraged positions can trigger consecutive position closures or forced liquidations when prices move.

First, what is a short squeeze?

When many traders hold short positions, a sudden price increase may force some of them to buy to close their positions, while leveraged positions may also trig
post-image
Load More

Join 40 M users in our growing community

⚡️ Join 40 M users in the crypto craze discussion

💬 Engage with your favorite top creators

👍 See what interests you

Trending Topics

USCPIDataIncoming

50.73k Views2.22k Discussing

The U.S. October CPI report will be released on November 10 at 8:30 a.m. ET. September CPI came in at 3.7% year over year, and markets will be watching closely for signs that inflation is cooling, especially in core CPI. A softer-than-expected reading could strengthen rate-cut expectations, while hotter inflation may pressure risk assets through higher Treasury yields and a stronger dollar. How do you think this CPI print will move $BTC, U.S. stocks and gold?

USIranTalksShowNewProgress

7.1k Views1.25k Discussing

KoreanStocksJumpOver5%

3.04k Views4.84k Discussing

View More