Square
Following
Hot
News
Notifications
Profile
Share your thoughts
placeholder
Article
#GateOctoberTransparencyReport #ShareWeekly
Gate’s October Transparency Report stands as another powerful demonstration of how the platform continues to set the standard for security, growth, and genuine innovation in the global digital finance space. The numbers speak with clarity and strength. Total reserves climbed to an impressive $8.688 billion, representing a solid 5.7 percent increase from the prior reporting period. Against customer net assets of $7.332 billion, the overall reserve ratio reached 118.49 percent, improving from the previous 117.26 percent and remaining comfortably above
BTC-0.67%
ETH-1.26%
USD1+0.00%
GUSD+0.00%
USDC+0.01%
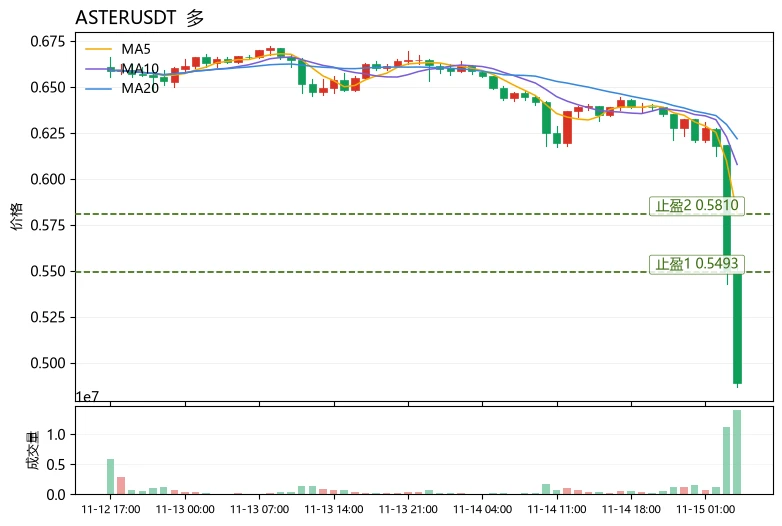
$ASTER Current price: 0.4884, below the lower Bollinger Band at 0.5493. The first resistance on a rebound is 0.5493, with support around 0.45 below. These two levels are highlighted because the current price is trading outside the Bollinger Bands, an extremely deviated state. Chasing shorts offers poor risk-reward, while longs require structural confirmation.
As a reusable chart-reading method, first assess whether the trend is healthy by checking the moving-average alignment: MA5=0.58104 is below MA20=0.621785, the moving averages are bearishly aligned, and the price is far below MA5. This i
post-image
ASTER-0.07%
HYPE+0.24%
ENA+8.04%
Trenches
mihao
m
bade
b
mihao
4Cxj...pump
Market Cap
$.
Change
.
24h Vol
$.
Holders
.
Snoopy
S
bade
b
Snoopy
7mEh...47Cn
Market Cap
$.
Change
.
24h Vol
$.
Holders
.
NIO
N
bade
b
NIO
7SL2...pump
Market Cap
$.
Change
.
24h Vol
$.
Holders
.
AGT
A
bade
b
AGT
0x5d...e274
Market Cap
$.
Change
.
24h Vol
$.
Holders
.
SWJ
S
bade
b
SWJ
BDDd...pump
Market Cap
$.
Change
.
24h Vol
$.
Holders
.
Look at the current market conditions. Major crashes are happening, and many traders are facing huge losses.
But the traders who are properly following the strategies I've shared are still making solid profits.
Whether it's my indicators, re-entry strategy, or level trading, those who understand and follow these methods are getting impressive results, even in these market conditions. Many of them are DMing me and sharing their results.
Everything I've shared is designed to work across different market conditions, whether bullish or bearish, during major crashes or massive pumps.
If you follow
post-image
More than $150 billion and nearly 11 million transactions moved through Fireblocks on weekends in the year to June 2026.
Its November 11 update puts a number on demand outside bank hours as it explores connecting Standard Chartered's tokenized deposits.
@FireblocksHQ
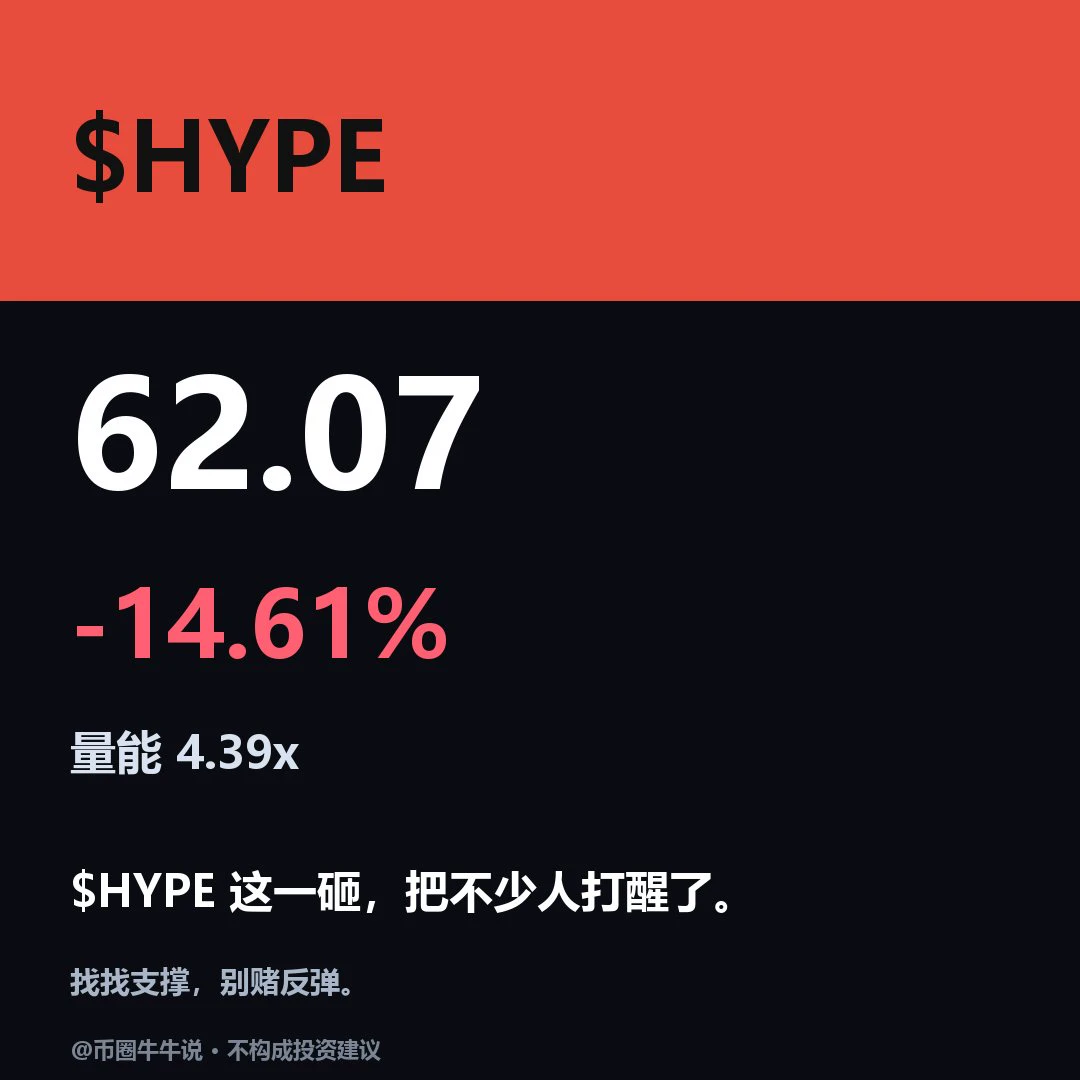
$HYPE Currently at 62.07, down 14.6% over 24H. The 1H trend is weak, with an RSI of 11.5 (oversold) and EMA20 at 67.2; the 4H trend is also weak, with an RSI of 29.6 and EMA20 at 69.9. Resistance is at 72.53/75.35, with support at 60.03. Volume is 4.4x the average. The 1H moving averages have crossed below, while the 4H moving averages remain above. If price holds above 72.53, watch for a rebound; if it breaks below 60.03 and fails to recover, weakness may persist. In the next review, watch whether 72.53 holds and whether price recovers after losing 60.03. Market volatility is high; for observ
post-image
HYPE+0.24%
[NEW STREAMER]market update
live-cover
LIVE316
On the 4-hour chart, short $UNI at 4.734–4.772. Sellers need this zone. I’m waiting for price to push higher, leave an upper wick, and stall; I won’t chase. The daily chart is range-bound, so I’ll keep the position very small. If the close is above 5.02, I’ll abandon this trade. Short 4.734–4.772; take-profit targets: 4.591 / 4.482 / 4.320; stop loss: 5.02. On the 4-hour chart, the price is at 4.75, still below the EMA50 at 6.25, so sellers remain in control of the trend. The daily chart is below the EMA200 at 5.60, and the higher-timeframe charts also support this view. The stop-loss distanc
post-image
UNI+3.05%
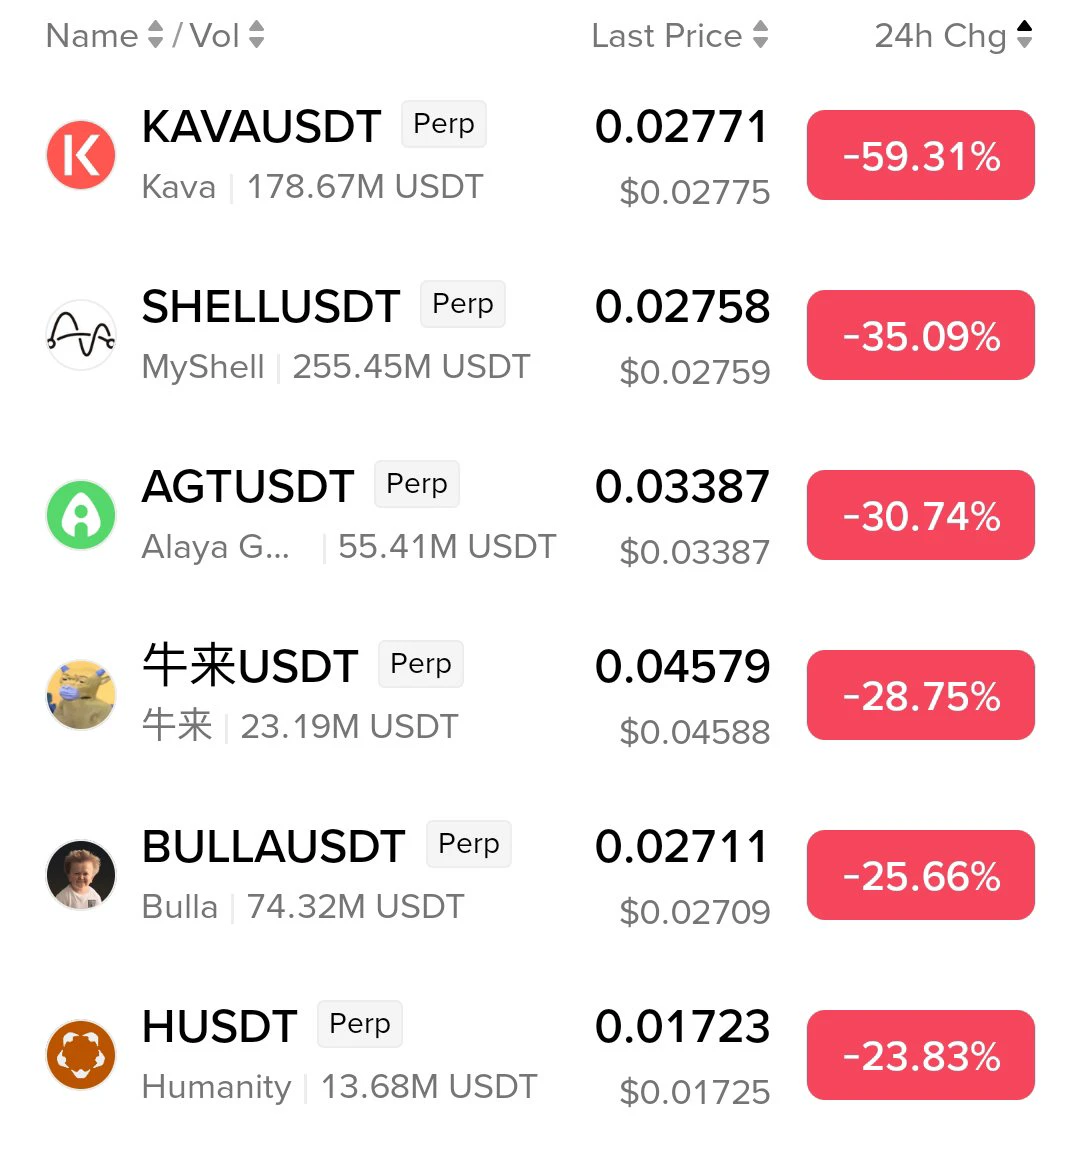
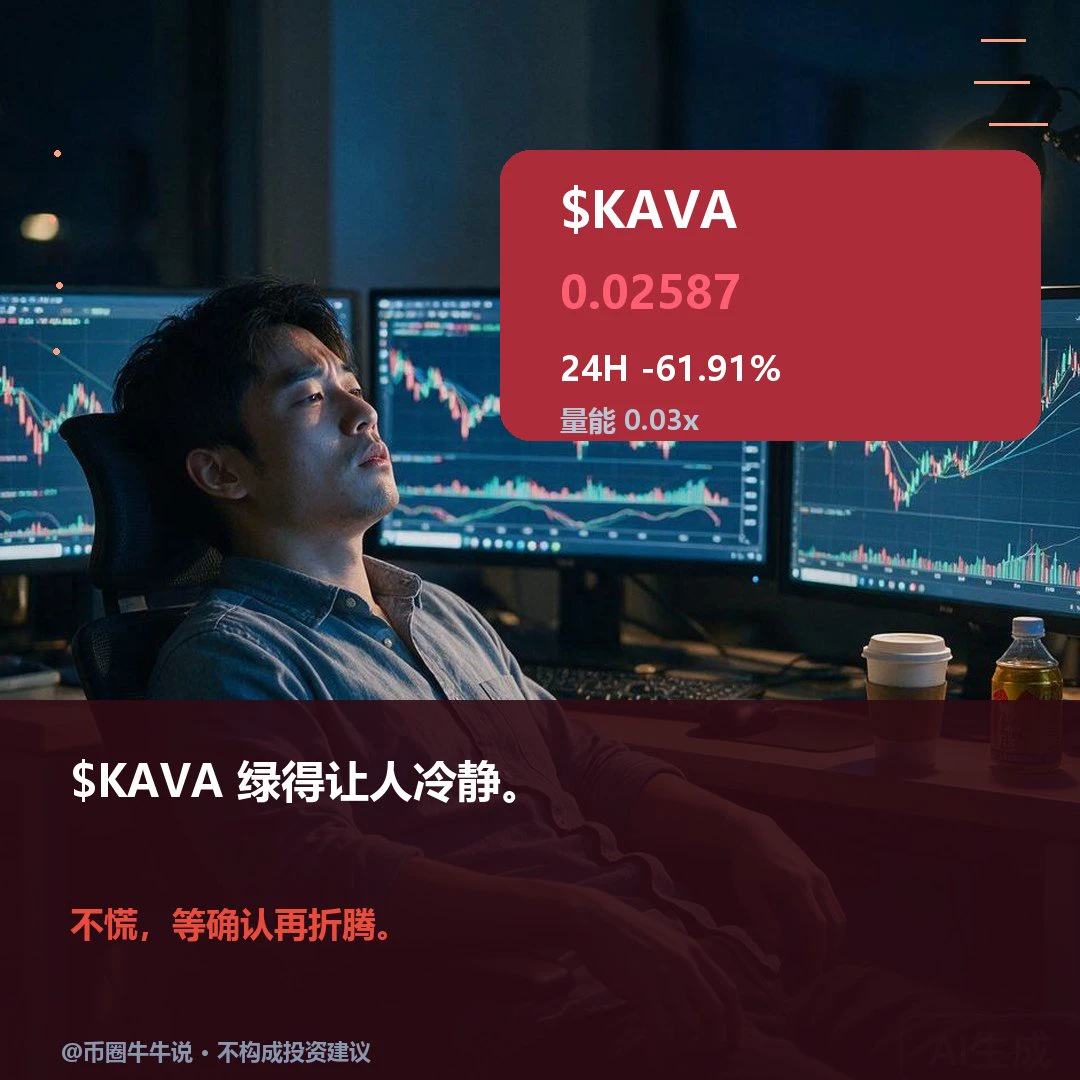
kava:native is currently trading at 0.02587, down 61.9% over 24 hours. The 1H and 4H charts are both weak, with RSI at 12.1/3.8, indicating extremely oversold conditions. EMA20 is at 0.0411/0.0558, and the price is far below the moving averages. Resistance is at 0.06874/0.06888, with support at 0.0251. Volume is only 0.03x the average, so any breakout needs confirmation from increased participation. If the price holds above 0.06874, a rebound can be monitored; if it breaks below 0.0251 and fails to recover, the downtrend may continue. In a follow-up review, check whether the price can hold abo
post-image
KAVA-0.56%
$USELESS Down 23.89% in 24 hours, now at $0.0979, just a breath away from the low of $0.0976—this isn’t a pullback, it’s a long-squeeze meat grinder. With $31.8M in trading volume and a -23.89% drop, on-chain data shows selling pressure concentrated during Asian trading hours. BTC is moving sideways and sucking up liquidity, Fed rate-cut expectations keep shifting, and the meme sector is bleeding across the board, with USELESS taking the hit first and becoming an ATM for sellers. Technically, $0.0976 is the last line of defense; a break below it points straight to $0.085. Overhead, $0.11 is a
USELESS-14.68%
BTC-0.67%
MEME-0.94%
  • 2
ICP canister memory usage reached 12,528,256,551,052 bytes on November 11, up 14.35% in 30 days.
That compares with 10,955,813,953,913 bytes on October 12. The measure tracks software memory, rather than customer data-storage demand.
@dfinity @dominic_w
ICP-1.14%
#BitcoinDropsBelow$70K #ShareWeekly
Bitcoin has recently slipped below the psychologically important 70000 dollar mark, trading in the mid to upper 66000 range after a multi week correction that has erased a substantial portion of earlier gains. This move represents a clear break of a key round number that many market participants had viewed as short term support. Bitcoin remains the dominant cryptocurrency by market capitalization, still accounting for the majority of total crypto market value even as prices have declined. The drop below 70000 dollars is not an isolated event but part of a b
Bitcoin's options market is set up to make every move bigger right now.
Greeks Live data shows market makers sitting in negative gamma from roughly $58K all the way up to $72K.
In plain English, guys. When price drops, their hedging means they sell. When price rises, they buy. They add fuel in whichever direction we go.
That flips back somewhere around $73K.
So which direction gets the first real push?
post-image
BTC-0.65%
Bilibili’s two-year membership card just dropped from 776 yuan to 248 yuan, but recharging requires linking a phone number—it doesn’t support third-party accounts or international numbers.
The price has plummeted, but users are still trapped in a phone-number-binding cage. This promo is more frustratingly convoluted than being a wage slave.
$BTC
post-image
BTC-0.67%
$PENGU Down 23% in 24 hours, currently at 0.0047, with a low of 0.0046 already hit—just 0.0001 above the 24-hour low. This isn't a pullback; it's a panic-driven sell-off. 83M in trading volume shows panic selling changing hands at higher volume. Nearly a quarter of the market cap has vanished from the 24-hour high of 0.0061. Every wick you see now is someone selling at a loss—and someone else catching a falling knife.
Time anchor: We’re now in the first 4-hour window after the crash for watching a potential stabilization signal. The next 6–12 hours will determine whether this is a “stop-hunt w
PENGU+0.40%
  • 2
  • 1
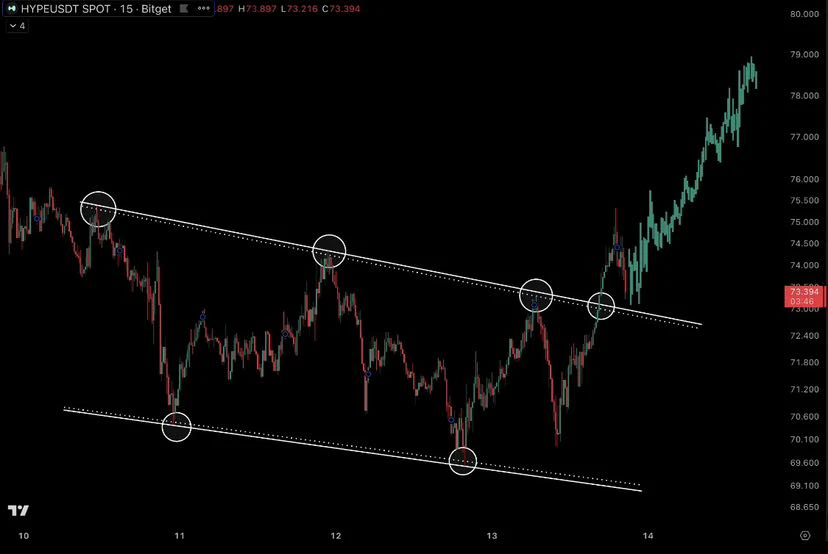
$HYPE is getting up an interesting move rn

This descending channel is finally giving way, and price is attempting to establish itself above the previous resistance

$76 is the next level on my radar

A clean continuation could open the door towards $78–$79

But if price falls back inside the channel, bulls need to be careful
post-image
HYPE+0.24%
  • 1
  • 2
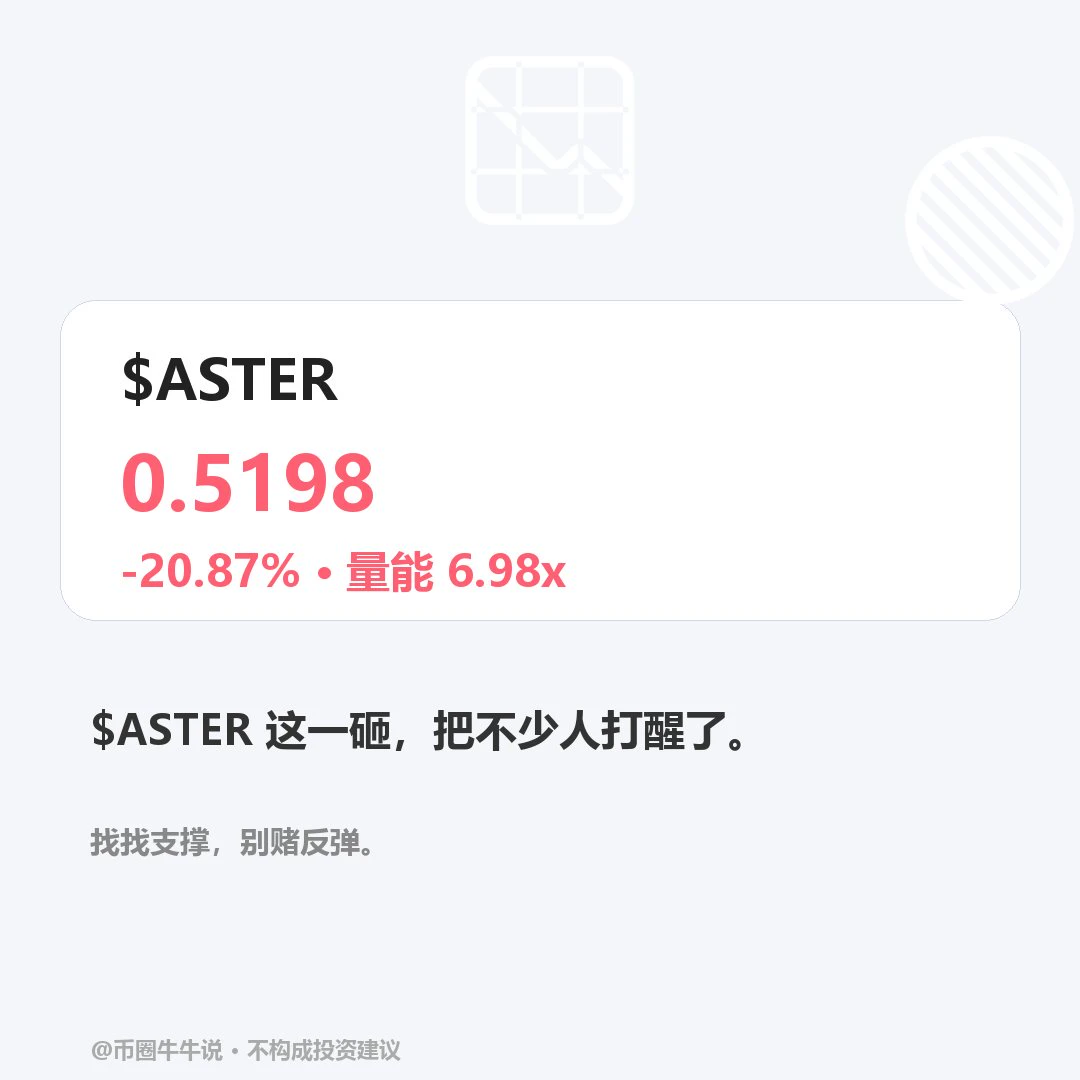
$ASTER Currently trading at 0.5198, down 20.87% over 24H (range: 0.5173–0.6572). The 1H trend is weak, with an RSI of 12; the 4H trend is weak, with an RSI of 19. If it breaks above 0.6561 decisively, the upside potential can be monitored. If it falls below the 0.5173 support, the short-term structure may weaken. Market volatility is high; for observation only.
post-image
ASTER-0.07%
If you're not in a short...what are you doing?
post-image
[New Streamer] Market Updates
live-cover
LIVE11
Load More

Join 40 M users in our growing community

⚡️ Join 40 M users in the crypto craze discussion

💬 Engage with your favorite top creators

👍 See what interests you

Trending Topics

GateIPOAccessAnthropic

328.2K Views2.9K Discussing

Gate IPO Access Phase 3 features Anthropic (ANT), with USDT subscription interest starting from 100 USDT. Successful allocations will be delivered as real shares to Gate Stock Accounts. Indicative price: $70–$78/share Subscription: Nov 12–17 (UTC+8) Allocation is not guaranteed. Please manage risk accordingly.

Dr.HanOxfordUnionSpeech

149.1K Views663 Discussing

USOctoberPPIBelowExpectations

471K Views1.6K Discussing

View More