
Square
Following
Hot
News
Notifications
Profile
Share your thoughts
placeholder
Article
Beware of financial fraud by Anthropic next year
ANT-8.68%
  • 1
#晒出我的持仓收益 The outcome of chasing longs—not sure if there's a chance to break even
post-image
PIEVERSE+0.50%
  • 2
Trenches
IDOL
I
bade
b
IDOL
0x3b...ab07
Market Cap
$.
Change
.
24h Vol
$.
Holders
.
PIEVERSE
P
bade
b
PIEVERSE
0x0e...25a9
Market Cap
$.
Change
.
24h Vol
$.
Holders
.
JAGENT
J
bade
b
JAGENT
0x8e...ae15
Market Cap
$.
Change
.
24h Vol
$.
Holders
.
Singularity
S
bade
b
Singularity
7R4M...pump
Market Cap
$.
Change
.
24h Vol
$.
Holders
.
mihao
m
bade
b
mihao
4Cxj...pump
Market Cap
$.
Change
.
24h Vol
$.
Holders
.
[NEW STREAMER]market update
live-cover
LIVE3,398
BTC-0.67%
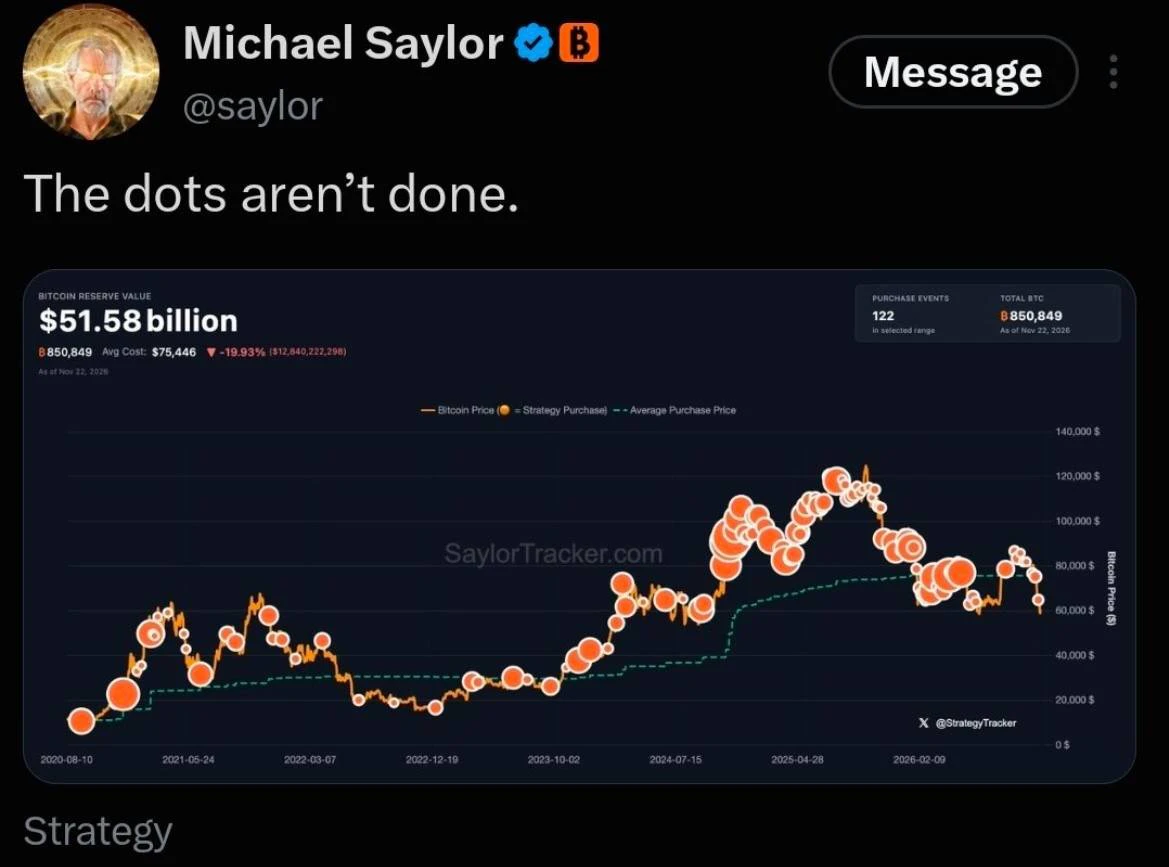
🟠 MICHAEL SAYLOR HINTS AT ANOTHER $BTC UPDATE!
“The dots aren’t done.”
Another Bitcoin announcement coming tomorrow?
post-image
BTC-0.67%
#BTCReboundFaces60KTest #ShareWeekly

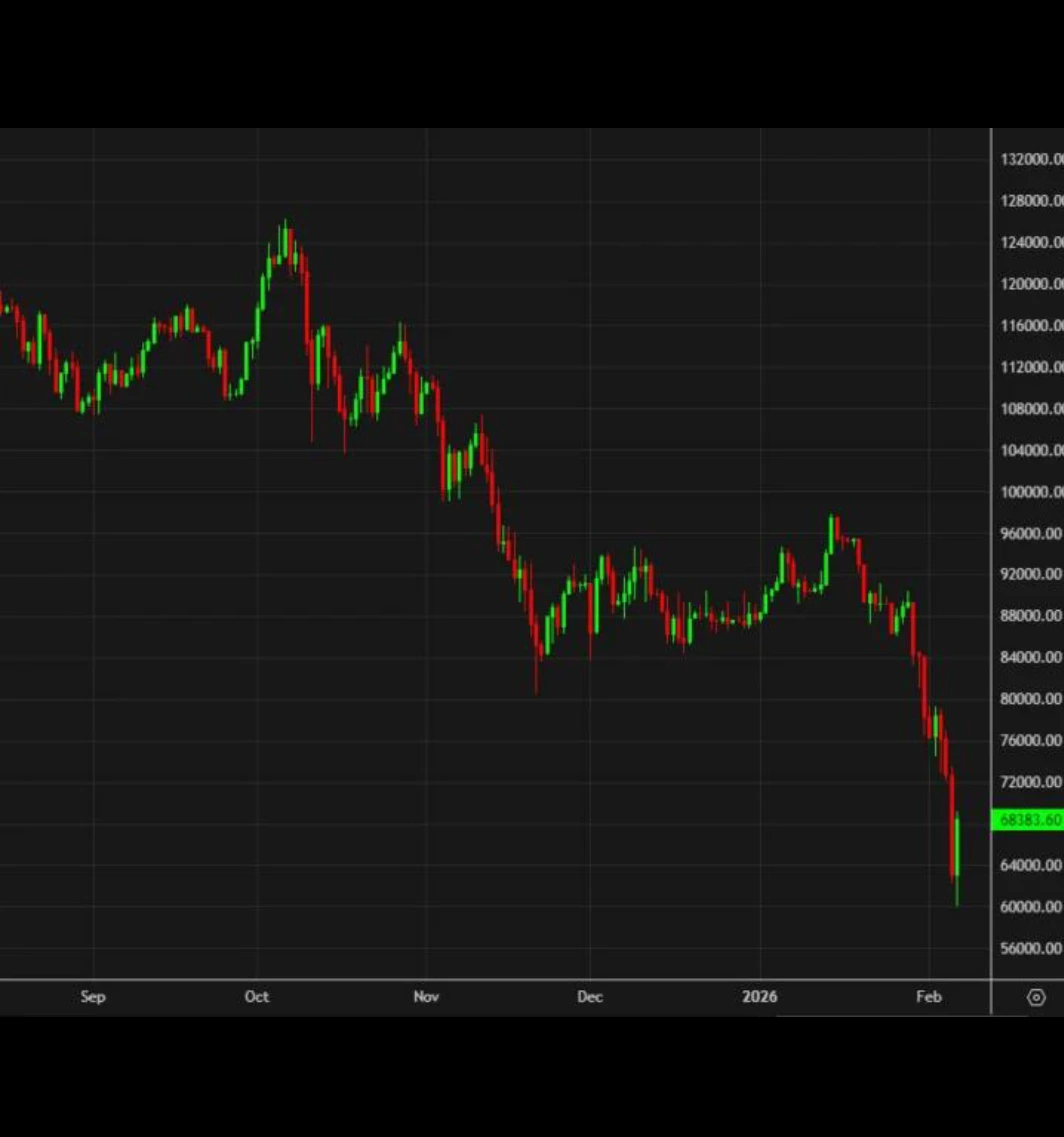
BITCOIN RECOVERS TO $60,750 AFTER BREAKING BELOW $60,000: IS THIS THE START OF A STRONGER BOUNCE OR JUST A TEMPORARY RELIEF RALLY?

Bitcoin is sending an interesting signal to the market. After briefly falling below the psychologically important $60,000 threshold, BTC has recovered to approximately $60,750, bringing fresh attention to the battle between buyers and sellers. This recovery is important because it shows that buyers are still willing to enter the market when prices move lower. However, the bigger question is whether this rebound has enough str
BTC-0.67%
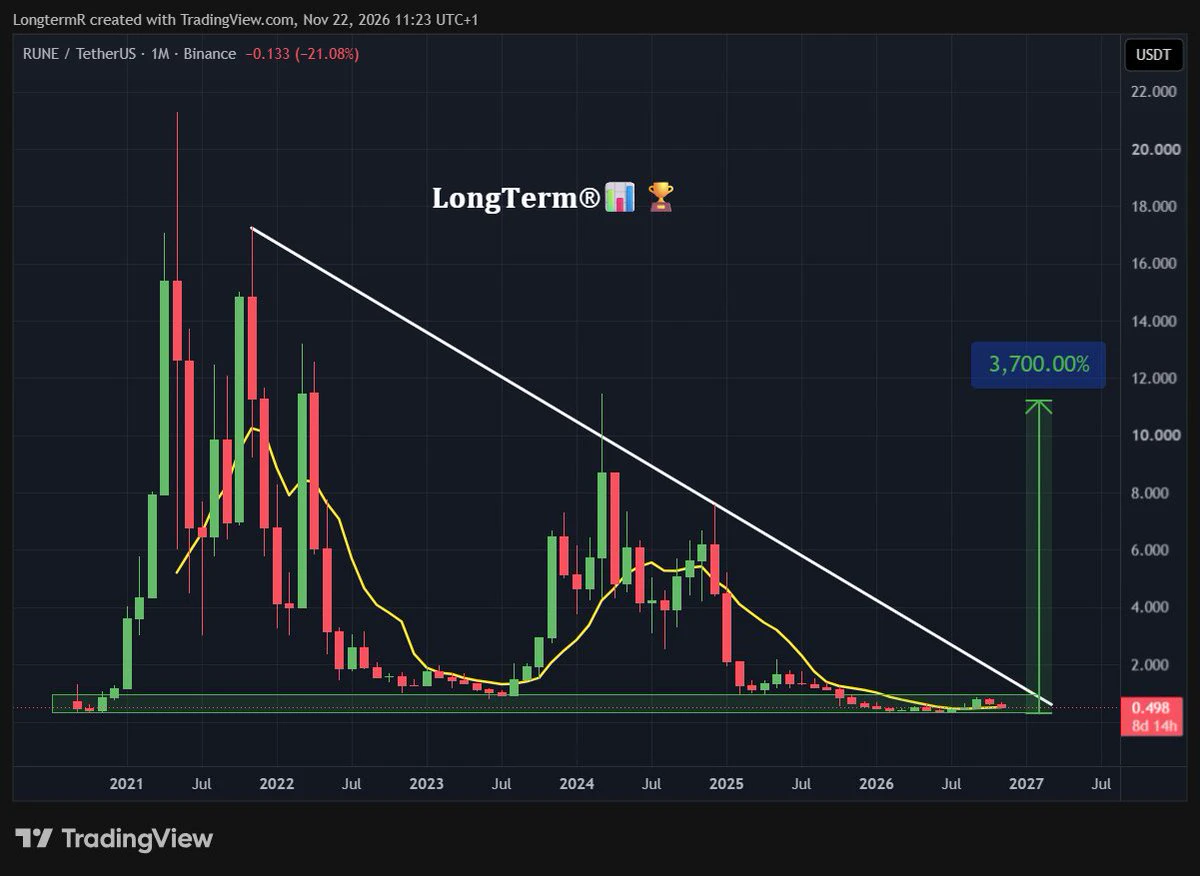
$RUNE added native Monero and Zcash swaps in August, no wrapped tokens involved.
Swap fees came in around $5.8M in Q3, almost double Q2.
Price is back in the same zone it accumulated in back in 2020 🤝
post-image
RUNE-0.11%
XMR+0.00%
ZEC+1.16%
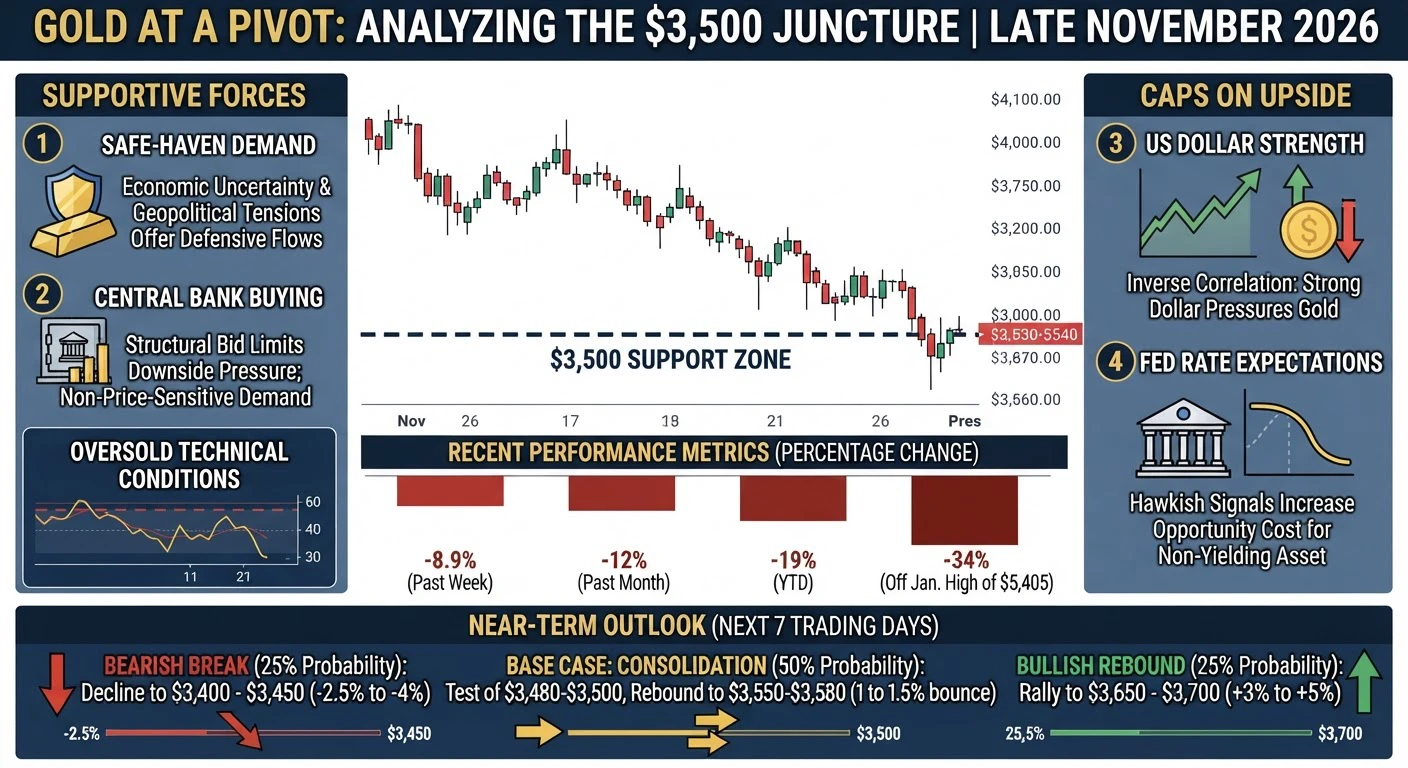
#GoldNears3500 #ShareWeekly
Gold stands at a pivotal psychological and technical juncture near the $3,500 per ounce level as of late November 2026, with the spot price hovering in the $3,530 to $3,540 range after a sharp multi-week decline. This area has become the focal point of intense market discussion, as the metal has already shed roughly 8.9 percent over the past week and approximately 12 percent over the past month, while sitting nearly 19 percent lower year-to-date and more than 34 percent below its all-time closing high near $5,405 recorded in late January 2026. The question dominati
post-image
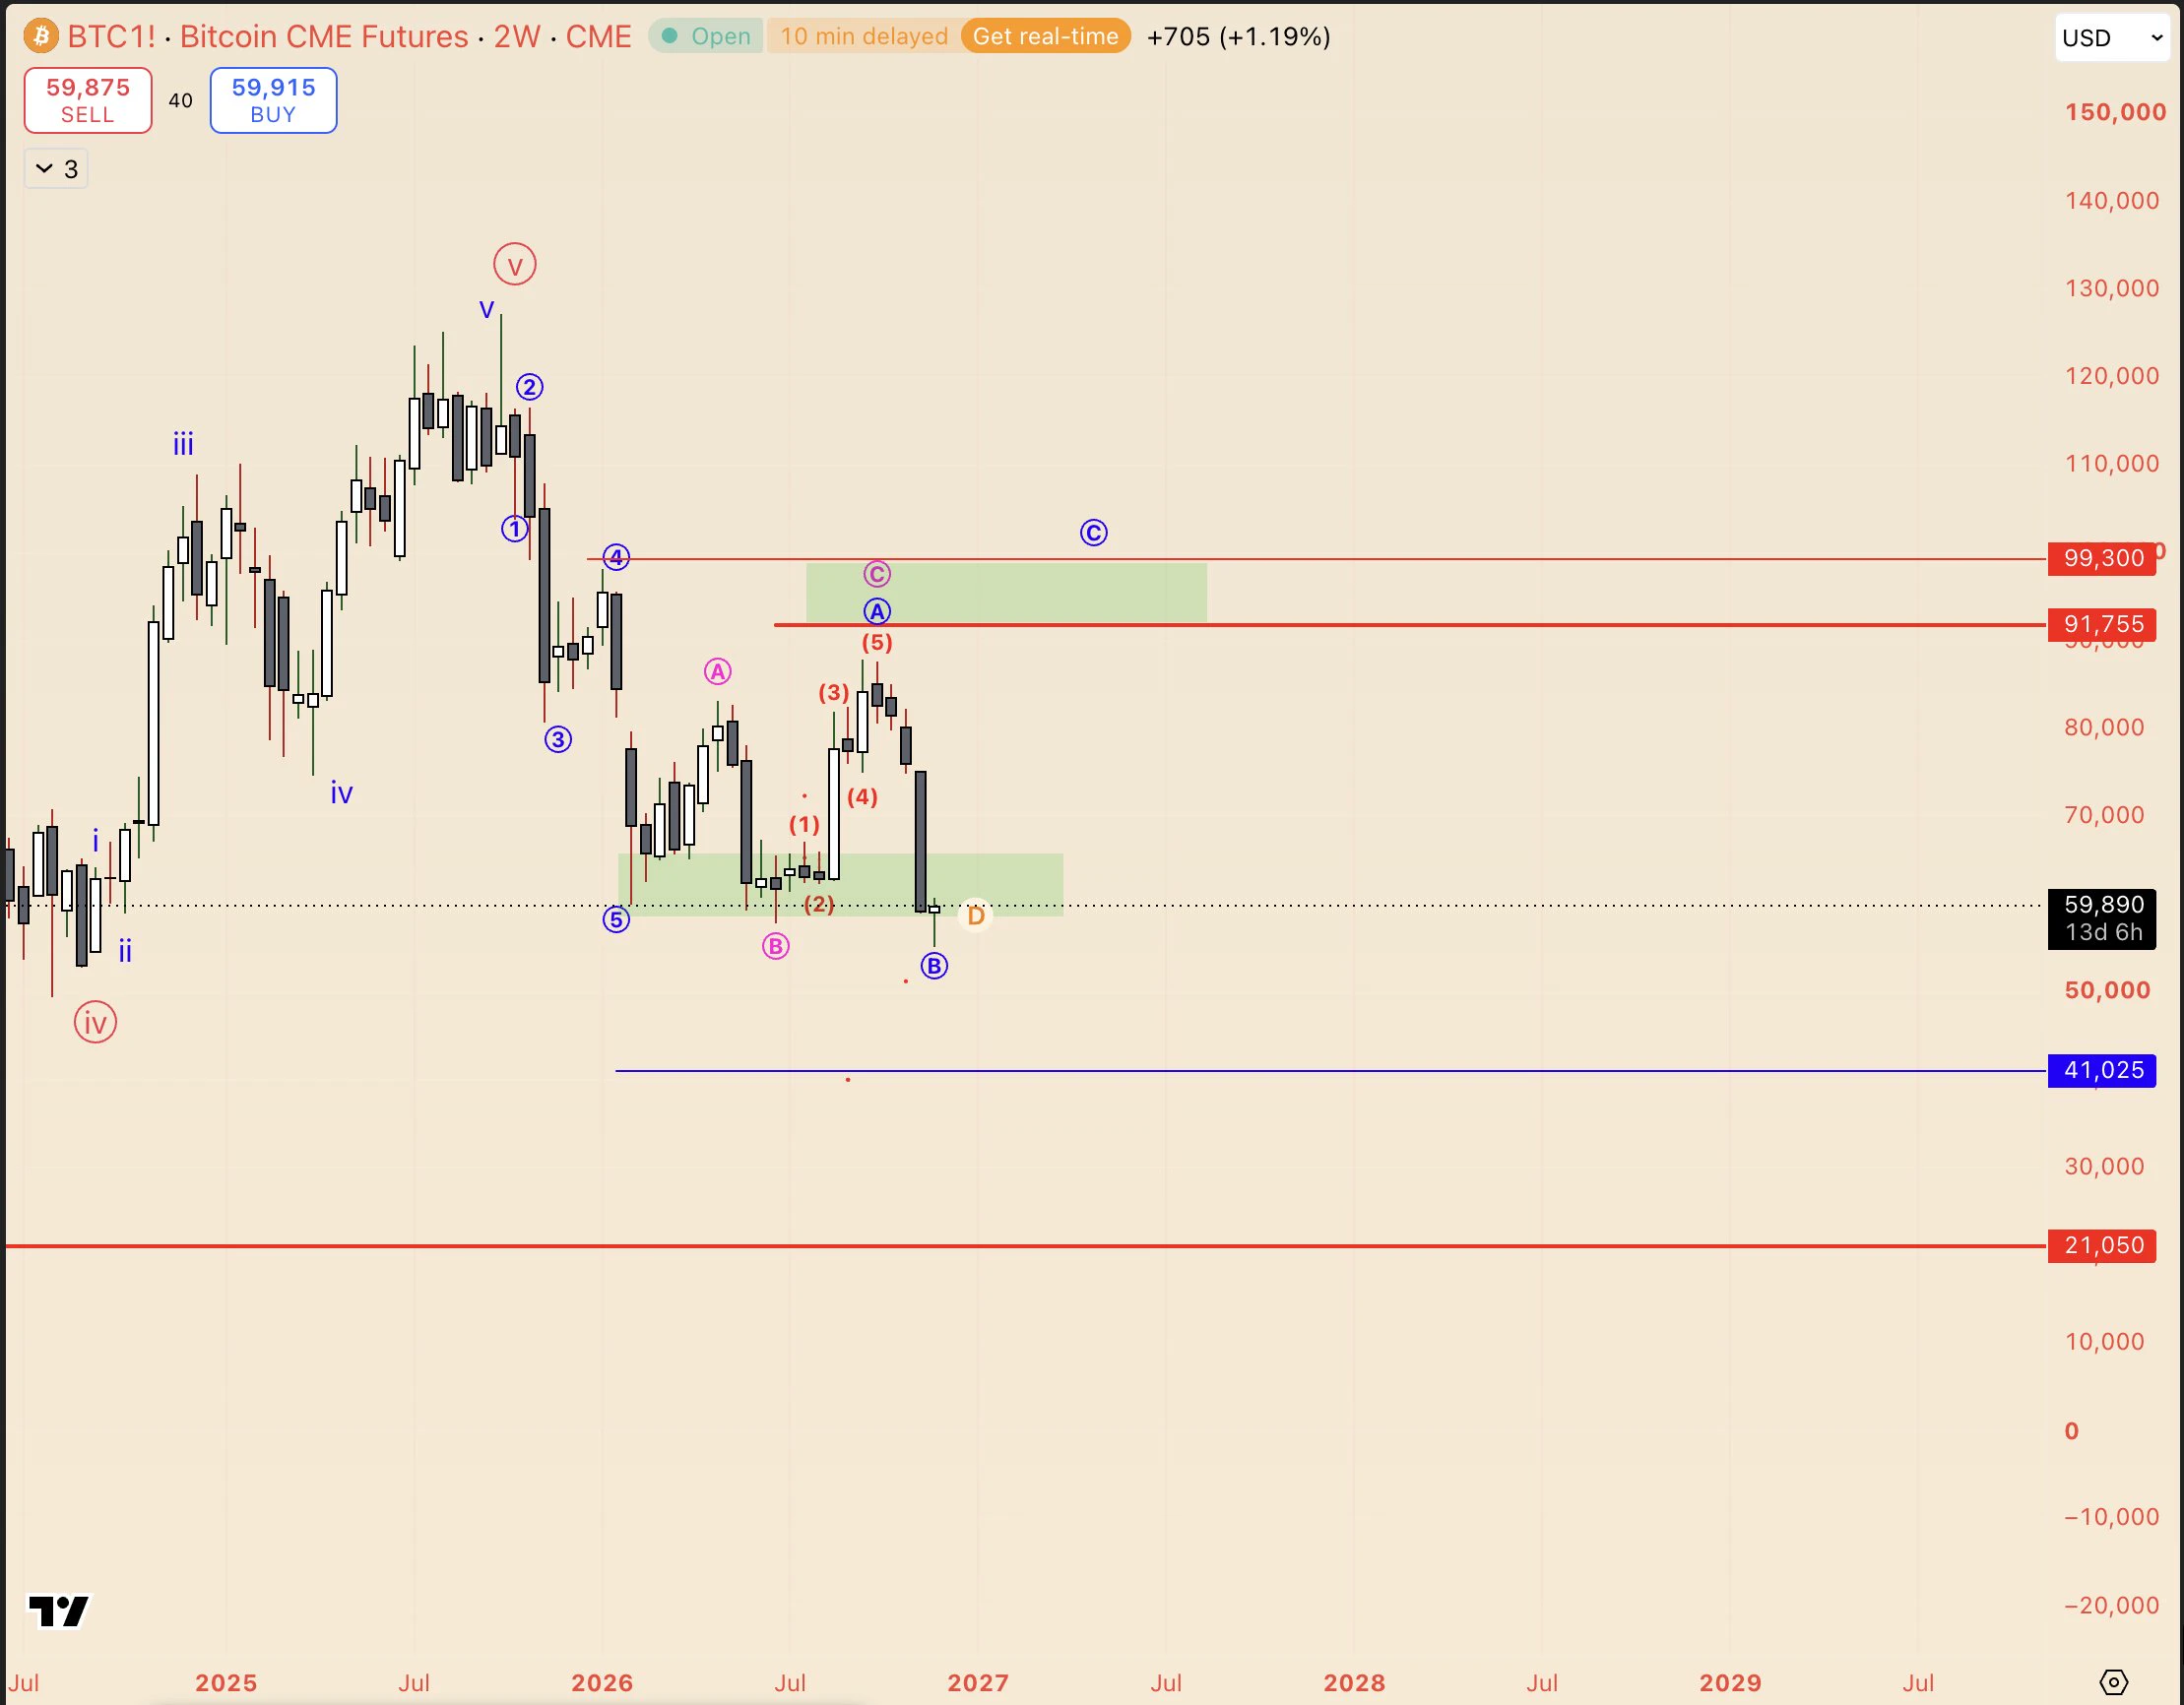
#BTC,我们跌破支撑位,现在又迅速反弹回来。

The end of the month will be decisive: where will BTC go over the next two months? 1/n
post-image
BTC-0.67%
‼️GT has plunged—the best time to subscribe is here: 4gt is half price, returning to 9gt tomorrow. A 90% long-term win rate; over 600 subscribers 🎉 Subscription details⬇️

https://www.gate.com/zh/profile/缠浪解盘

🔥 Four wicks failing to break the level is a bear trap; the fifth wick followed by a V-shaped reversal is the answer 📈
When the wick hit 55,130, everyone online was shouting “crash.” We had our long orders placed on the buy wall—
‼️We bought the bottom at 1540/57700 yesterday; today’s current price is 1730/61000, and we’ve already doubled our position‼️ 📈#下周PCE与GDP数据将揭晓
GT-2.24%
  • 1
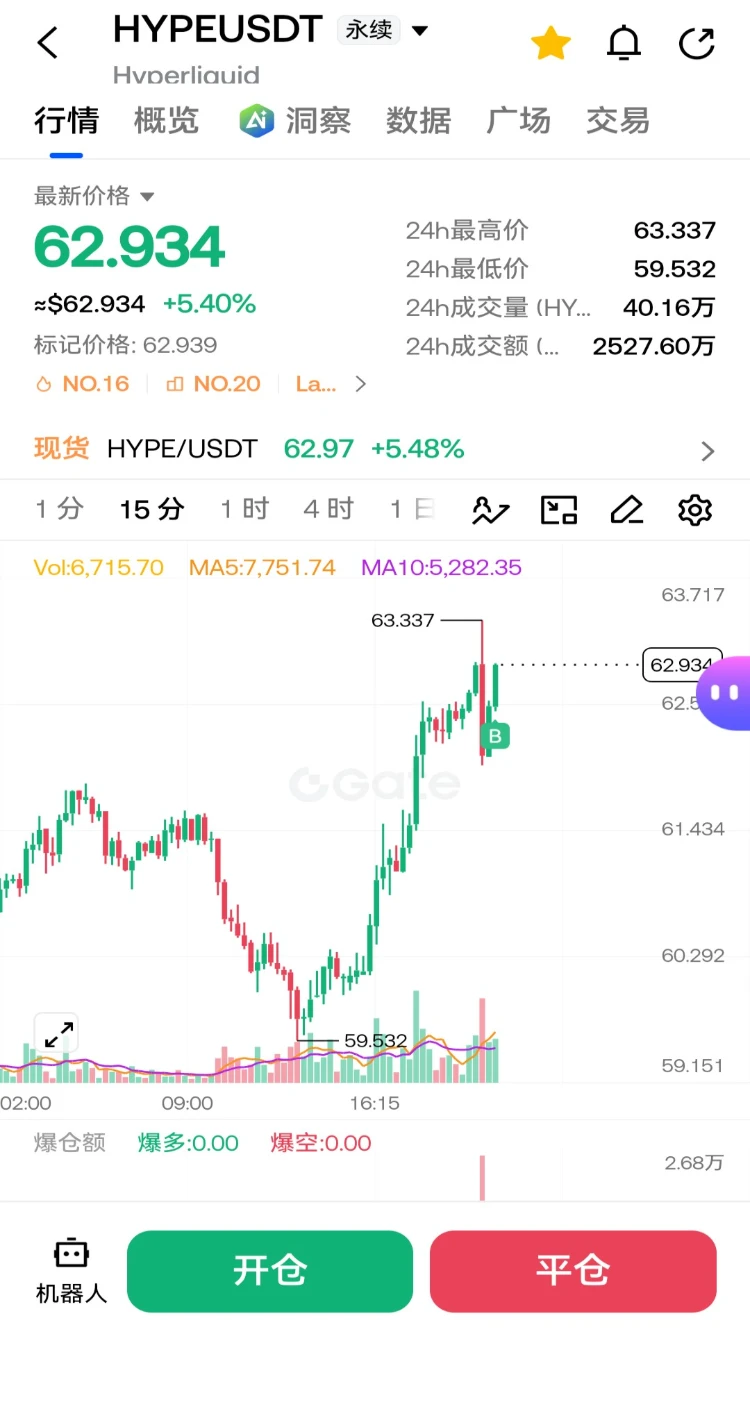
$HYPE Long position entered, reference take-profit price 67.878. #BTC反弹后再争6万美元关口 #Gate年度荣耀盛典 #作手分析
post-image
HYPE+0.33%
  • 2
  • 2
#BTCReboundFaces60KTest

CAN BITCOIN HOLD ABOVE $60,000 AFTER BOUNCING OFF $55,300 AND SLIPPING BACK NEAR $59,300?

Will Bitcoin's quick jump back above $60,000 on November 21 turn into real stability, or is the pullback toward $59,300 a sign that sellers are still waiting overhead? After touching lows around $55,300—its weakest stretch since September 2024—Bitcoin rebounded above $60,000 before easing back toward the $59,300 area. Because round numbers act like magnets for both buyers and sellers, watching how price behaves around $60,000 gives a clear window into market strength.
CEO Econom
post-image
BTC-0.67%
I have 30 coins + Bitcoin that I follow for months for trading and investing, and to provide better service to subscribers
But do I stick with them forever? Of course not.
I’m not just a technical analyst who looks at charts; I follow the coins themselves, their projects, and their flows to decide whether to stick with them or remove them from my investment list
I don’t consider any coin a constant unless its continued existence is stable, because money is precious
So when you’re thinking about buying a coin, don’t buy it for the chart
Buy it for its actual movement alone, and then look at the
post-image
#PCEAndGDPDataNextWeek

Next week could bring another major test for financial markets as investors turn their attention to upcoming U.S. PCE inflation and GDP data.

The PCE report will be closely watched because inflation remains one of the most important factors influencing expectations for Federal Reserve policy. A stronger-than-expected inflation reading could increase concerns that rates may need to remain restrictive for longer, potentially putting pressure on risk assets such as Bitcoin and equities.

On the other hand, softer PCE inflation could strengthen expectations for a more supp
post-image
BTC-0.67%
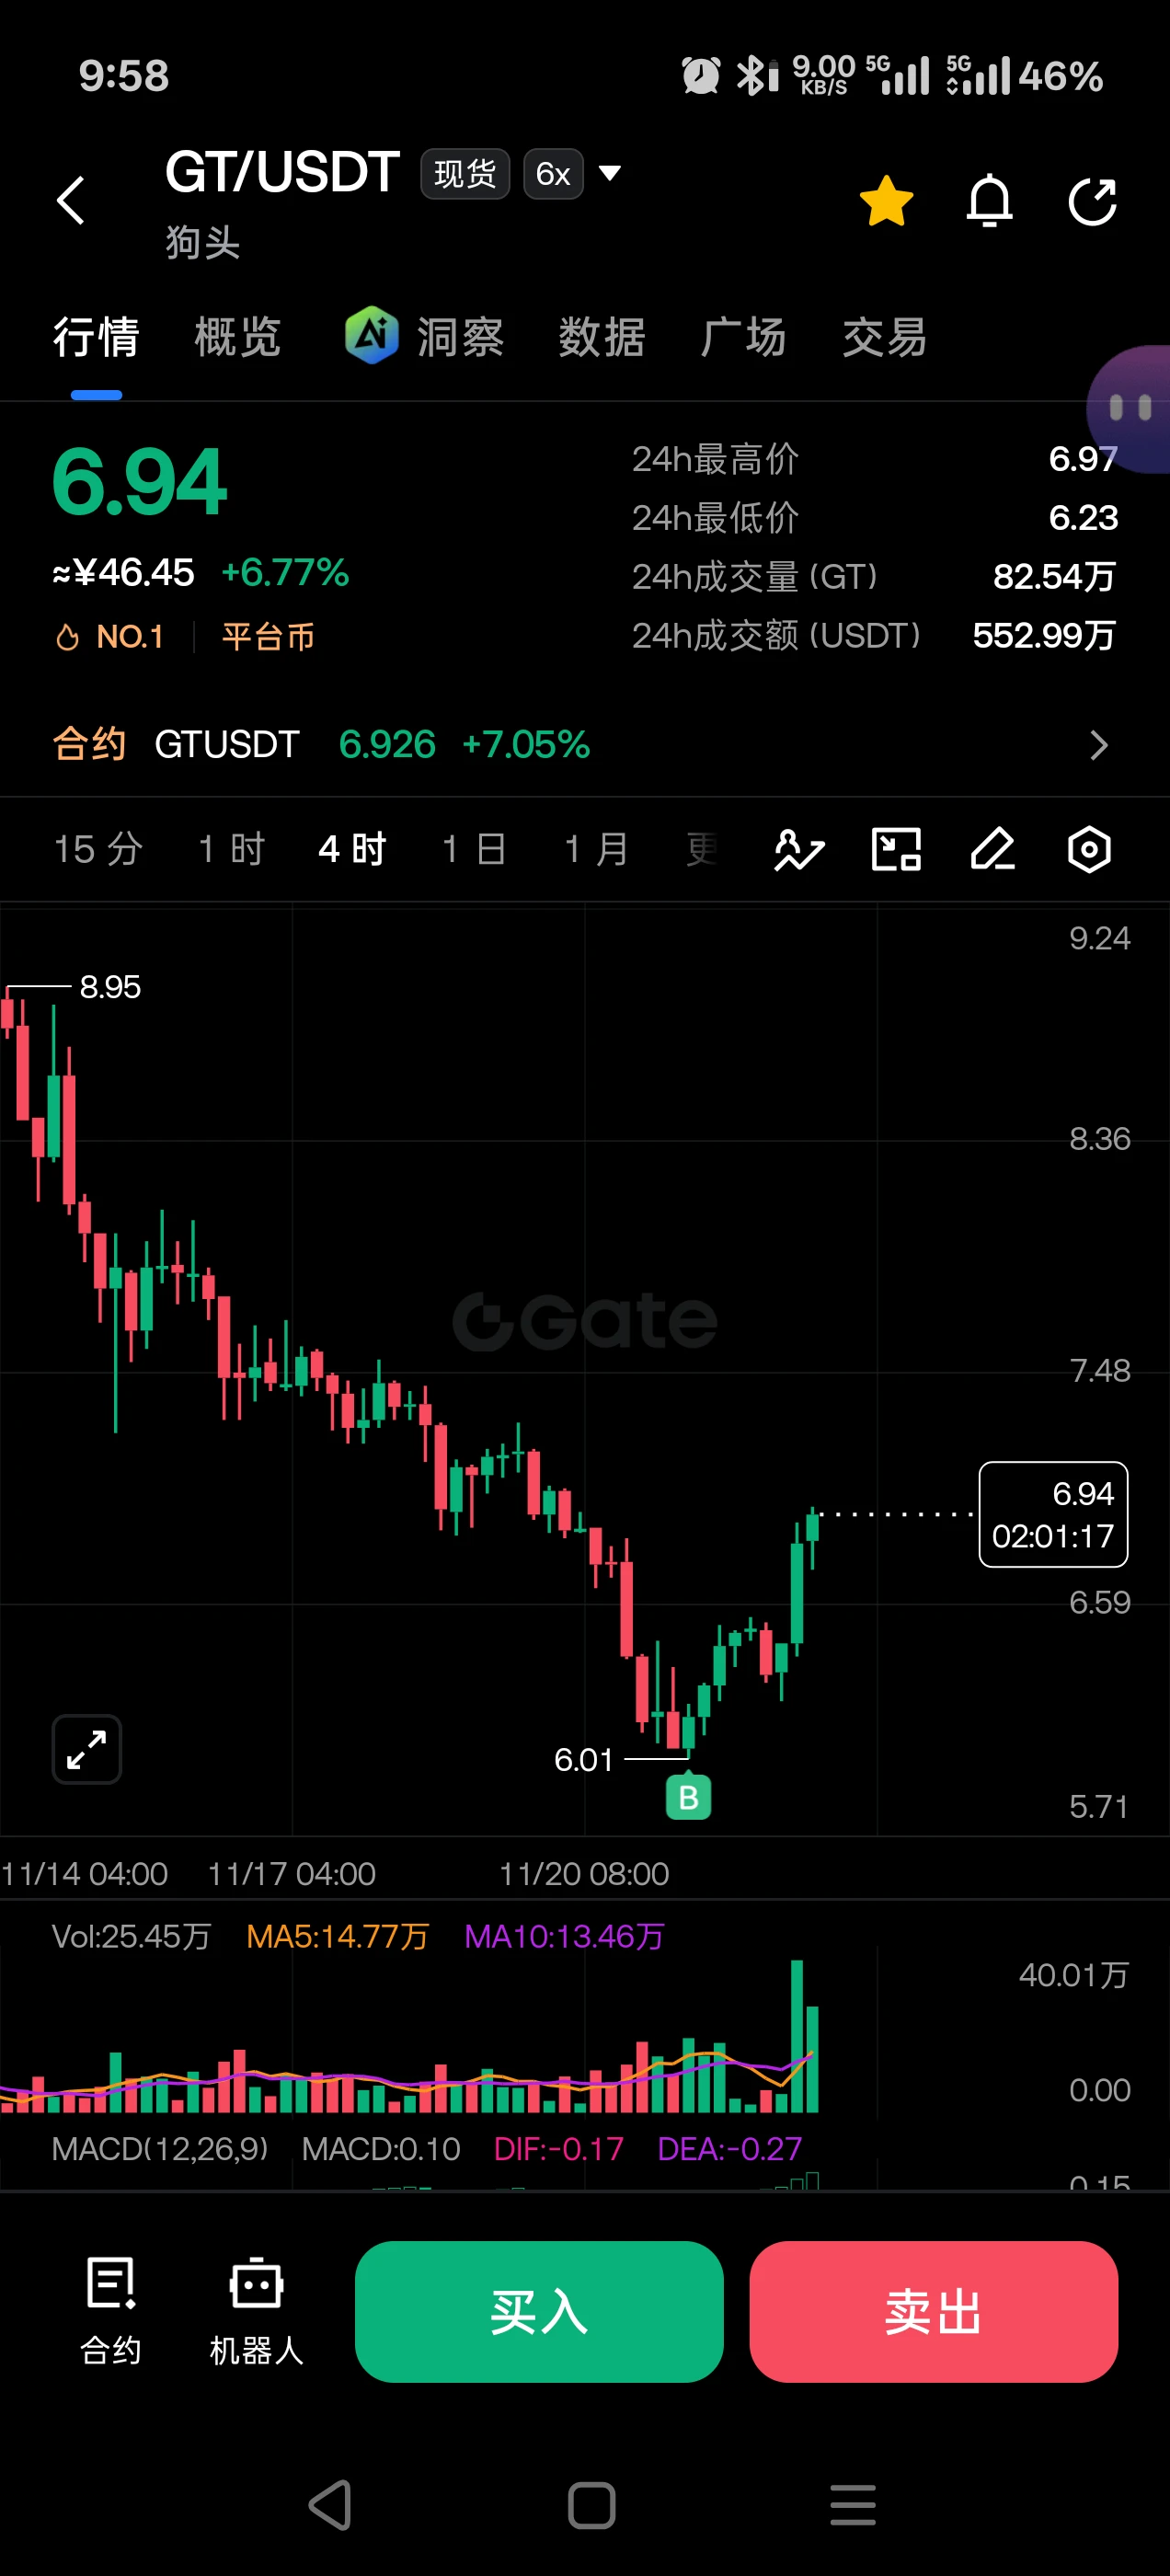
$GT Everything at 8 or below is a small holding
post-image
GT-2.41%
  • 1
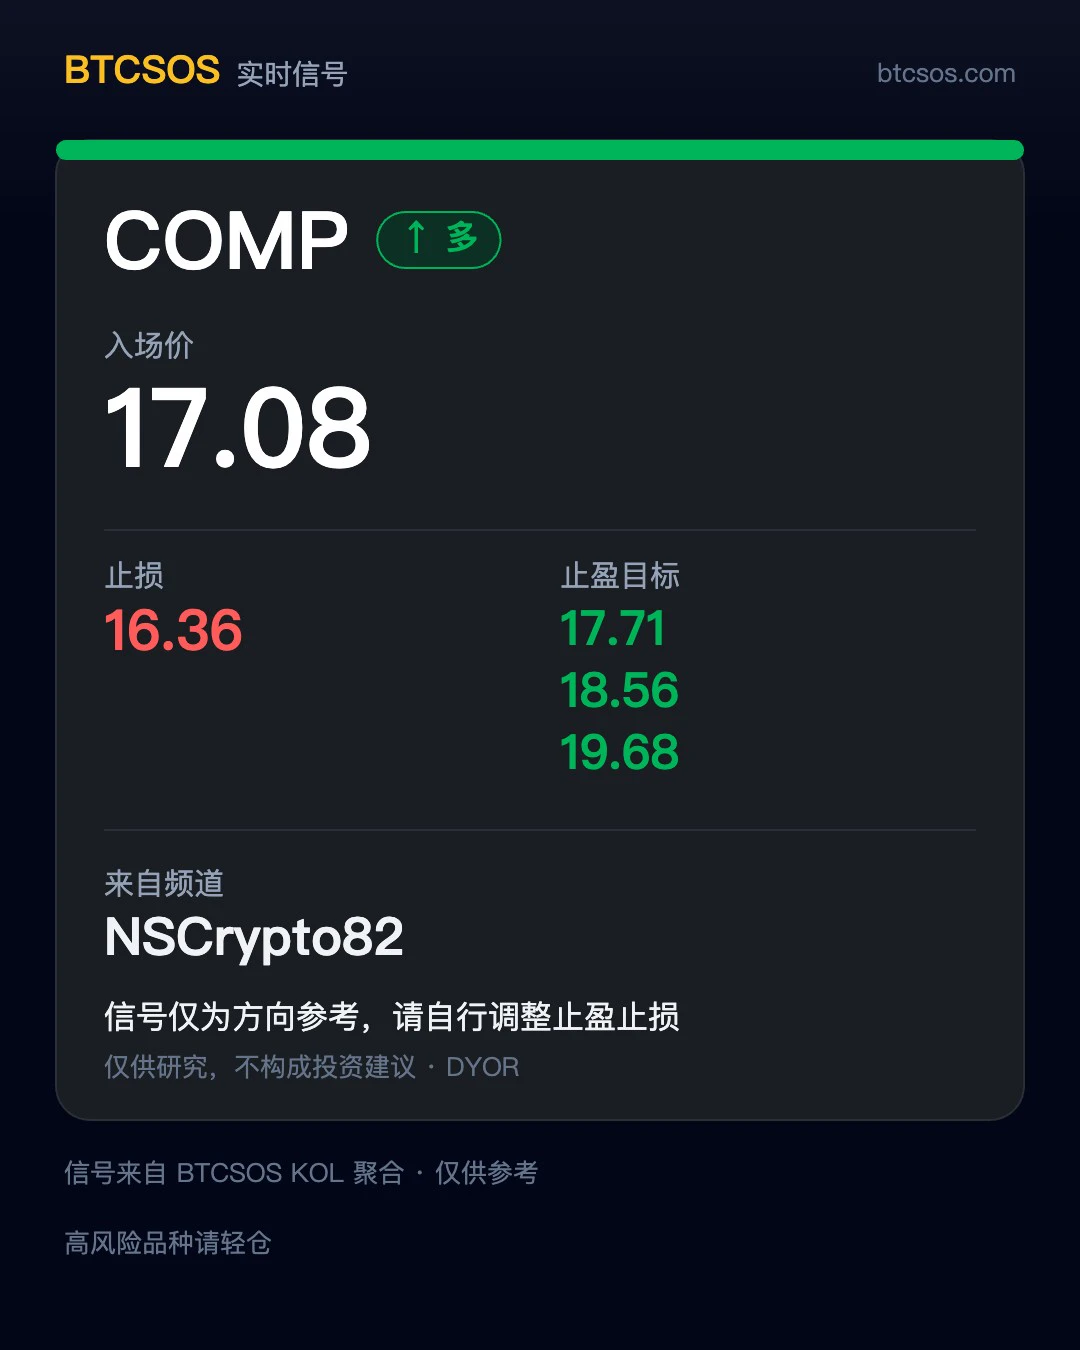
📦 Signal Card | Reposted from NSCrypto82
Time: Not specified (just captured) Asset: $COMP Long entry: 17.08 Stop-loss: 16.36 Targets: 17.71 / 18.56 / 19.68
Funny, I reposted this person's $COMP trade earlier today, and here they are again 👀
Sis just reposts; whether to follow and how much to put in is up to you.
Personal record sharing, not investment advice. #SpaceX secures about $40 billion in GPU financing commitments
post-image
COMP-10.58%
CRYPTO MARKET TRENDS
live-cover
LIVE2,512
BTC-0.67%
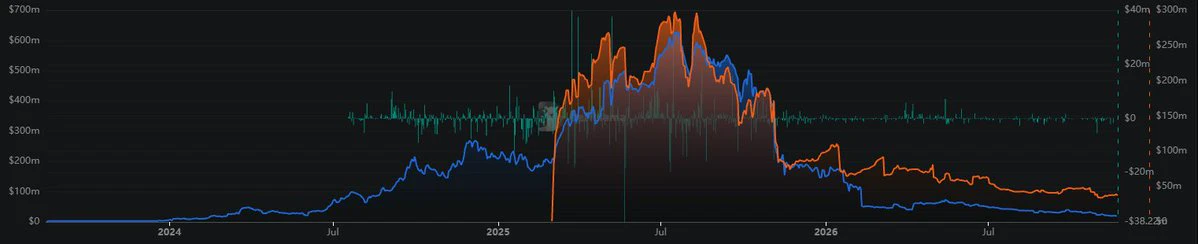
$BTC Monthly flows are still bleeding, but the bleeding has started to slow at the margin. November ETF net outflows totaled 3.59 billion, but yesterday saw net inflows of 88.1 million, with IBIT pulling in 64.5 million in a single day.

How many people were spooked by “record monthly outflows” and kept shorting around 56,000? But marginal flows are turning around, the worst selling window is closing, and bears have less and less conviction to push prices down.

I didn’t wait for ETFs to turn fully positive. I went long only after the price pulled back to 55,806, confirmed 58,000 as support, a
BTC-0.65%
ETH-1.23%
SNDK-0.18%
$ELSA is showing the kind of classic move that can turn a small position into big gains. Take a look at this 4-hour chart. It quietly traded sideways around $0.065, just painfully boring. Then suddenly, it exploded. It's up nearly 29% today, with nearly 600 million tokens in volume. This wasn't retail traders casually clicking buy a few times; smart money entered and took control. The price action is clean. Lows keep moving higher, and support is solid. Every pullback is bought immediately. This is exactly how a major rally typically starts, before the crowd catches on. I'm making a clear pre
post-image
ELSA+5.80%
🚨 The Flare Weekly #2 Newsletter is OUT! ☀️
Can't keep up with everything happening around Flare?
I've summed up this week's biggest news, Flare numbers, and what's next.. all simply explained!
FREE on Substack, every Sunday.
Read it here! 👇
post-image
Load More

Join 40 M users in our growing community

⚡️ Join 40 M users in the crypto craze discussion

💬 Engage with your favorite top creators

👍 See what interests you

Trending Topics

BTCReboundFaces60KTest

2.1M Views30.1K Discussing

BTC rebounded from around $55,300 on November 21, briefly reclaiming $60,000 before pulling back to around $59,300. The $60K level is back in focus as traders assess whether the recovery can last. Is this rebound a sign of stabilization or a short-lived recovery? Would reclaiming and holding $60K be enough, or do you need confirmation from trading volume and fund flows?

PCEAndGDPDataNextWeek

259.7K Views2.6K Discussing

GateDirectIPOPhase3ANTAllocates92100Shares

840K Views5K Discussing

View More