Share your thoughts
placeholder
Article
Layout for Bitcoin, Ethereum, and Dogecoin
live-cover
LIVE1,448
A few days ago, my hands were shaking before bed, afraid my short position would get trapped. When I got up in the morning, I saw that the market never gave me a chance to stop out—it followed the plan and ground all the way down to 0.00437, with unrealized profit already at +1041.65%.

The logic for opening the short was simple: after rebounding to around 0.00930, several upward pushes were weak, volume failed to support them, overhead resistance was obvious, and the rebound lacked strength. Since the structure had not broken, I held the short overnight.

I’m taking profit at +1041.65% for
post-image
SOL-1.09%
XRP-0.11%
JUST IN: UBS lays out a “buy and sell” think for stocks on dips, gold pullbacks, and a cautious tilt on bonds as rate-hike odds rise; NFP beat fuels 60% odds of a Sep hike, but stock bulls remain intact on AI, power/resources, and longevity themes. $BTC ? (no ticker unless rele...
post-image
UBS-0.51%
BTC-0.64%
I didn’t expect it to survive—it went straight to breakeven. The service was exceptional.

When it plunged intraday, I stared at the screen thinking: this trade might really be an expensive lesson. But then I noticed funds quietly entering and the pullback holding steady, so I felt it was still missing one final push. Today, it supplied that push itself.

$HUMA is currently at 0.02232, compared with my entry at 0.02133, bringing the paper gain to +118.5%. Those already on board should be waking up laughing—the profits feel great.

The prerequisite for compounding is staying alive; the short
post-image
HUMA+1.08%
BNB-0.65%
DOGE+1.65%
September 8 15-minute short-term strategy:
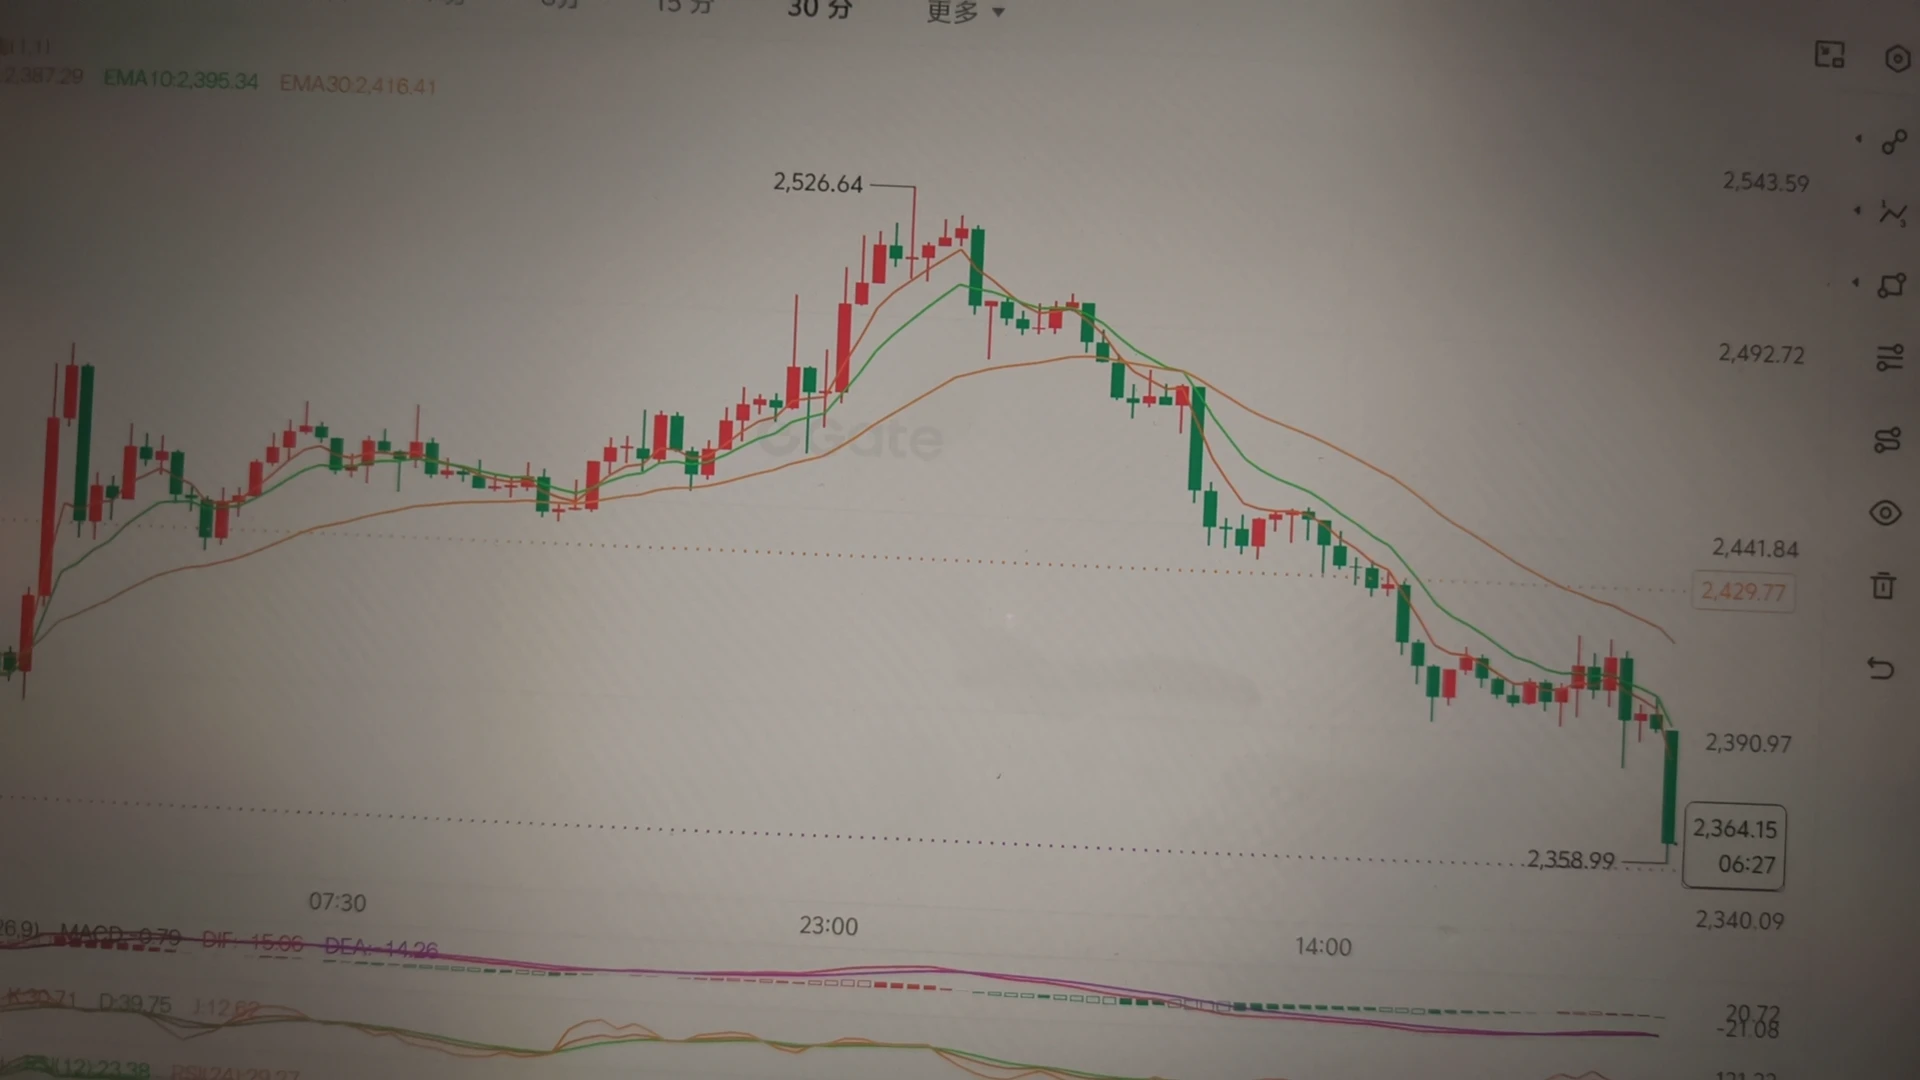
ETH: Short around 2526-2545, take profit around 2500-2482-2466, stop loss if it breaks above 2550. Long around 2448-2436, take profit around 2466-2480, stop loss if it breaks below 2430.
BTC: Short around 79365-79530, take profit around 78811-78600, stop loss if it breaks above 80000.
SOL: Short around 105.70--106.87, take profit around 103.58-103.16, stop loss if it breaks above 107.50.
For ETH, due to price differences across platforms, entries can be taken $1-3 above or below; for BTC, entries can be taken $50-100 above or below.
The breakouts and
ETH-0.10%
BTC-0.64%
SOL-1.20%
Most traders are about to get blindsided by SYMBOL right now.

$ETH /USDT - LONG

Trade Plan:
Entry: 2483.69 – 2490.73
SL: 2453.39
TP1: 2512.57
TP2: 2529.48
TP3: 2554.84

Why this setup?
Why now? The daily trend is bullish, and the 4h setup is armed with a 95 percent confidence score, so the odds favor continuation. The 1h ATR of 14.090609 shows the average true range, which tells us how aggressively price is moving right now. The 15m RSI at 51.25 means momentum is neutral, not overbought, leaving room for upside. The entry zone around 2487.21 aligns with the current 1h price, while TP1 at
ETH-0.04%
This $WLD trade took profit near the target, without getting greedy for the final acceleration. Volume has clearly contracted, reducing the probability of a continued push higher. The biggest concern is watching unrealized gains ride another roller coaster.

Looking back at the entry logic: the price pulled back to the platform around 0.3736, and the four-hour candle closed with a long lower wick, showing a fairly clear shift between bulls and bears. I used 30% of the position to test the waters and held throughout once it stabilized above the level.

During the rally, I originally planned t
post-image
WLD+21.31%
XRP-0.11%
LAB-1.75%
#GateLaunchesTrenchesWith0GasFee Gate Launches Trenches: On-Chain Trading Gets a Major Upgrade!
Gate has officially launched Trenches, a new one-stop on-chain trading product designed to make Web3 and Meme trading faster, simpler, and more accessible. The launch also introduces a limited-time Gas fee waiver, giving traders an opportunity to reduce one of the biggest costs associated with on-chain transactions.
🔥 0 Gas Fee on Robinhood Chain
As part of the launch promotion, users trading Robinhood Chain assets through Trenches can enjoy a limited-time 0 Gas fee benefit. The promotion is avail
post-image
MULTI-16.41%
SOL-1.20%
ETH-0.10%
SUI+3.89%
Insiders are calling this range the setup that breaks short sellers

$BTC /USDT - SHORT

Trade Plan:
Entry: 79216.1 – 79363.5
SL: 79997.2
TP1: 78759.3
TP2: 78405.6
TP3: 77875.0

Why this setup?
Why now? The daily trend is range, so the market is coiled and waiting for a directional burst. The 1h ATR of 294.74 shows volatility is compressed enough for a sharp move, while the 15m RSI at 57.61 signals room to run lower before overbought. The entry zone sits at the 1h price of 79289.8, giving a precise fill, with TP1 at 78759.3 and TP2 at 78405.6 as the first two targets on the short side. The
BTC-0.62%
JUST IN: Poll data point to a tight race as midterms near, with GOP holding a slim House edge while Dems show stronger voter enthusiasm. If Democrats flip the House, investigations could loom; market reaction remains uncertain. $BTC $ETH
post-image
BTC-0.64%
ETH-0.10%
September 8 Strategy Plan
Priority ranking, for followers only
The final priority order I’m giving you today
First priority: High-level short
2500–2511 short
Enter after resistance is confirmed.
Stop-loss: 2518
Targets
2490 → 2480 → 2473 → 2465
Second priority: Low-level long
2472–2478 long
Enter after a bottom is confirmed.
Stop-loss:
2460
Targets:
2488 → 2498 → 2508 → 2511
Third priority: Breakout long
Effective break above 2511 + retest of 2505–2511 holds
Stop-loss:
2495
Targets:
2525 → 2535 → 2548 → 2565
Fourth priority: Breakdown short
Effective break below 2464 + rebound fails to reclaim
post-image
ETH-0.04%
JUST IN: ByteDance’s real-time spatial video model, led by founder Zhang Yiming, aims for October launch with Pico headset integration. If it scales, expect faster, cloud-powered interactive AR/VR experiences to drive cloud compute demand. $BTC ? (Note: no direct crypto tie; om...
post-image
BTC-0.64%
Market Alert

$LTC /USDT - SHORT

Trade Plan:
Entry: 54.92 – 55.34
SL: 57.13
TP1: 53.63
TP2: 52.63
TP3: 51.13

Why this setup?
Technical setup found.

Debate:
Thoughts?

⚠️ Personal market analysis only. NFA — manage risk and DYOR.
Educational content, not investment advice or a recommendation to buy, sell, deposit, or withdraw any asset. No paid promotion or referral/affiliate links.
post-image
LTC+2.20%
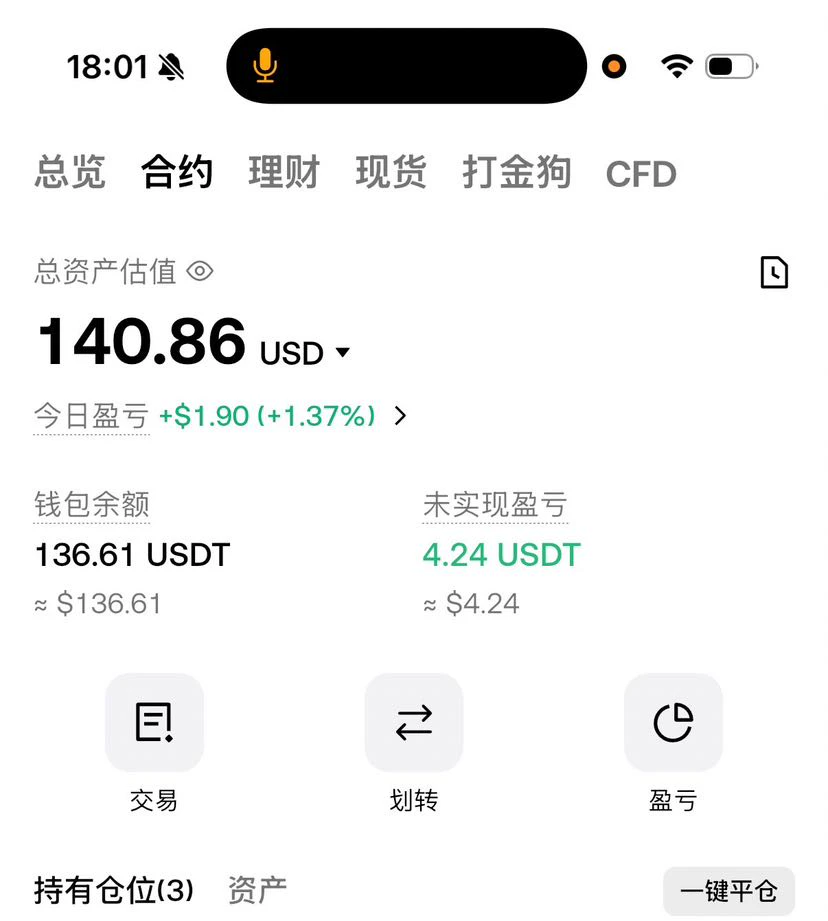
I’ve been holding this position, #晒出我的持仓收益 , for several days now... All I can say is that 79387.9 is an important level, while 78600 is an important OB. If it can’t hold, it will open up room for a pullback!!! The reason I’m holding is because I’m at a high level. Even if it retraces, I don’t mind.
post-image
Most traders are about to get burned on this overlooked setup.

$LTC /USDT - SHORT

Trade Plan:
Entry: 55.32 – 55.72
SL: 57.45
TP1: 54.07
TP2: 53.10
TP3: 51.66

Why this setup?
Why now? The 1h price is pinned at 55.52 inside a tight range, the 15m RSI sits at 46.54 showing weak momentum, and the 1h ATR of 0.805067 confirms the move is compressing before a snap. The entry zone of 55.32 to 55.72 aligns perfectly with this squeeze, targeting TP1 at 54.07 and TP2 at 53.10 on the daily range. The invalidation level at 52.92 is the hard stop that separates a scalp from a loss.

Debate:
Are we cl
LTC+2.20%
Insiders are watching $ETH /USDT break higher while everyone else is still debating the pullback.

$ETH /USDT - LONG

Trade Plan:
Entry: 2480.83 – 2487.87
SL: 2450.53
TP1: 2509.71
TP2: 2526.62
TP3: 2551.98

Why this setup?
Why now? The daily trend is bullish, and the 1h price is holding steady at 2484.31, which aligns perfectly with the entry zone of 2480.83 to 2487.87. The 15m RSI at 48.76 shows room to run before overbought territory, while the 1h ATR of 14.09 suggests a healthy volatility expansion is underway. The plan targets TP1 at 2509.71 first, then aims for TP2 at 2526.62 as moment
ETH-0.04%
As indicated in the morning gold alert, it rose as expected, reaching a high of 4435$XAU .
XAU+0.87%
This move is so obvious I don't even need to think—the account is dancing on its own. 🥳

When $SOL repeatedly oscillated intraday, many people thought it was about to reverse and rushed to go long. I watched it bounce up and then pull back, with volume and price never matching up—it looked like a bull trap no matter how I looked at it. After testing the key level several times without holding, shorting here felt much more comfortable than chasing longs, so I entered at 104.51 and waited it out.

I just took another look, and it has already slipped to 103.78, sending the return straight to +
post-image
SOL-1.09%
LAB-1.75%
ADA+0.50%
The $SNDK long was a bit of a grind to hold, with one dip in between sweeping out quite a few short chasers and coming just a few points from my protective stop. I didn’t manually cut it at the time because the four-hour structure had not yet broken.
I entered based on a double bottom on the hourly chart. After the right-side breakout, it retested the prior-high neckline and held firm, so I went long after confirmation. The entry wasn’t particularly cheap, but the stop was very close—an attempt to use limited risk to capture a trend continuation.
After it rallied into the target zone, I manage
post-image
SNDK+1.72%
BTC-0.62%
ZEC-3.69%
Load More

Join 40 M users in our growing community

⚡️ Join 40 M users in the crypto craze discussion

💬 Engage with your favorite top creators

👍 See what interests you