
Share your thoughts
placeholder
Article
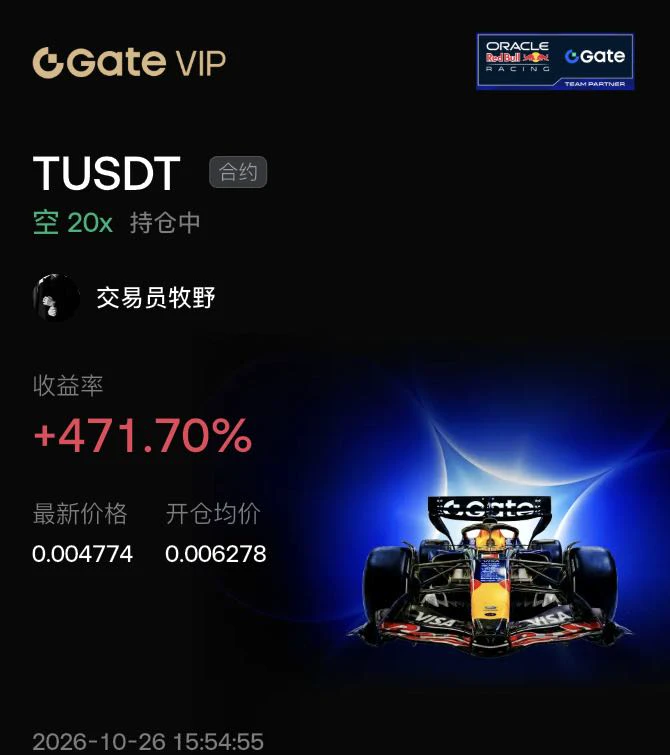
This return makes me both thrilled and apprehensive, worried that when the market catches on tomorrow, it will blacklist me.
While everyone else was running, I watched the action at key levels for a long time. The rebound could not even touch the previous high, every push upward fell just short, and volume failed to follow. In this structure, shorting at 0.7801 was not a gamble—it was going with the weakness.
Now $CYS has reached 0.1811, with a return of +6512.55%. Hold as long as the trend remains intact; run if it breaks down. Prices driven by emotions are not sustainable.
Let me make the d
post-image
CYS-15.62%
BTC-0.20%
XRP+2.91%
  • 1
Insiders are fading the bounce on SYMBOL right now.

$BTC /USDT - SHORT

Trade Plan:
Entry: 78361.77 – 78561.21
SL: 79418.77
TP1: 77743.53
TP2: 77264.88
TP3: 76546.92

Why this setup?
Why now? The daily trend is range-bound, but the 1h ATR of 398.87 shows the hourly swings are tightening into a squeeze. The 15m RSI at 56.15 confirms we are not yet overbought, so the short bias can still hold. The entry zone sits between 78361.77 and 78561.21, with the reference price at 78461.49 anchoring the setup. TP1 is 77743.53, TP2 is 77264.88, and TP3 is 76546.92, laying out a clear path lower. The li
BTC-0.20%
$EVAA /USDT Perp – "Extended Downtrend – Short"**
**Trading Plan Short $EVAA
Entry: 0.5989
SL: 0.6198
TP1: 0.5943
TP2: 0.5850
Explanation: Price is heavily rejected below the 0.6198 yellow line and all EMAs. MACD is deeply negative; targeting the 0.5943 purple support and the 0.5850 low.
#GateLaunchesTrenchesWith0GasFee
post-image
EVAA-2.98%
  • 7
Contrarian take: SYSLX is range-bound and maybe ready to drop harder than the 4h trend suggests.

$SLX /USDT - SHORT

Trade Plan:
Entry: 0.06871 – 0.06915
SL: 0.07105
TP1: 0.06734
TP2: 0.06628
TP3: 0.06469

Why this setup?
Why now? The 1h price is 0.06893, which is the exact entry_ref and the upper edge of the 1h range, so the short bias is triggered from a high-confluence zone. The 15m RSI at 48.29 shows we are not overbought, allowing room to run toward TP1 at 0.06734 and TP2 at 0.06628 before exhaustion. The 1h ATR of 0.000883 sets realistic stops and size because the invalidation is 0.0
post-image
SLX-0.88%
I didn’t do anything—just went to the bathroom, and when I came back, the K-line had already done the work for me. During that repeated back-and-forth intraday, $ZEC was still playing dead. Who knew that in the time it took to wash my hands, it would start ripping higher?
The logic was actually very simple: the bottom had been consolidating for long enough, buying pressure kept strengthening, and someone stepped in to catch every dip. I said at the time that holding at this level was better than messing around blindly. And there you have it—the answer.
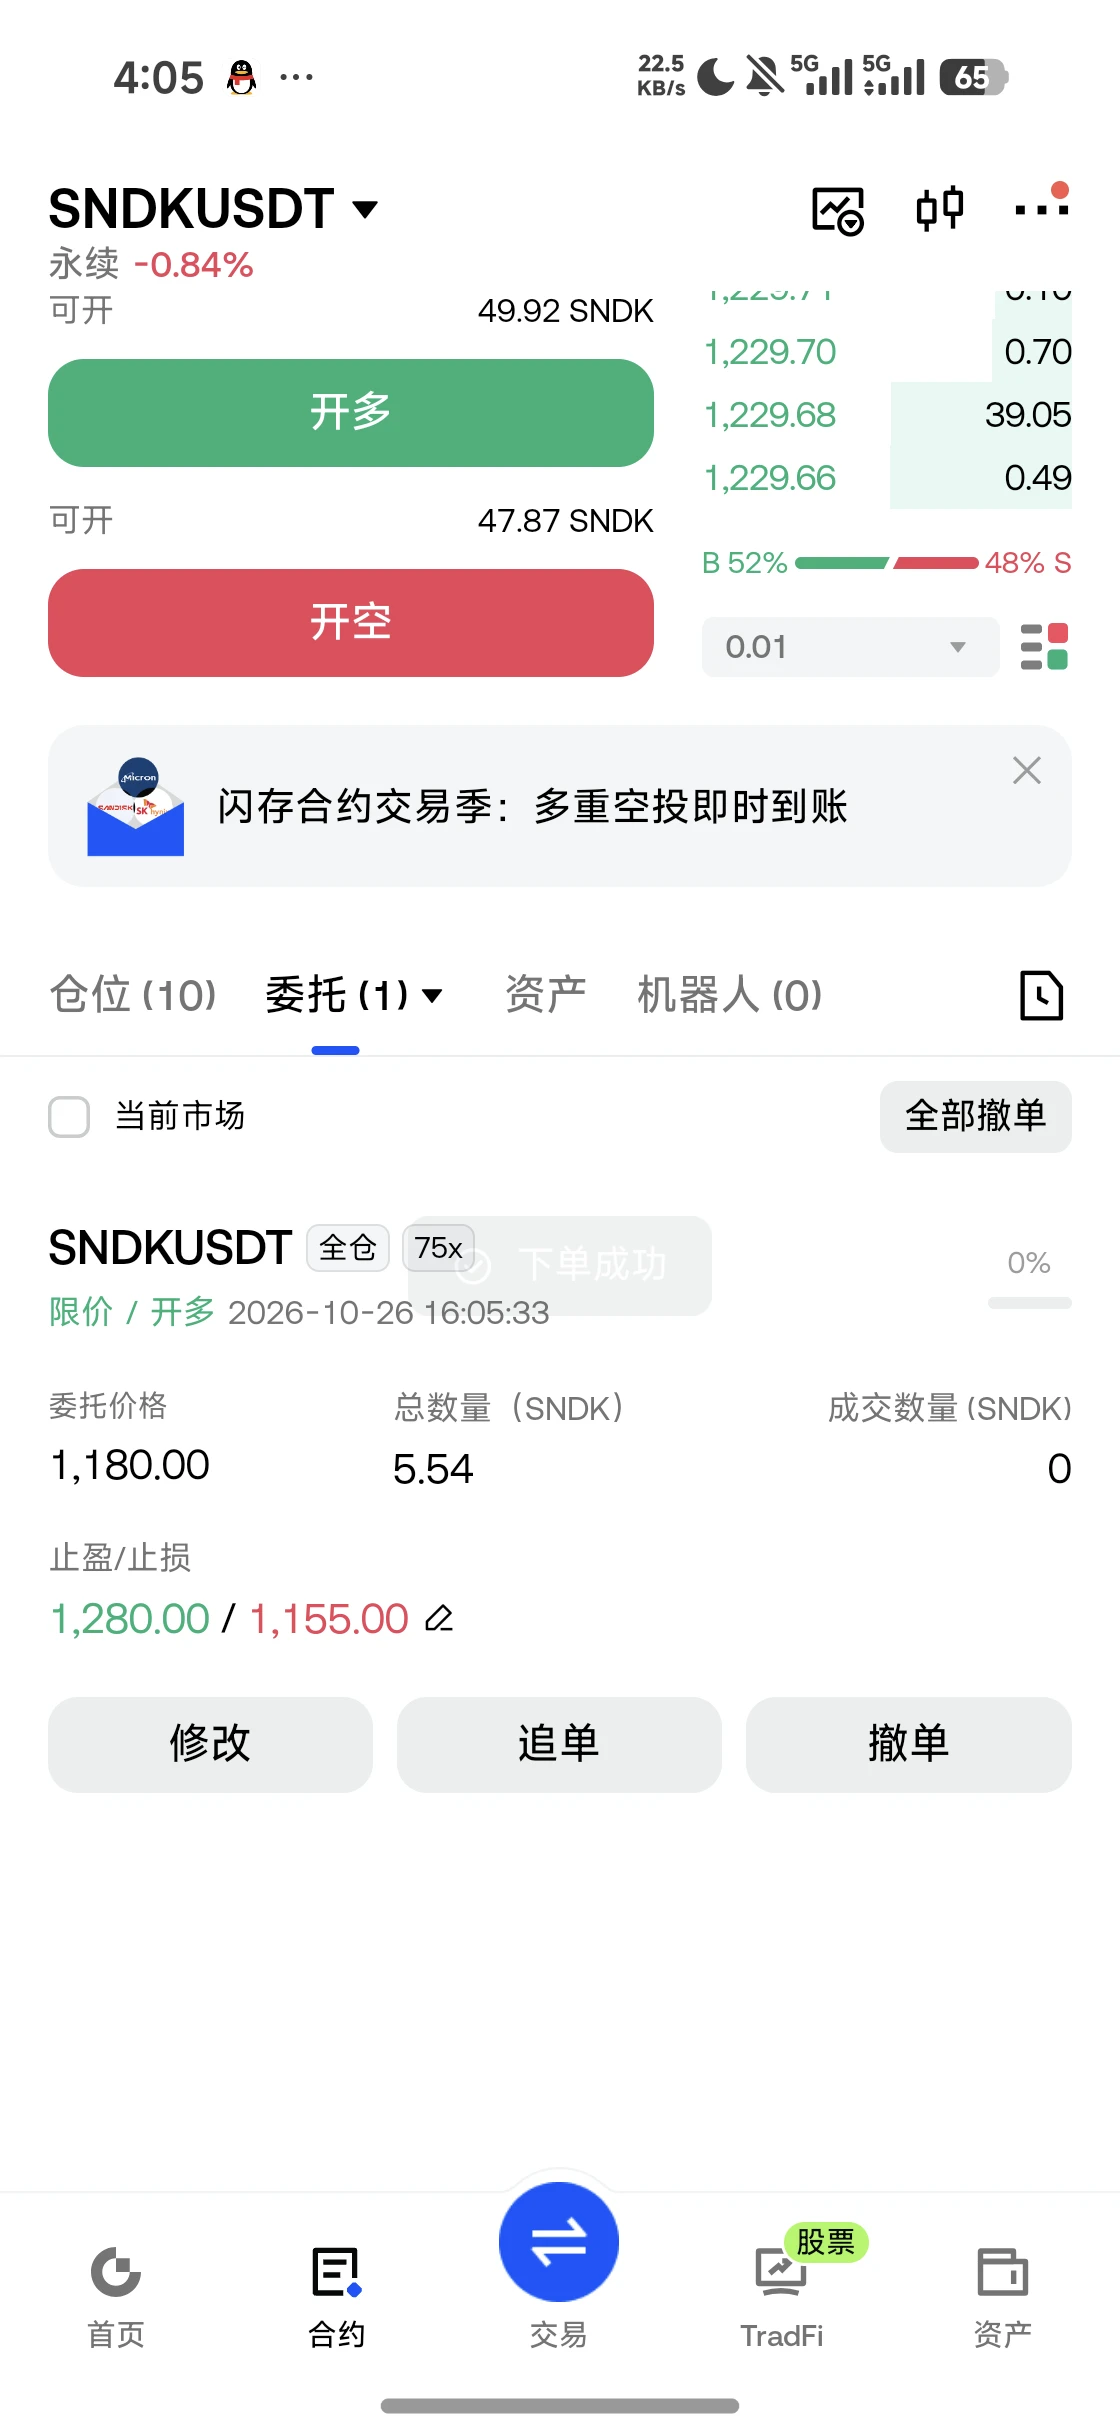
The long opened at 837.09 is now at 1180
post-image
ZEC+3.18%
SNDK-0.02%
XRP+2.91%
$XAN Whale addresses continue accumulating, with holdings concentration hitting a new high! Retail FOMO is intensifying—how far can this wave go?#Gate.io 🔥
XAN-37.84%
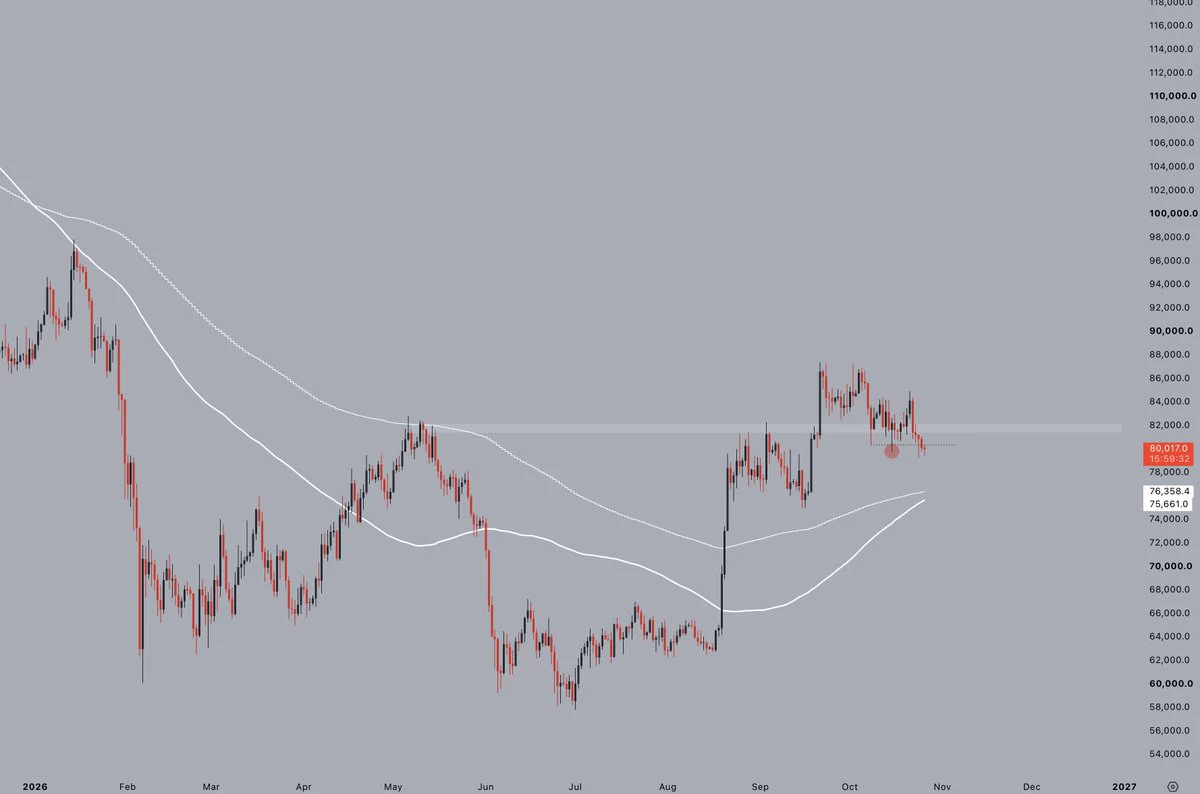
bitcoin:native made a bottom at $58K
But most retail investors are still side lined
Why was this bottom different than in the past?
Because Wall street has entered the chat
post-image
BTC-0.17%
whales move in sync!
live-cover
LIVE1,472
Evening Guide: 1,000 units landed, 50 palaces
A decline is building strength; only after lying low can one rise toward the sun. ​​​$BTC $ETH
BTC-0.17%
ETH+0.76%
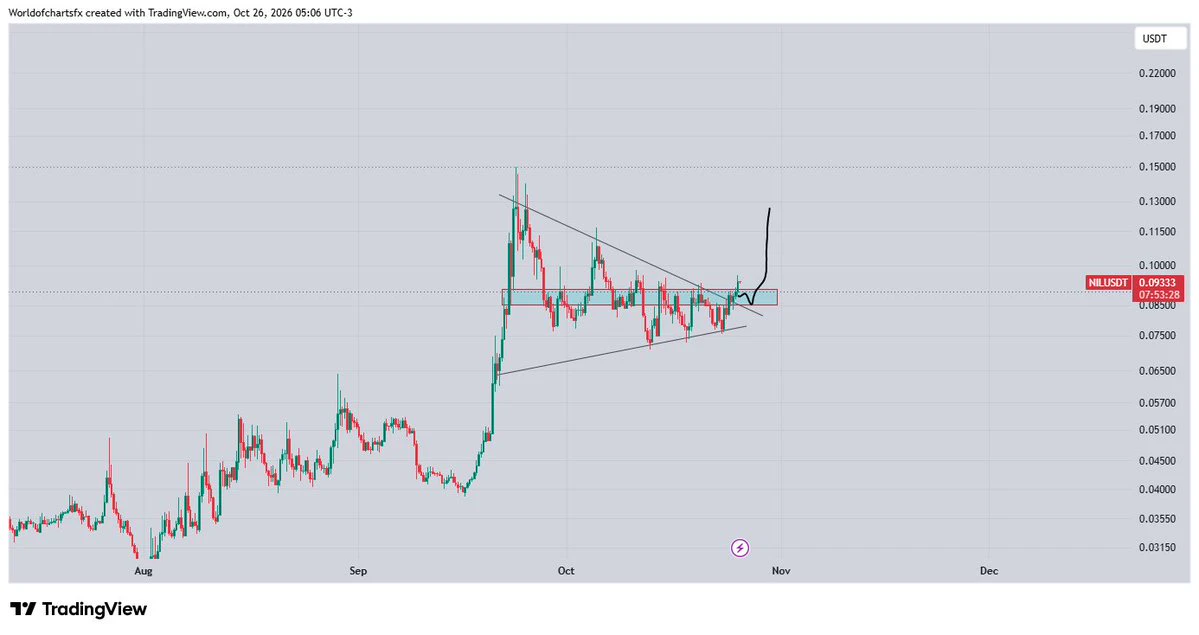
$NUKE breaking out of the channel it was in
Next leg will be more aggressive now that the flywheel is spinning...
post-image
  • 1
$ETC Malgebi coin, the doomsday chariot takes off🛫……
ETC+11.32%
Early morning analysis on September 9 $BTC
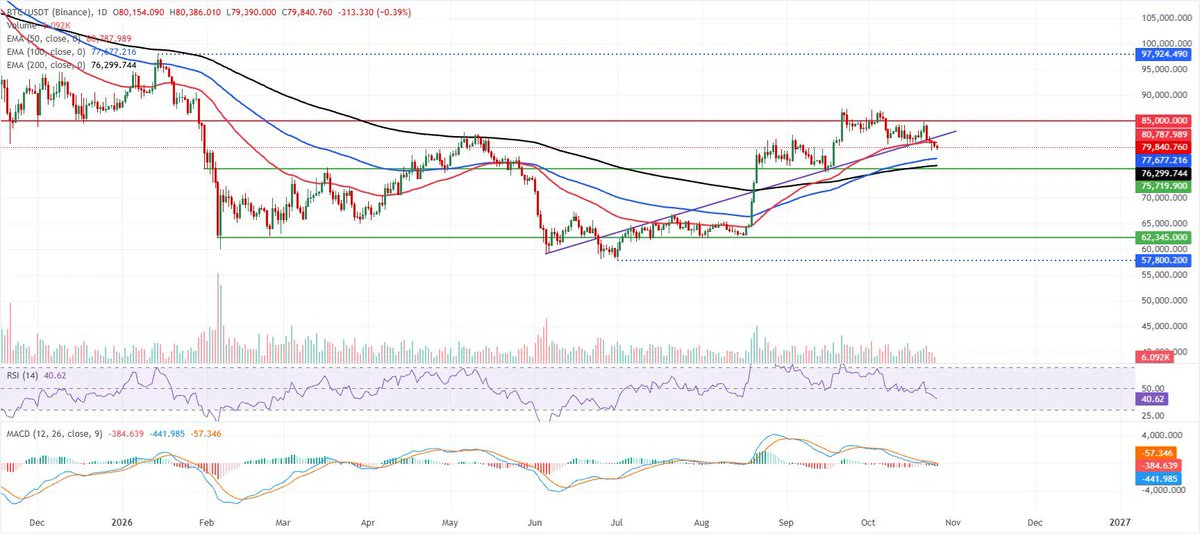
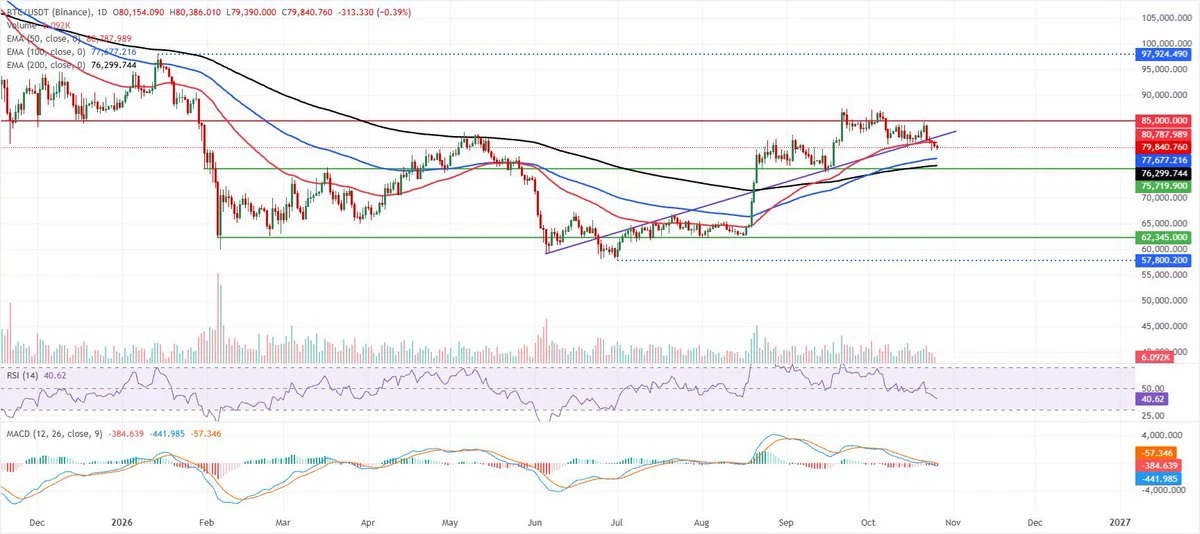
Bitcoin is currently at 78,856, having fallen below the 20-day, 50-day, and 100-day moving averages, confirming a short-term bearish structure. The MACD lines have crossed bearishly downward (DIF: -180.42, DEA: -49.13), with the green bars continuing to expand and no sign of waning downward momentum. The 79,378 Bollinger middle band and 79,456 previous high form double resistance above, while the $79,000 level has shifted from support to resistance. If 78,326 (the Bollinger lower band) is decisively breached, it will open room toward 77,600 and even
BTC-0.17%
ETH+0.76%
Buy Signal 🟢
$BTC 1W
post-image
BTC-0.17%
Crypto Circle Academician: Ethereum (ETH) retains its bullish backdrop on the 9.9 broader cycle; how to respond to short-term pressure? Latest market analysis reference
  
Ethereum is currently priced at 2490. Those who are bullish believe the trend has already reversed upward, with pullbacks presenting opportunities to enter; those who are bearish believe this rebound has reached its limit and a pullback could arrive at any time. The current price around 2482 is caught in the middle: chasing higher risks getting trapped, while buying the dip risks further downside. The most common mistake ret
ETH+0.73%
Gold above 4380, take profits😄 Time to rest—we’ve exceeded today’s target. Rest up, brothers. If needed, we can place another trade later, haha.
post-image
  • 3
I did nothing—just went to the bathroom, and when I came back, the candlestick chart had already done the work for me.

A few days ago in the early hours, $BEAT was still stalling at a high level, with no volume behind the rebound. Every push upward was just short of breaking through—classic bull-trap vibes. Without hesitation, I opened a short position, entering around 0.1339. All that was left was to wait for it to expose itself. 📉

I just opened the chart, and the current price had already fallen to 0.1289, with floating profit at +72.05%. This move has been delicious; the guys on board
post-image
BEAT-3.84%
ETH+0.73%
SNDK-0.02%
I originally wanted to cut my losses and sacrifice to the heavens, but the ritual failed and the meat cooked itself. A few days ago in the afternoon, I was still watching $XRP ’s bottoming action. Buying pressure had clearly strengthened, and the bottom structure was becoming increasingly solid. I said at the time that this was a position worth taking a chance on, so I opened a long. Entry price: 1.3837; current price: 1.427. I’ve taken 80% off the table, and I’ll let the rest run. The sleepless nights were worth it, brothers—the dip buyers in this wave should all be waking up smiling. In term
post-image
XRP+2.91%
ADA+3.12%
ETH+0.73%
#BIST has broken below the trend on the weekly chart we drew in the past. Even if it reacts again, it still hasn’t broken above either the peak or the trend. Pay close attention until this week’s close; it’s not a comfortable environment at all, and it will probably see a correction. Weak.
post-image
On the 4-hour cycle, Shenbing Mars formed a Ruyi Jingu Bang candlestick at 20:00 on September 8; Mercury turned from green to red, and the Myth, Retail, Whales, and Institutions indicators turned from green to red, signaling that Wall Street’s major players may be bottom-fishing and driving prices up! A bullish trend reversal and breakout upward are highly likely again! The U.S. Treasury may very well release more positive news again! Long, long, long—financial freedom is not a dream!
post-image
Load More

Join 40 M users in our growing community

⚡️ Join 40 M users in the crypto craze discussion

💬 Engage with your favorite top creators

👍 See what interests you