





Share your thoughts
placeholder
Article
Who’s riding the $MARSCOIN rocket to the final target? 🚀
post-image
CryptoSat
$MARSCOIN is already up 100%+ today, but the chart is still holding a bullish structure.
Price is currently staying above the short-term moving averages, and if buyers keep defending the pullbacks, I’m watching for another leg higher.
For those who want to take a long bet, here’s my setup:
Entry: 0.120 – 0.108
Stoploss: 0.104
Targets: 0.13, 0.144, 0.156, 0.17, 0.20, 0.30
Key area to watch is 0.12-0.11 If it holds as support, the upside targets remain in play.
Keep the position size small and don’t chase green candles.
Let’s see if the bulls have another move left. 👀
repost-content-media
MARSCOIN+74.11%
🚨 CATI/USDT SHORT TRADE 🚨
📉 Entry: 0.066 – 0.070 USDT
🛑 Stop Loss: 0.072 USDT
🎯 Take Profit:
• TP1: +50%
• TP2: +100%
• TP3: +200%
• TP4: +300%
⚠️ Risk Management:
Trade with proper position size & always use SL.
Market conditions can change quickly — DYOR.
$CATI #CryptoTrading #ShortTrade #TradingSignals #harrycrypto
CATI+19.84%
A few days ago, I was still calculating whether I had enough money for instant noodles this month; this morning, I was already wondering whether to add sausage. This wave from $BTC has really come through, with the opening price moving from 77967.8 to 79734.3 and delivering +393.09% gains—truly a lifeline.

Thinking back, when I took that last look before bed a few days ago, the market was still consolidating on declining volume. I judged that the bottom structure had already fully formed, and all it needed was a bullish candle to confirm the direction. As soon as the market opened today, it
post-image
BTC-1.89%
SOL-2.35%
ZEC+7.78%
Why is everyone long $H /USDT while the 4h chart screams 95% short conviction?

$H /USDT - SHORT

Trade Plan:
Entry: 0.07975 – 0.08055
SL: 0.08400
TP1: 0.07726
TP2: 0.07534
TP3: 0.07246

Why this setup?
- Daily trend is bearish, and the 4h signal just armed a SHORT at 0.08015 with 95% confidence.
- RSI 15m at 44.53 shows zero momentum to the upside—weakness is the story.
- Targets are stacked: TP1 0.07726 (-3.6%), TP2 0.07534 (-6%), TP3 0.07246 (-9.6%).
- Invalidation sits at 0.08400, but the alt-long setup needs a break above 0.08304—that’s a trap door, not a ladder.
- Why now? Pri
H+3.17%
Play with the lucky ones.
If you make money, everything you say is right.
Stay away from contrarians; they either question everything or complain.
Some people are clearly making money, yet they seem to be in more pain than those who are losing money. How are you supposed to get rich?
A profitable trade is a successful trade even if it only makes 10U. If you treat every 10U you earn as 100,000U, you will soon make 1,000,000U. Opportunities favor those who are prepared, as well as those who are optimistic.
Making money from speculation is painful. Big-cap meme coins all go through extreme shakeo
post-image
MEME+1.87%
$DOGE broke out — but $1 isn’t the signal to watch yet.
The immediate target is $0.12, while the 2-week LMACD is approaching a potential bullish cross. Historical similarities can add context, but they don’t guarantee the same outcome.
With ~155.8B DOGE circulating, $1 would imply a $155B+ market cap — requiring major demand and liquidity.
$0.12 → near-term target
Hold breakout → confirmation
Lose breakout → setup weakens
$1 is a scenario, not a prediction.
What level are you watching?
#DOGE #Dogecoin #Gateio
post-image
DOGE-3.36%
  • 4
( new streamer) market overview
live-cover
LIVE331
$$Lobster's 29% gain: 87M in trading volume shows you what turnover-based distribution looks like
The price of 0.0938 is stuck between 0.1027 and 0.0711, with trapped holders above and profit-taking holders below. Going long here is just handing fees to the market maker. My system shows that the 0.0711–0.1027 range has already seen massive volume, but the price has failed to make a new high—a textbook distribution structure.
Here's the trading plan: Entry zone: enter only after a pullback to 0.084–0.086 holds; abandon the trade if it breaks 0.083. Stop-loss: 0.0805 (hard stop; a break below me
龙虾+29.85%
No big-picture thinking, I can’t hold on—the profit on this trade is razor-thin, but I love it. After lunch, when I checked the chart, $DASH hovered around 43.27 for ages, with each wave of buying stronger than the last, and I knew someone was about to make a move. I went long and followed in; it’s now at 59.08, +1753.07%. It was truly sluggish at first, but once it broke out, it felt incredible. The money you make is the realization of your understanding; the money you lose exposes the gaps in it. Take profit on 80% first, and set a good protective stop for the remaining 20%. Let it run when
post-image
DASH+31.57%
LAB-0.12%
BTC-1.89%
$VELVET is mainly shorting; always shorting, making a killing—feels great.
post-image
VELVET-19.06%
This is a support level for $CATE on a high timeframe. I don't think the price will spend much time here, as it showed strength during this pullback
post-image
CATE-11.75%
Everyone’s watching 718, but the real trap is the range above 730—are you shorting the fakeout?

$BNB /USDT - SHORT

Trade Plan:
Entry: 716.83 – 719.47
SL: 730.78
TP1: 708.68
TP2: 702.37
TP3: 692.90

Why this setup?
- BNB sits at 718.15 with a 4h SHORT bias (55% confidence) while the 1D trend chops sideways—no momentum to break higher.
- RSI (15m) at 47.84 shows zero buying pressure; ATR (1h) at 5.26 means moves are tight, but TP1 at 708.68 is a clean 1.3% drop from entry.
- Why now? Price is “Armed” below resistance—if 719.47 holds as the ceiling, downside to 702.37 (TP2) opens fast, b
BNB-0.70%
This yield is making me nervous, and I’m worried the market will come to its senses tomorrow and blacklist me. 😂 When I checked the charts after lunch, $NIL made another push, but it clearly lacked follow-through, with shrinking volume and insufficient support. Every surge looked like a test. Seeing this setup, I knew it was a classic bull trap: the key resistance above was substantial, and there would be no one to take it higher. I told my friends right then, don’t chase it—wait until it runs out of steam; that’s our opportunity. Sure enough, it started falling in the afternoon and kept grin
post-image
NIL-0.97%
XRP-4.11%
LAB-0.12%
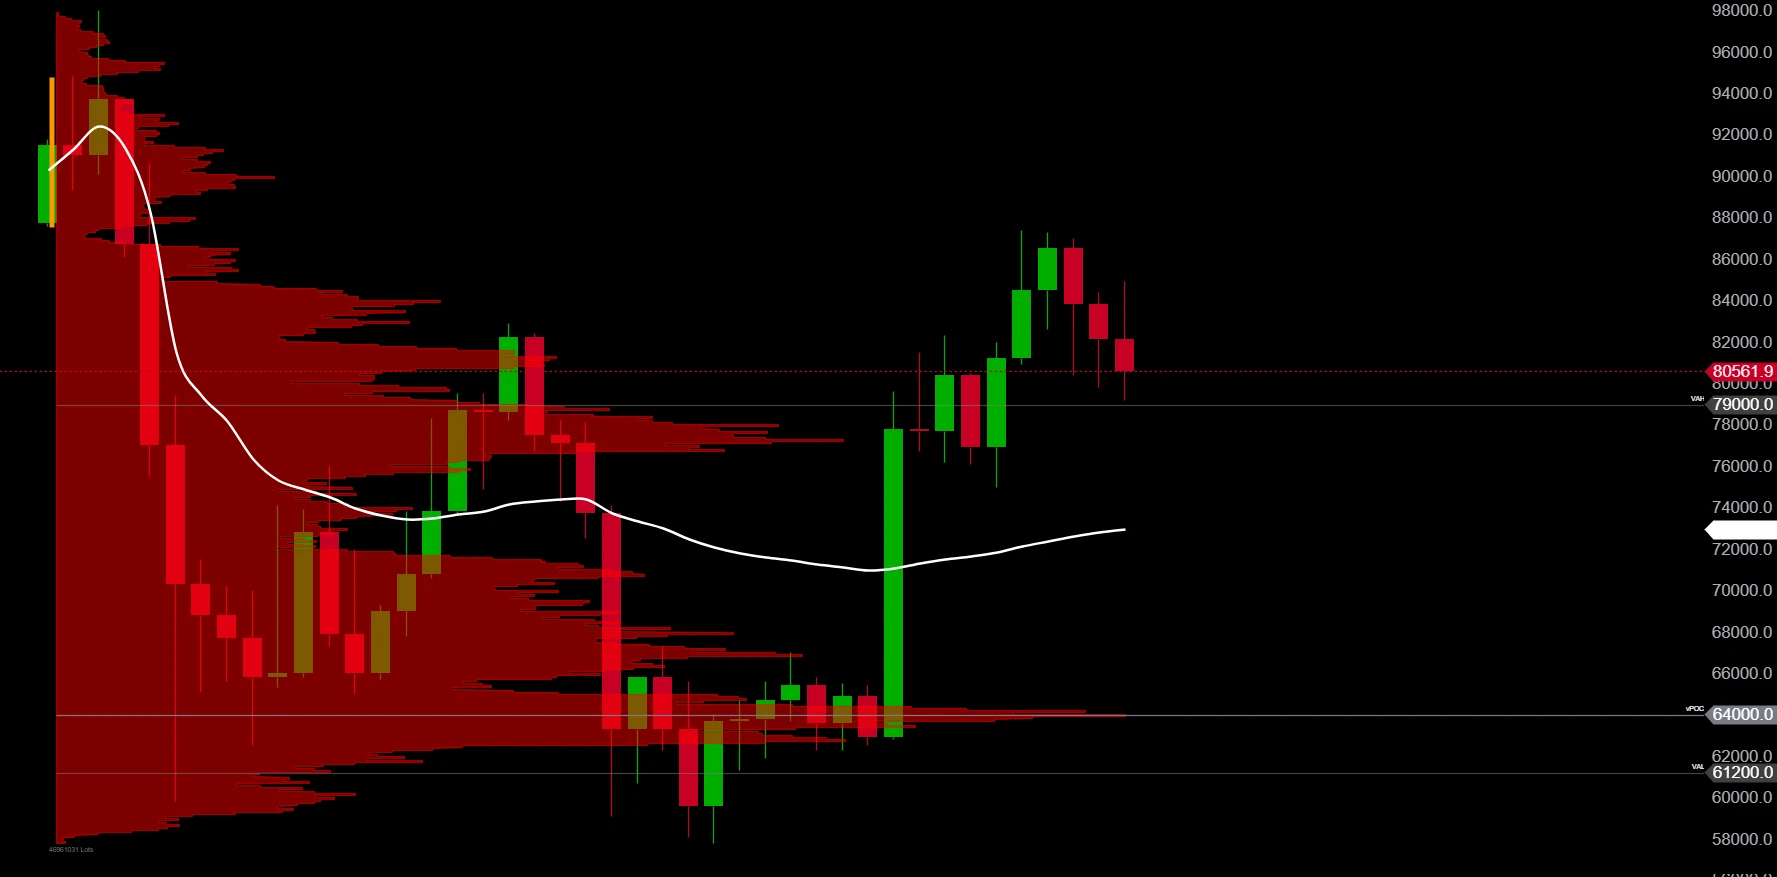
$BTC recovers $81K with $ZEC leading a massive market-wide rally! 💥
The bulls are displaying absolute dominance across the board while $BTC rebounds strongly above $81,000, reigniting momentum across major assets. ⚡ $ZEC delivers a textbook breakout performance with an explosive +16.9% surge, while $XRP attracts strong demand to surge ahead +8.7% of the market leaders. 📈
Capital is rapidly rotating from sidelined liquidity directly into high-beta assets, creating high-speed order flow toward key resistance targets on higher timeframes. 📊 When privacy coins and heavyweight assets expan
BTC-1.86%
ZEC+7.96%
XRP-4.11%
Everyone’s long $CL /USDT at 91.15, but the 4h tape is quietly screaming for a fade.

$CL /USDT - SHORT

Trade Plan:
Entry: 90.98 – 91.32
SL: 92.82
TP1: 89.90
TP2: 89.06
TP3: 87.81

Why this setup?
Why now?
- 1D is a **range**, not a breakout—so 91.15 is resistance, not support.
- RSI on the 15m is only 56, meaning no momentum spike to chase longs.
- ATR (1h) at 0.69 shows volatility is compressing—ranges snap fast.
- Short setup targets 89.90 (TP1) then 89.06 (TP2), while invalidation sits at 88.47.
- Confidence is 55.4—not a home run, but a high-probability scalp if 91.32 holds.
CL-0.83%
No trades, no analysis, just pure luck—this result is embarrassing even to talk about. But a review is still necessary. The moment I opened the chart this morning, I could see that the resistance above was clearly strong. Volume failed to follow, and selling pressure was intense—isn't this textbook helplessness?
I decisively placed a short at 0.01052. I just took a glance: 0.00739, with a +1437.41% return. Staying up wasn't in vain; I nailed this move.
I'm closing the position with the +1437.41% gain now and locking in the profits. I'll move the stop-loss on the remaining 20% up to the entry p
post-image
LAB-0.12%
BTC-1.89%
$MEMECOIN bleeding
post-image
MEMECOIN-47.14%
$ETH Signal】1H momentum exhaustion, bearish continuation
$ETH 1H MACD histogram -7.17, RSI 43.38, price is moving along the lower edge of the Bollinger middle band, with volume shrinking to 28K. The 4H MACD bullish histogram is shortening, with insufficient buying support. Order book depth imbalance stands at -1.15%, with selling pressure dominant. Funding rate is 0.0021%, with no short-squeeze conditions.
🎯 Direction: Short
⚡ Entry/limit order: 2445.5513 - 2452.9100
🛑 Stop-loss: 2477.4391
🚀 Target 1: 2416.1163
🚀 Target 2: 2397.7195
🛡️Trade management:
- Execution strategy: After reach
post-image
ETH-1.97%
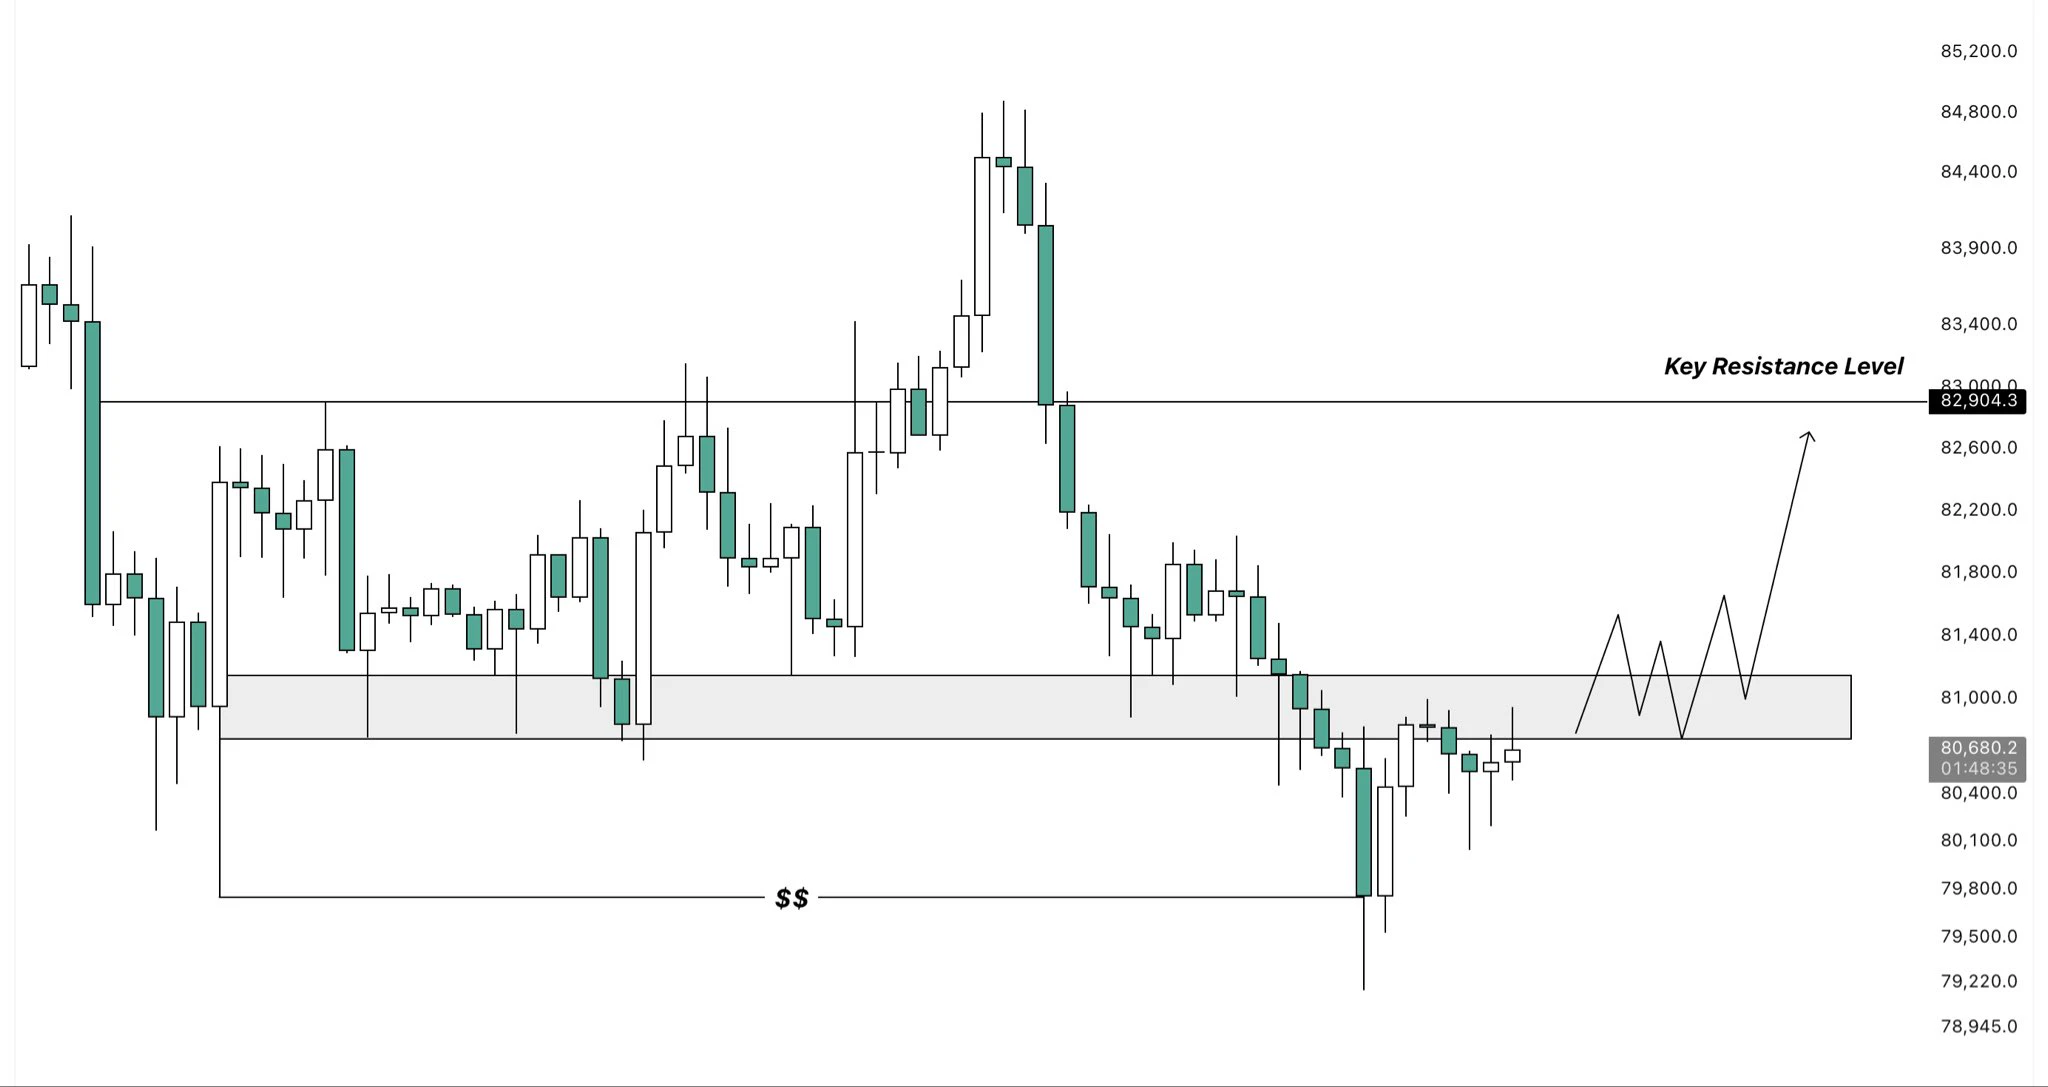
Everyone’s long BTC at 79.6K—but the 4h tape just whispered a different name.

$BTC /USDT - SHORT

Trade Plan:
Entry: 79535.51 – 79792.77
SL: 80898.98
TP1: 78738.01
TP2: 78120.59
TP3: 77194.46

Why this setup?
Why now? The 1D is rangebound, not trending—so this is a scalp, not a story. With RSI on the 15m at 48.67 (no momentum), and ATR at 514 showing tight squeeze potential, the path of least resistance is down to TP1 at 78,738. If that breaks, TP2 at 78,120 is a magnet. The invalidation at 78,954 is your line in the sand—if price reclaims it, the short thesis dies instantly.

Debate:
Are
BTC-1.89%
Load More

Join 40 M users in our growing community

⚡️ Join 40 M users in the crypto craze discussion

💬 Engage with your favorite top creators

👍 See what interests you

View More