
Square
Following
Hot
News
Notifications
Profile
Share your thoughts
placeholder
Article
Signal 5
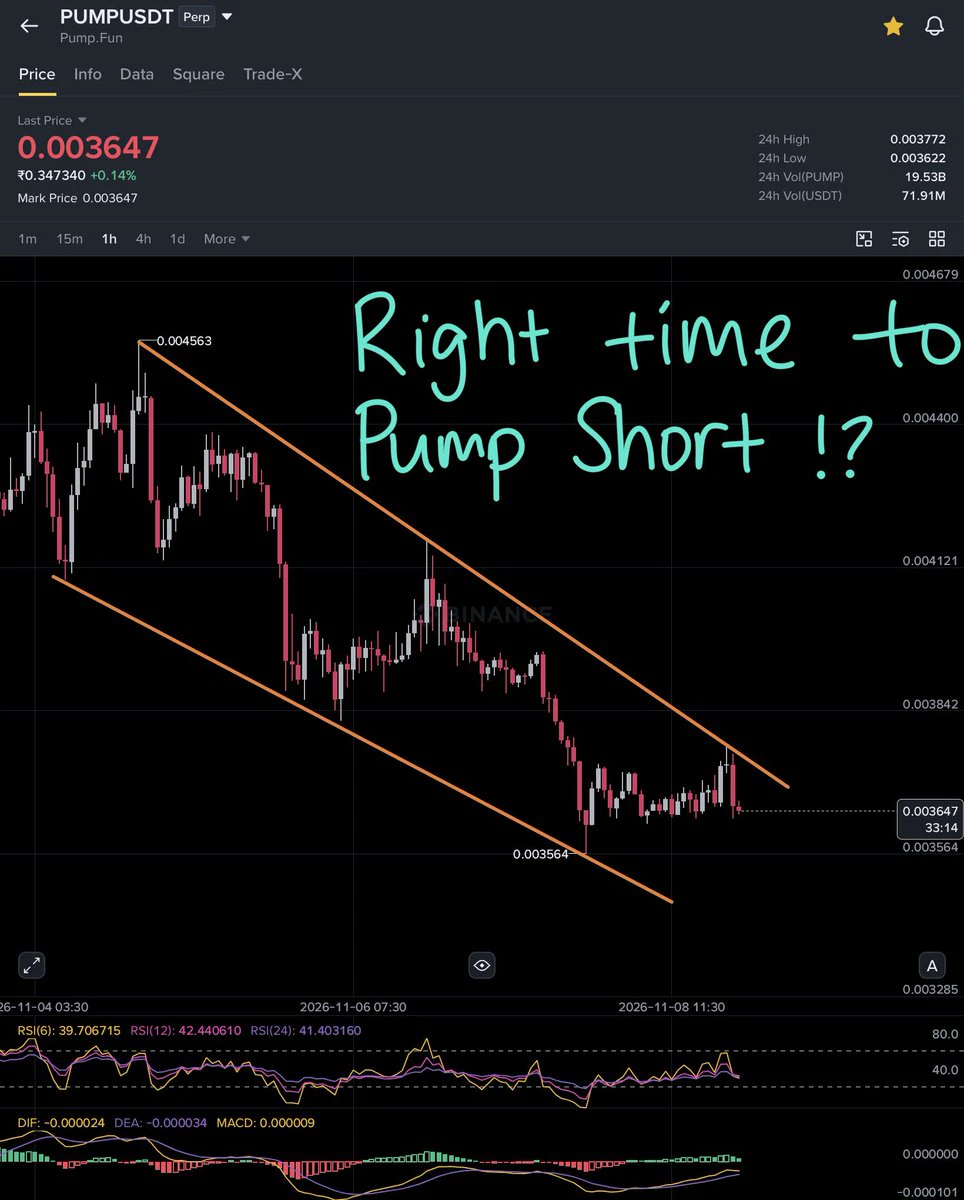
Looking at Pump dot fun, we are clearly observing a descending channel pattern, an absolute structure with lower lows and higher lowers, continuously rejecting at the upper trendline (higher low peaks) and consequently holding lower trendline support (lower lows).
If $PUMP comes to the upper trendline again, I would like to take a risky short position by maintaining an SL at 3850 and entry at 3750-3820. Targets would be 3630, 3500, 3400. Leverage is 25x and using 2% of funds only.
post-image
PUMP-0.99%
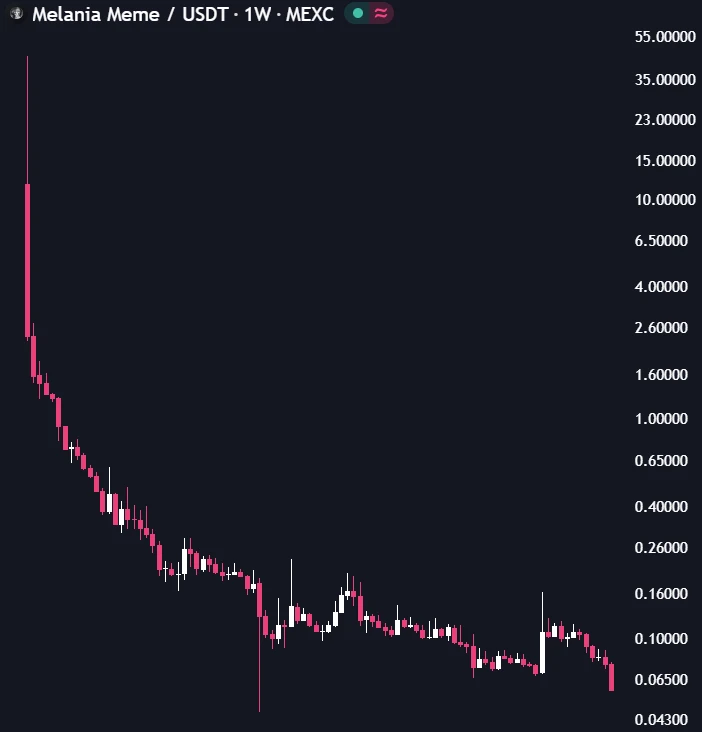
If you had invested $10K in $MELANIA last year, you would have just $14 today
Brutal
post-image
MELANIA-2.90%
Trenches
ZIG
Z
bade
b
ZIG
0x8c...1145
Market Cap
$.
Change
.
24h Vol
$.
Holders
.
STONK
S
bade
b
STONK
6GmA...UNgx
Market Cap
$.
Change
.
24h Vol
$.
Holders
.
CLAUDIA
C
bade
b
CLAUDIA
2j5S...W2ZM
Market Cap
$.
Change
.
24h Vol
$.
Holders
.
FLOAT
F
bade
b
FLOAT
Bv1a...BMmr
Market Cap
$.
Change
.
24h Vol
$.
Holders
.
BTC
B
bade
b
BTC
C5xp...pump
Market Cap
$.
Change
.
24h Vol
$.
Holders
.
Both parties want to make this election about Israel, but voters aren’t buying it. Only 4% of people rank foreign policy as their top issue, and Gaza ranks near the bottom in the polls. Politicians make a big show of it on camera, but when they get home, they’re still talking about gas prices and rent. I set my stop-loss too tight last time and got stopped out twice. I learned my lesson: admit when you’ve got the direction wrong, but don’t let the noise lead you astray. Maybe I’ve got it wrong again. Just waiting to get proven wrong. #U.S.Election
post-image
Just clicked my first 500 snap score on Snapchat…
How much are these points worth in $$$?
post-image
After a large bearish candle pushed prices down, BTC hit a low near 748, while ETH headed straight for 2200. BTC and ETH barely moved after the nonfarm payrolls data came out.
The market is currently consolidating at low levels, which is the most frustrating phase.
Many people are trapped in positions here, and their mindset falls apart.
Watching the market swing back and forth, they alternately want to add to their positions to lower their average cost and fear a further breakdown. Holding is painful, but cutting losses feels hard to accept.
$BTC ‌
Low-level consolidation does not mean the m
BTC-0.65%
ETH-1.23%
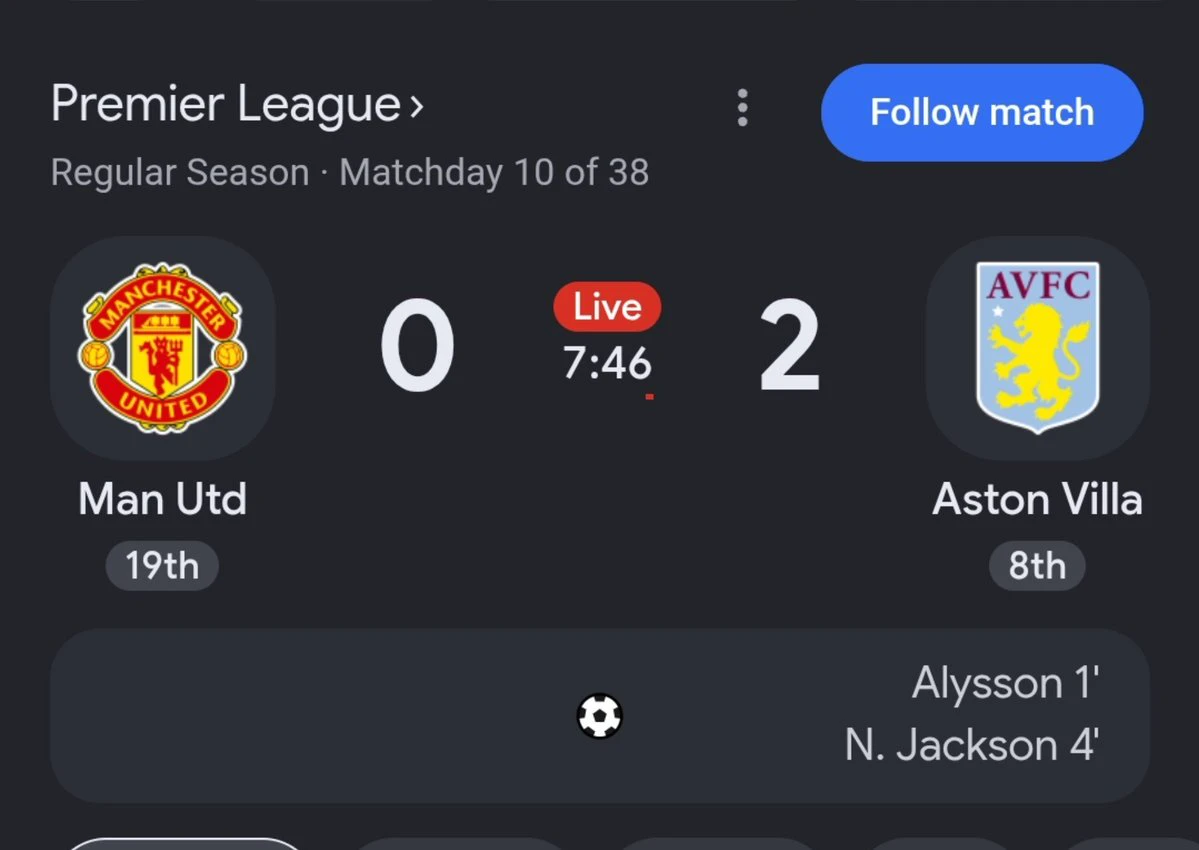
What's really happening to Man Utd? They luckily escaped Roma, they won't escape Aston Villa
post-image
#Ahr999EntersBottomBuyingZone
AHR999 Enters the Bottom Buying Zone – Is Bitcoin Preparing for Its Next Big Opportunity? ₿
The cryptocurrency market is constantly moving through different cycles of fear, uncertainty, corrections, and recovery. However, some market indicators can help investors understand when Bitcoin may be approaching an attractive long-term accumulation zone. One indicator that has attracted attention among crypto enthusiasts is the AHR999 Indicator.
The latest visual concept highlights an important message: AHR999 is entering the bottom buying zone, potentially creating an
BTC-0.67%
$JCT BOOM💣 continues to rip higher, hitting take profit (SL is in profit). I’m re-entering here with a small position. The funding rate is positive, so everyone should manage position sizes carefully. A major recent lesson$IRYS $AKE shows that it could surge 2000%; a 1000% gain in a day is also possible. Stay disciplined to make money in the market, everyone💸💸🙈
post-image
JCT-3.26%
IRYS-22.27%
AKE+6.07%
#70%OfAltcoinsFallBelow200DMA
70% of Altcoins Fall Below the 200-Day Moving Average: Is the Altcoin Market Facing a Major Turning Point?
The cryptocurrency market is sending an important warning signal as approximately 70% of altcoins have reportedly fallen below their 200-day moving average (200 DMA). This development highlights the growing weakness across the altcoin market and raises important questions about investor confidence, market momentum, and the possibility of further downside.
The 200-day moving average is one of the most widely followed technical indicators in financial markets
BTC-0.67%
STABLE-1.39%
Bitcoin ETFs saw a net outflow of $412 million, with BlackRock’s IBIT posting a net outflow of $403
live-cover
LIVE2,671
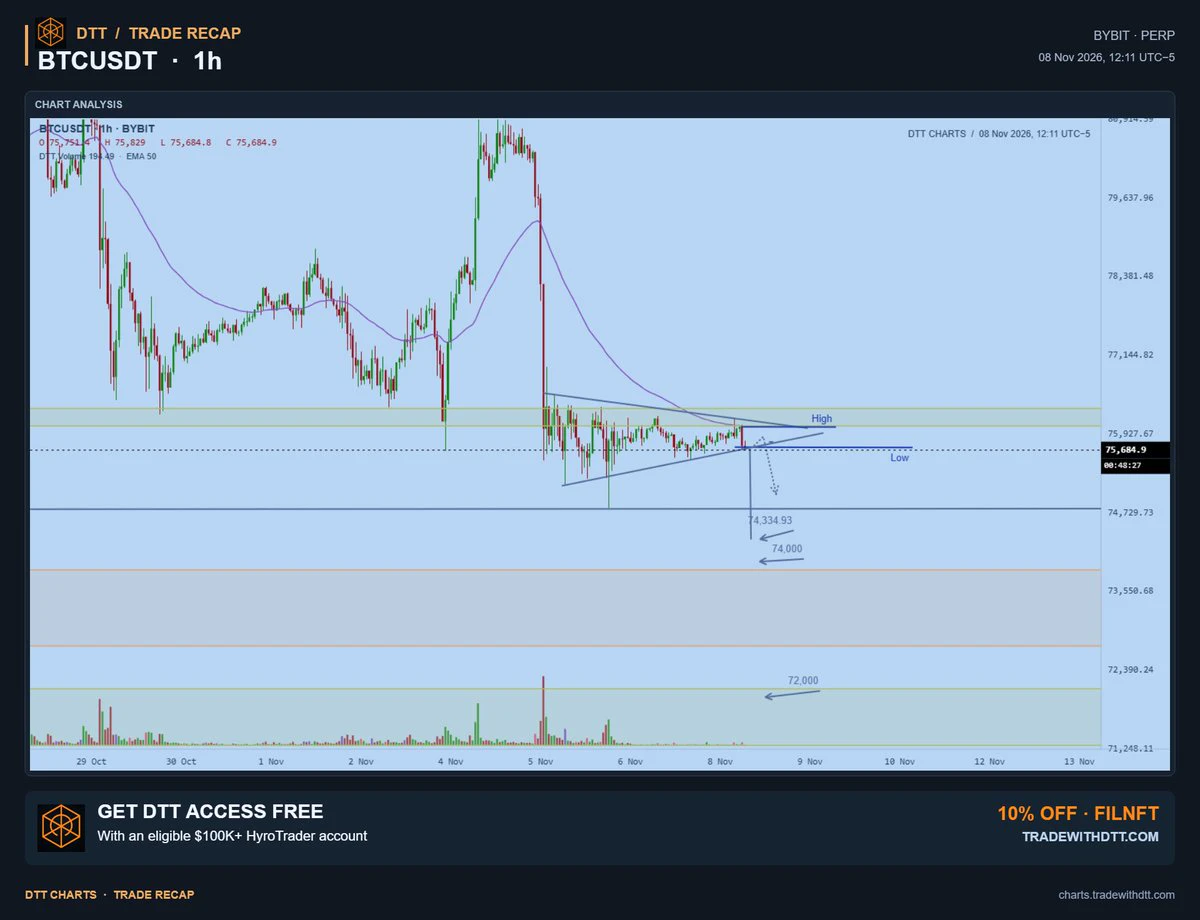
Whose ready for 74k? ETA Today.
$btc
post-image
BTC-0.67%
[Trending Topic] Prediction Market Put the Odds of Bitcoin Rising to 70,000 by the end of year
live-cover
LIVE1,199
Traders, take note. 🚨These coins are going to plunge starting now. 📉🚨Open short positions and make a big profit afterward$AIO - 0.025$JCT - 0.0030$AIOT - 0.070
post-image
AIO-3.19%
JCT-3.26%
AIOT-2.28%
Crypto isn’t against human nature; it caters to it intensely—and making money is what goes against human nature.
There’s a big difference between these two statements. Confusing them will cost you money.
I. How crypto exploits your instincts
① Get-rich-quick narratives
What you see in your feed is always “turn 5,000 into 5 million.” Nobody posts “30% annualized returns over three years.”
Because the former ignites your instincts, while the latter gets no traffic.
So your frame of reference is systematically distorted.
② Open 24 hours a day
Traditional markets close, forcing you to calm down.
C
post-image
BTC-0.65%
Asia buys, buys, buys, Europe and the U.S. sell, sell, sell
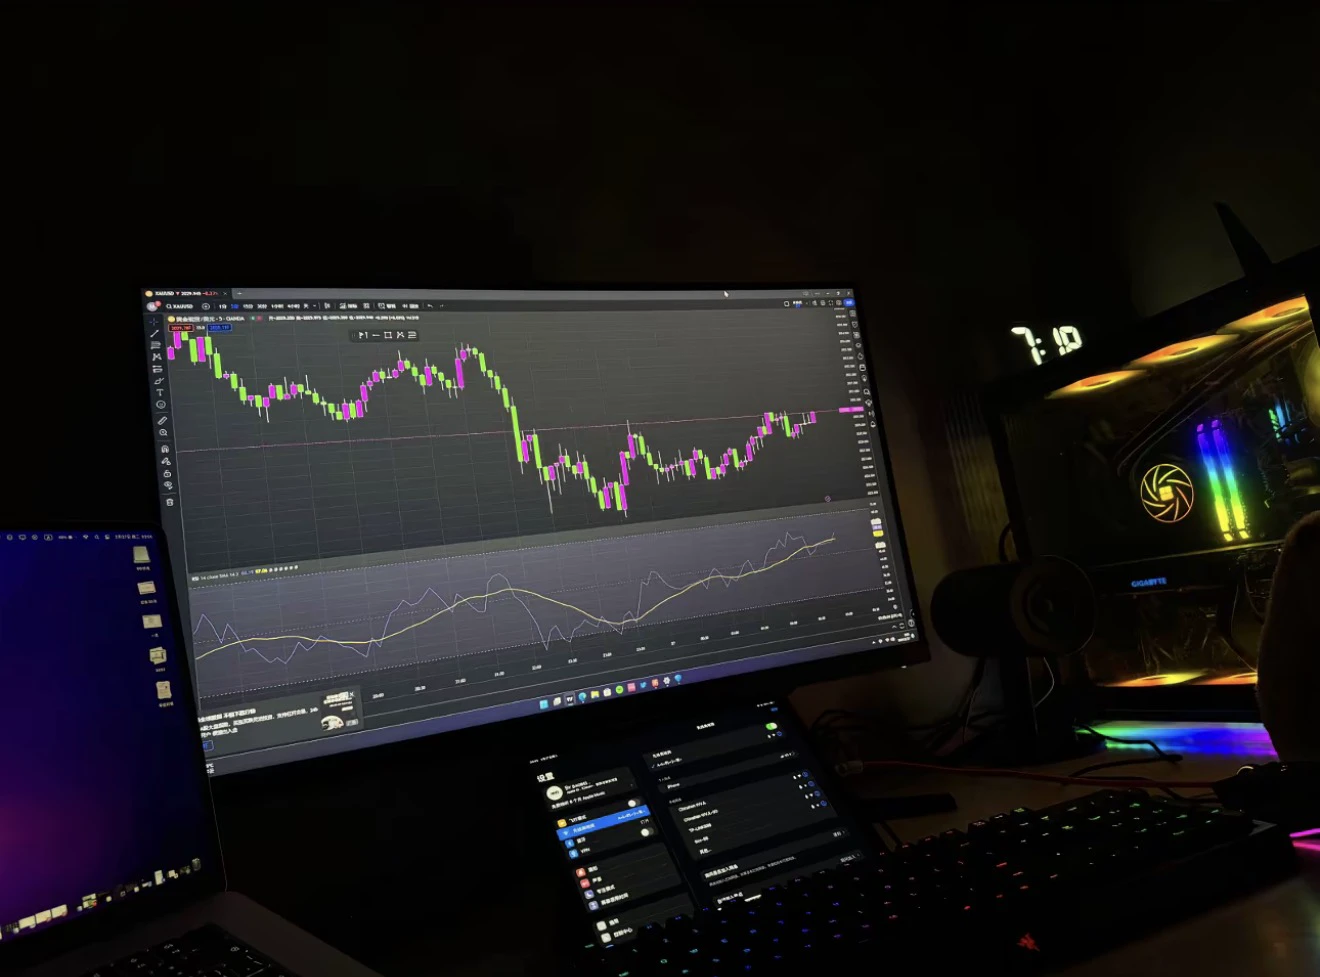
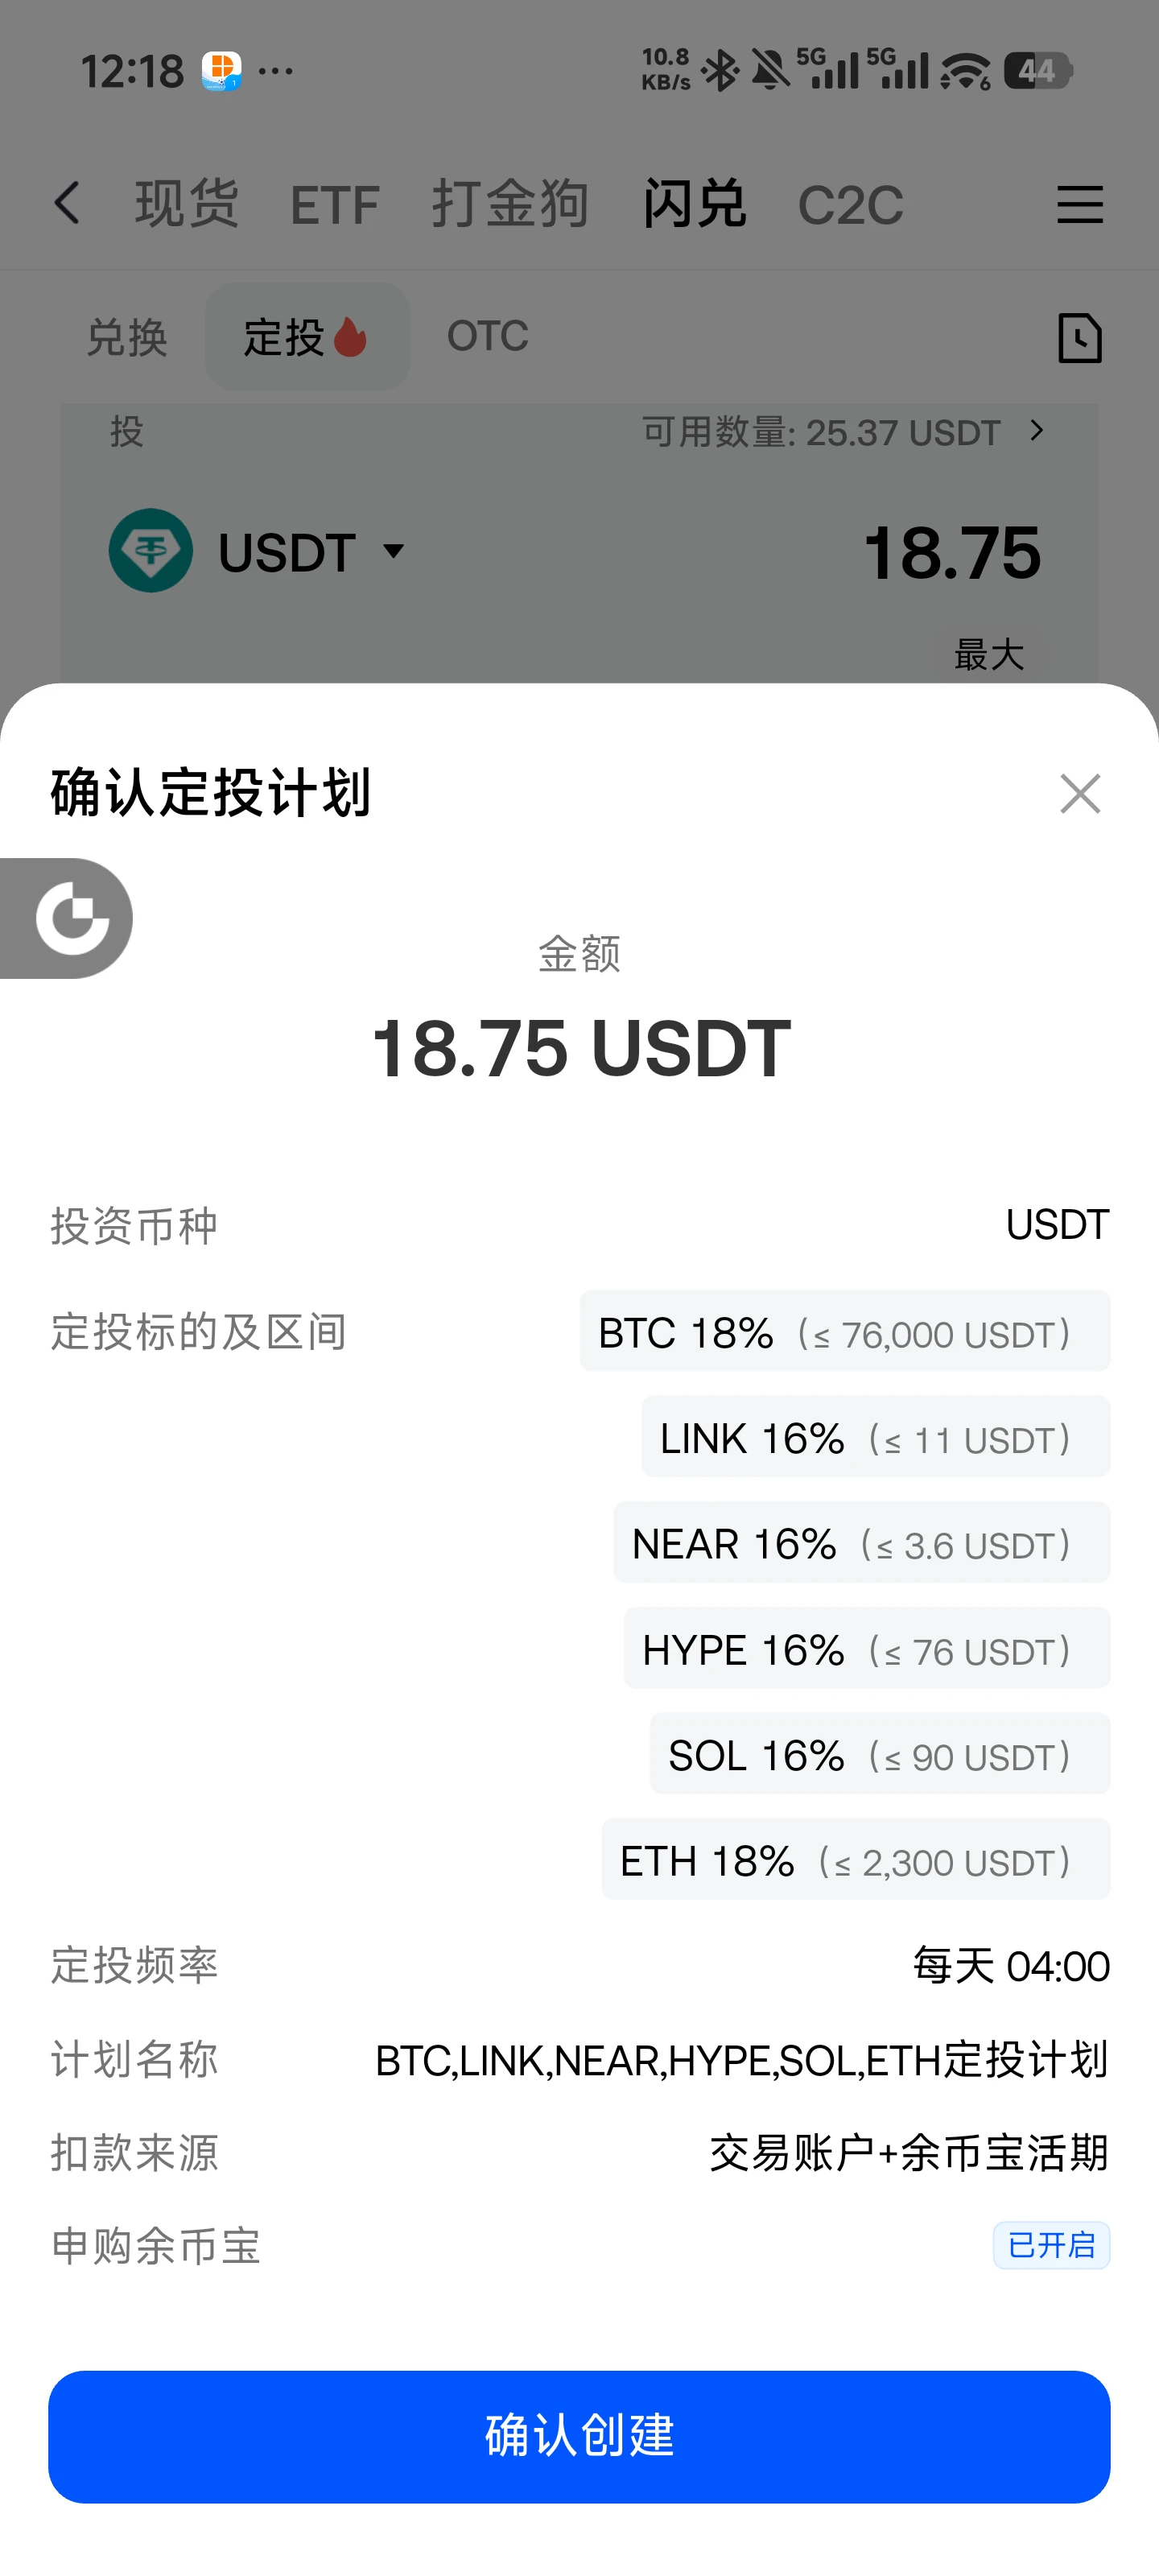
The portfolio starts with just 500 USDT; take a large position and add funds once it becomes profitable
As always, the main focus is BTC + ETH
NEAR HYPE SOL LINK SUI, full speed ahead
post-image
BTC-0.67%
ETH-1.26%
HYPE+0.24%
SOL-0.77%
SUI-1.05%
  • 1
2026.11.9
Daily/weekly entry point: 2241
Resistance levels above: 2250-2270-2286-2295-2306
Support levels below: 2236-2230-2220-2205-2175
At all support and resistance levels, stop out on the first break, or take a rebound trade if the level holds; if it breaks again, follow the trend.
The outlook is bullish toward 2286; watch 2205-2175 below 2250. If the price holds firm, favor buying at lows; otherwise, favor selling at highs. Personal advice for reference only! Follow Brother Pang’s daily livestream! #BTCETF资金持续流出 $ETH
ETH-1.23%
Load More

Join 40 M users in our growing community

⚡️ Join 40 M users in the crypto craze discussion

💬 Engage with your favorite top creators

👍 See what interests you

Trending Topics

USCPIDataIncoming

12.56k Views1.63k Discussing

The U.S. October CPI report will be released on November 10 at 8:30 a.m. ET. September CPI came in at 3.7% year over year, and markets will be watching closely for signs that inflation is cooling, especially in core CPI. A softer-than-expected reading could strengthen rate-cut expectations, while hotter inflation may pressure risk assets through higher Treasury yields and a stronger dollar. How do you think this CPI print will move $BTC, U.S. stocks and gold?

USAIStocksHitHard

28.11k Views3.74k Discussing

USNonfarmPayrolls

53.62k Views4.48k Discussing
View More