Share your thoughts
placeholder
Article
solana:Dz9mQ9NzkBcCsuGPFJ3r1bS4wgqKMHBPiVuniW8Mbonk doing exactly what we wanted.
We had the reclaim, price held the important zone and then started grinding higher — and now we’re sitting around +26% from the move.
This is the part of trading I actually enjoy.
You wait. You watch the setup develop.
Everyone else starts asking “is it too late?” — while the chart is literally showing you the answer.
Then you enter, stop touching everything, and let the candles cook. 🍳+$26% and counting.
No need to nail the perfect entry.
No need to sell the exact top.
Just catch the meat of the move and let th
post-image
SOL-0.82%
Nobody is talking about this SYMBOL setup hiding in plain sight

$NEAR /USDT - LONG

Trade Plan:
Entry: 2.3332 – 2.3582
SL: 2.2253
TP1: 2.4360
TP2: 2.4962
TP3: 2.5864

Why this setup?
Why now? The daily trend is bullish, the 1h RSI sits at 47.83 showing room to run, and the 1h ATR of 0.050153 confirms volatility is alive. The entry zone between 2.3332 and 2.3582 aligns with the 1h price of 2.3457, giving a clean reference point. TP1 at 2.4360 and TP2 at 2.4962 project measured moves that respect the current momentum, while the invalidation level of 2.1002 is the hard line that must hold. Tr
NEAR+1.91%
Life is a constant cycle between losing your spark and finding it again
Good night 🌹
post-image
Why is everyone suddenly watching silver at 66.06?

$XAG /USDT - SHORT

Trade Plan:
Entry: 65.95 – 66.17
SL: 67.13
TP1: 65.26
TP2: 64.73
TP3: 63.93

Why this setup?
Why now? The 1h price is sitting at 66.06 inside a narrow range, the 15m RSI is at 42.3 showing weak momentum, and the 1h ATR of 0.444764 tells us volatility is still contained. The daily trend is range-bound, which means a directional break from the entry zone between 65.95 and 66.17 could accelerate fast toward TP1 at 65.26 and then TP2 at 64.73. The invalidation level at 66.70 is the line in the sand that protects this setup.
XAG-0.45%
The meme coin market is never short of legends. Recently, although $USELESS jokingly describes itself as “completely useless,” the strong conviction of its loyal community and KOLs has driven up market sentiment. After several major exchanges launched perpetual contracts, capital inflows became evident. Assets with no fundamentals and driven purely by chip-based speculation are precisely the hunting grounds of professional traders.
Seeing the opportunity, I opened a 50x long position on USELESSUSDT on Gate. The average entry price was 0.21848, and as the market broke out strongly, the latest
post-image
USELESS+17.50%
BTC-1.03%
ETH-0.27%
I had just switched the app to the background, and it shot right back up—are you playing hide-and-seek with me? 🙃

The last thing I looked at before bed was $MU . It was still hovering around 934.48, repeatedly testing the level without breaking through, while volume was slowly picking back up. Honestly, I had hesitated at the time about whether to reduce my position, but then I realized: bottoming out is the ultimate test of patience. Only by holding your position can you wait for the market to move.

Looking again today, it’s at 1006.66, already up +509.97%. The wait wasn’t in vain.

Don’
post-image
MU-3.12%
ETH-0.27%
LAB-1.27%
I didn’t chase $ARB ’s intraday surge because a long-term trendline was sitting right above it, making it difficult to place a stop-loss properly. I waited for it to pull back and reclaim support before entering a long position based on the lower-timeframe structure.
After entering, it consolidated for a while. I didn’t rush to trade back and forth; once the price moved a certain distance away from my entry zone, I closed 80% first to lock in profits, leaving the remaining 20% to follow the trend.
After the breakout candlestick appeared, the profits from the +1230.67% position were taken off th
post-image
ARB-0.87%
XRP+2.26%
SOL-0.82%
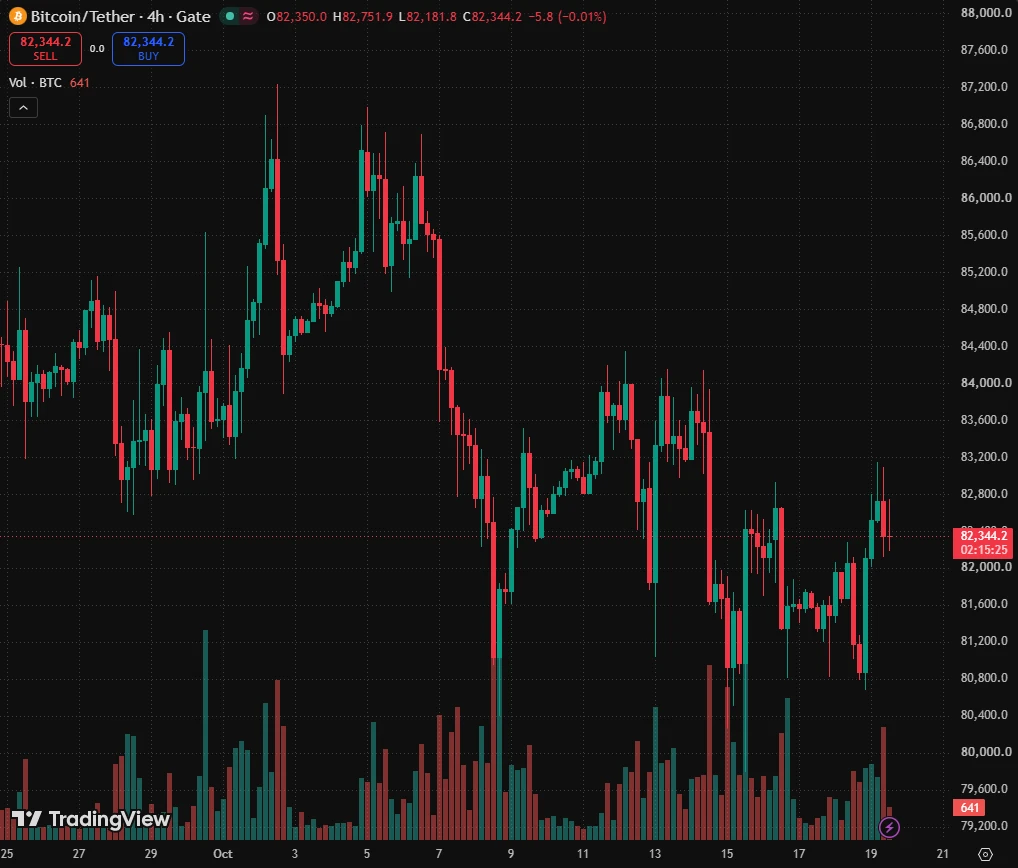
Will Bitcoin keep sliding all the way to 75000? Let’s discuss.
After two consecutive days of declines, I believe many friends are watching 75000. Of course, like everyone else, I’d prefer a straight drop, but from the hourly chart, the two key supports in this pullback are 78300 and 77600, the hourly moving averages and the dense support zone formed by positions from the previous pullback.
If the price retests this range and the hourly K-line stops falling and shows signs of stabilization, it means the short-term pullback is complete, and the bulls still have the momentum to counterattack.
Tra
post-image
BTC-1.03%
ETH-0.26%
The 【AKE】 that leaves shorts unable to let go
【Next, get ready to trap the longs with all kinds of “bull traps”】Shorts already have ✔️ a shadow over it🈶, and only a small number of shorts have participated so far
So the market action we see is all about pumping hard and dumping, desperately baiting longs😂
post-image
AKE-2.15%
  • 2
this one seems interesting $XBT
if it catches attention from OG Bitcoin holders it could get stupid fast
these guys held BTC for years, you really think they’re selling a meme for a 10x or 20x?
feels like a proper holder coin to me
might be worth sizing into ngl
post-image
BTC-1.03%
Layout for Bitcoin, Ethereum, and Dogecoin
live-cover
LIVE1,498
I originally wanted to cut the position and call it a day, but it turned around on its own and handed the meat back. While $HOLO was bottoming out intraday, that line never broke the key level—it kept sweeping back and forth around it. I judged that the main force was still in, and that this was not a distribution pattern, so I told everyone to watch for opportunities to go long then.

Looking at it now, the long entered at 0.06140 is already floating at 0.06464, with returns reaching +266.08%. This is a satisfying bite. The premise of compounding is staying alive; the shortcut to getting ric
post-image
HOLO-2.36%
DOGE-0.30%
SNDK-0.72%
$Bull Run whale addresses continue accumulating, with holdings concentration hitting a new high! Retail FOMO is intensifying—how far can this wave go?#Gate.io 🔥
牛来+17.45%
I did nothing—just went to the restroom, and when I came back, the candlestick chart had already done the work for me. A few days ago, I glanced at $SOL before bed. The price was sitting right at 103.42; the key level held, the retest held, and funds were quietly flowing in—not being dragged up for you by one big bullish candle. While everyone else was running, I instead felt it had a chance. When I opened the chart today, it had already moved clearly above 104.05, and +57.56% had simply landed in my account. This profit felt great—staying up late wasn’t for nothing. I took 80% off the table f
post-image
SOL-0.82%
SNDK-0.72%
BNB+1.26%
This return makes me anxious, afraid the market will catch on tomorrow and blacklist me.
While everyone else was running, $TAC rebounded to the upper edge at 0.003206, but failed to break through after grinding against it for two candles. The resistance above was obvious. At a level like this, I would have been letting the chart down if I didn’t take a short. After opening the short, it even gave plenty of room to breathe. Sadly, it couldn’t be bothered to fake a bullish trap and drifted all the way down to 0.002048, delivering a direct return of +559.83%.
I’ve taken 80% off the table and move
post-image
TAC-14.60%
SNDK-0.72%
ZEC+0.15%
This is my “backyard” by the way.
Why would I want to go back to the city?
post-image
$CLS
This chart best explains the process we’ve been through. BoS breakout+liquidity sweep+swing low! Then a double bottom and a comeback
post-image
CLS+6.07%
Prove yourself with results$BTC
BTC-1.03%
Bitcoin is still rebounding on the shorter time frames, but the daily chart remains in a downtrend that cannot be bucked, and the 4-day chart also needs a pullback. This move will probably head to 72,000, I guess. Those who are trapped, don’t panic—the drop is to build a solid foundation, and it’ll still come back up. Good night, Makabaka.
post-image
BTC-1.03%
Load More

Join 40 M users in our growing community

⚡️ Join 40 M users in the crypto craze discussion

💬 Engage with your favorite top creators

👍 See what interests you