Square
Following
Hot
News
Profile
Share your thoughts
placeholder
Article
🚨 BREAKING 🚨
Michael Saylor just posted the Bitcoin tracker again
You know what that usually means… more $BTC could be on the menu.
BTC+0.67%
I broke down the token structure of $PAID ; 0.012918 is the concentrated trading pressure zone after the previous surge. Trapped holders above and short-term profit-takers are adding to the pressure, and buying support breaks down when the rebound reaches this level, leaving the bulls unable to push higher and forcing them into defense.
On the signal side, the price fell from 0.012918 to 0.004218, with a weak rebound and lower lows, indicating that selling pressure continues to be released. Sell orders dominate the order book, confirming weakening capital flows. 10x short return: +667.96%.
Ope
post-image
PAID+4.79%
ACE+0.10%
AKE-5.58%
"Buy Crypto" searches are spiking again.
The last time this happened? 2021, right before the bull run.
post-image
A 79-page report singled out 5 coins, with $AAVE moving from 170.62 to 169.7
$AAVE was singled out by an institutional research report, and its price moved from 170.62 to 169.7 after the event. I’m following suit: bullish at this level, with dip-buying first.

Citrini Research put $AAVE on its fundamental picks list. Funds have yet to follow: 24h trading volume was 12411560 USDT, with a volume ratio of 0.508; OI was 384053.30, with no crowding or leverage. The report arrived first, but positioning hasn’t.

Daily RSI is strong at 58.1, with MA7 above MA30 for the 21st day; the catch is that
AAVE-0.07%
BTC & GT Price Prediction - Will GT Hit $30?
live-cover
LIVE14
solana:AEPBdj3RViMJKCHM1xiVaM1VNuP7VbZRSN68gu5xpump will 2x shortly buy now
AEPBdj3RViMJKCHM1xiVaM1VNuP7VbZRSN68gu5xpump
#crypto $sol
post-image
SOL+0.62%
Nobody is talking about this SYMBOL setup while the 15m RSI whispers oversold.

$US /USDT - LONG

Trade Plan:
Entry: 0.01145 – 0.01219
SL: 0.00722
TP1: 0.01527
TP2: 0.01757
TP3: 0.02102

Why this setup?
Why now? The 4h trend is range-bound, but the 15m RSI sits at 16.82, signaling a sharp exhaustion that often precedes a snap-back move. The 1h ATR of 0.01181 shows the average hourly volatility is compressing into the entry zone between 0.01145 and 0.01219, a tight band where a breakout is overdue. If price pushes to TP1 at 0.01527, it validates the long thesis immediately, with TP2 at 0.017
US-35.97%
$TAO price is moving, but trading volume has yet to respond, which is more worth watching than the 24-hour +2.13% gain.
This time, I’m not looking at the gainers and losers rankings, only the levels. The current price is 291.9, about 4.32% above the 1-hour support at 279.3 and about 2.12% below the resistance at 298.1.
My criteria are simple: only a breakout above 298.1 followed by continuation would count as an upside relay; a break below 279.3 invalidates the previous view. The 1-hour and 4-hour trends are both strong, with RSI at 73 and 69, respectively.
The question now is not a direction
post-image
TAO+2.16%
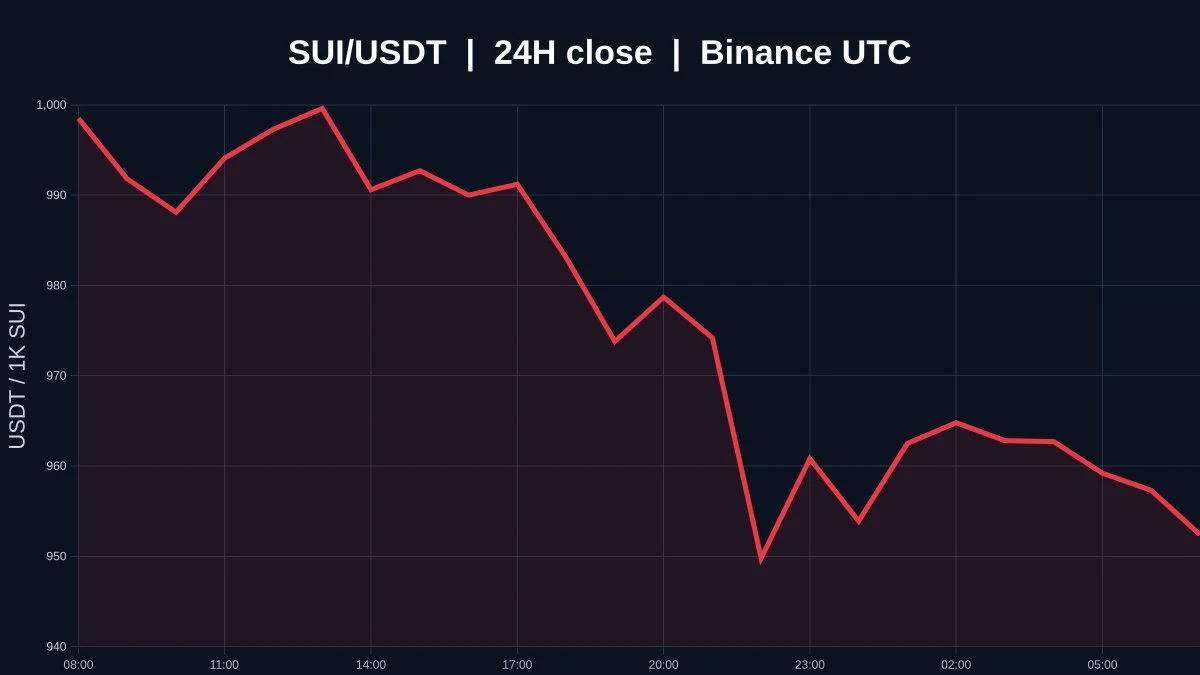
$SUI There Is The Breakdown Below The 1Min 200MA 🔥
post-image
SUI-0.24%
🐋 WHALE WATCH : Look at what happens when shorts try to stand in front of momentum.
=> $BTC closing hard on the $84K resistance wall
=> Over $95.72M liquidated from aggressive short positions in a flash
=> Order books thinning out above current levels
If $84K officially cracks and flips to support the squeeze higher is going to be violent. Pay attention.
post-image
BTC+0.69%
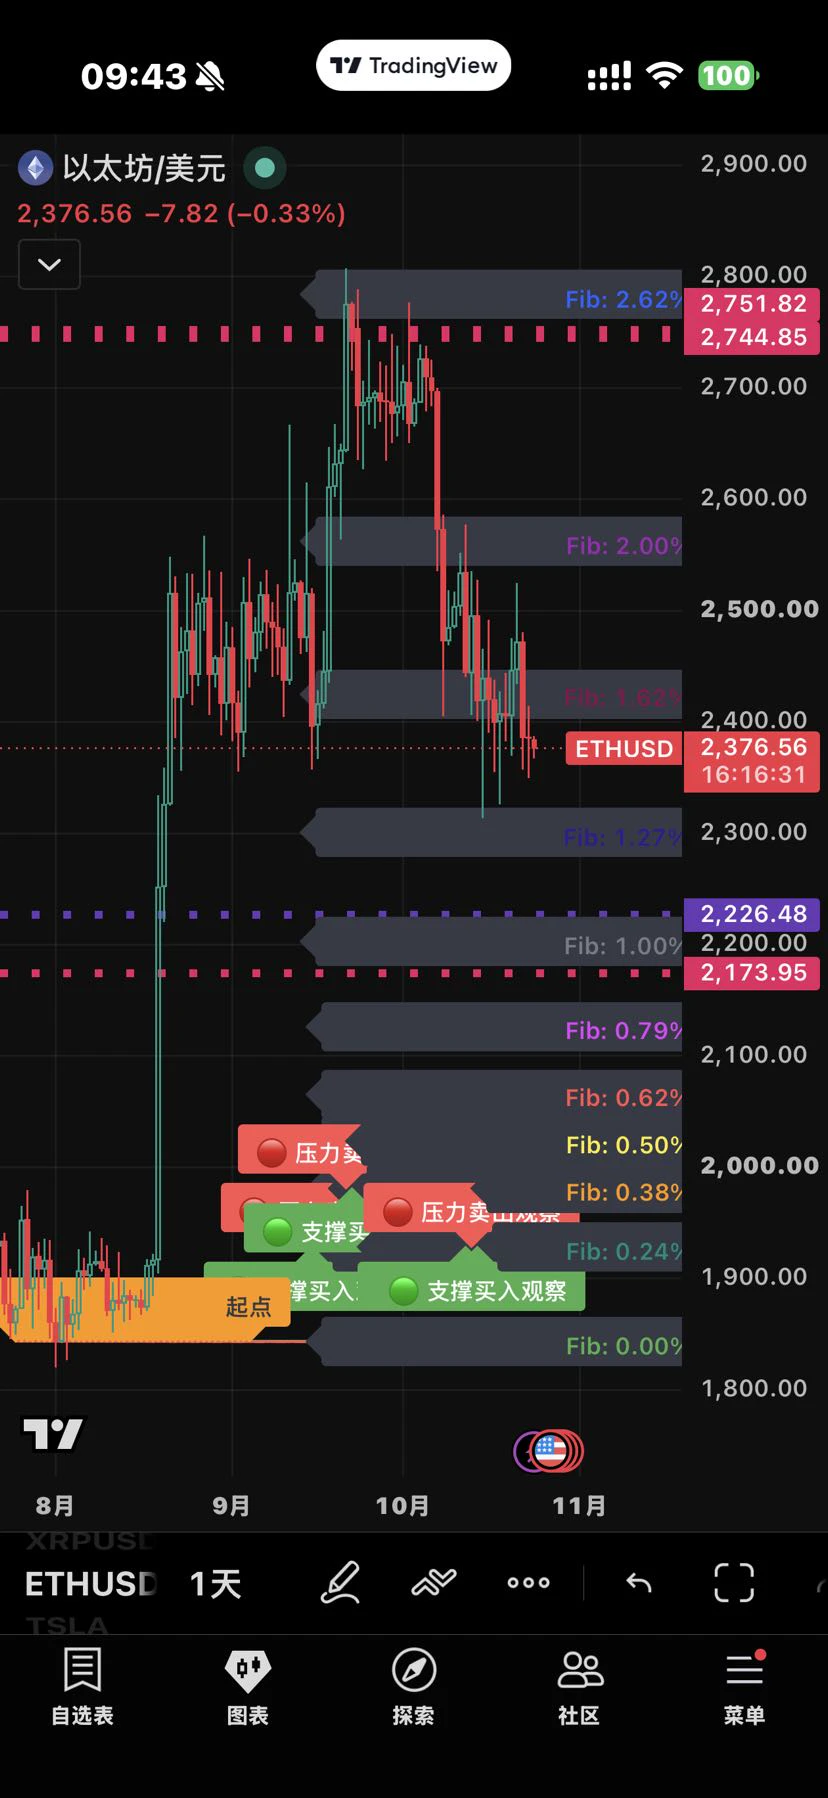
#EthereumUpOver71%inQ3
Ethereum’s 71% Quarterly Surge: Can ETH Turn Momentum Into a Sustainable Uptrend?
Ethereum’s reported 71% rally in Q3 2026 delivered an impressive performance, but the next chapter could be more challenging. After such a strong advance, the market must answer one critical question: Can buyers maintain control when profit-taking, resistance, and changing liquidity conditions start testing the trend?
For me, Ethereum’s next move will depend on three major factors: institutional capital flows, market liquidity, and its ability to defend key technical levels.
1. ETF Flows S
ETH+0.46%
BTC+0.66%
Which #Memecoin will go parabolic this month
post-image
MEME-0.38%
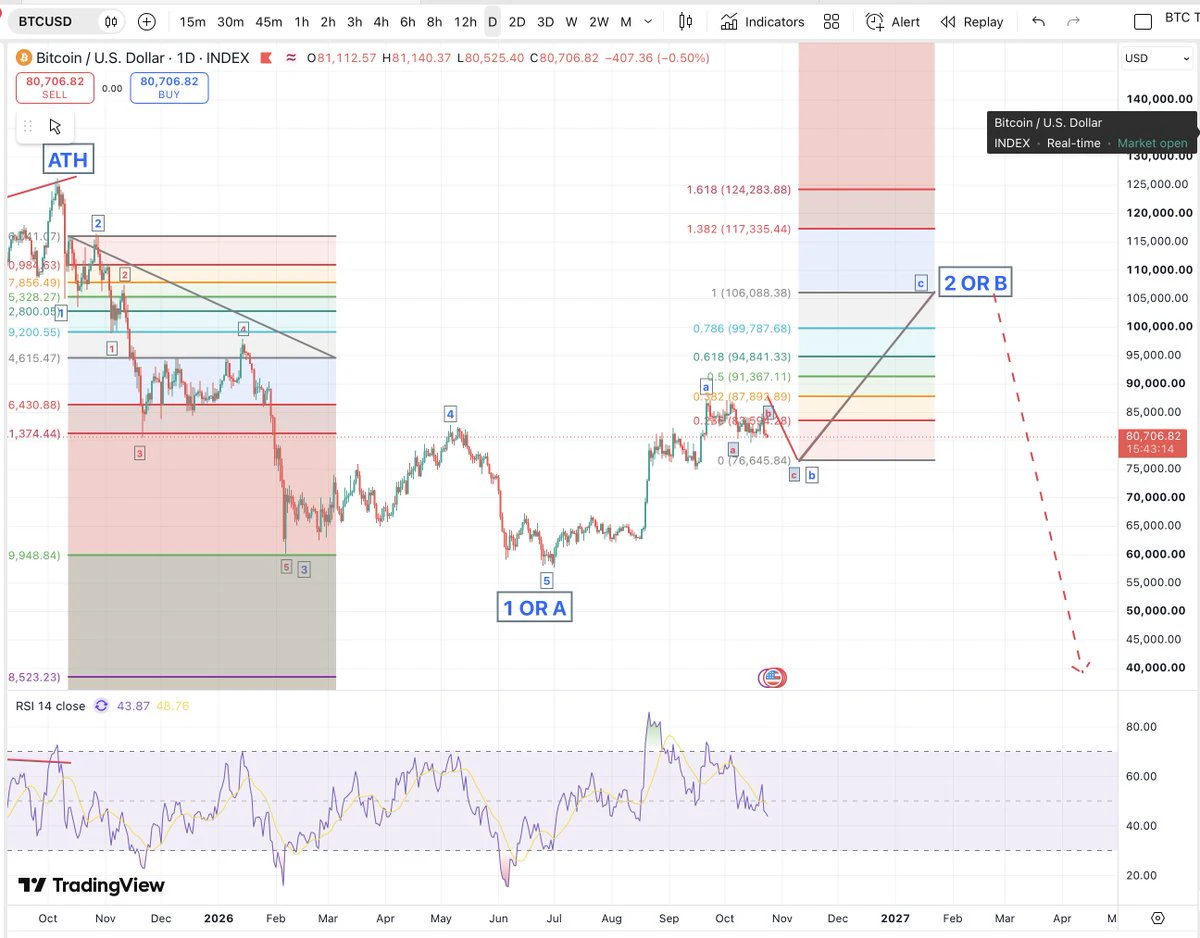
#BTCPullsBackTo81000
BTCPullsBackTo81000 — Bitcoin Price Analysis and Market Outlook
Bitcoin’s pullback toward the $81,000 level has brought renewed attention to market sentiment, short-term volatility, and the next potential price movement. After a strong period of price action, a correction can create uncertainty among traders, but it can also provide an opportunity to evaluate market structure and identify important support and resistance zones.
Bitcoin at $81,000: What Is Happening?
The $81,000 level is an important psychological price zone for market participants. When Bitcoin moves towa
BTC+0.67%
🚨🔥 3 new partnerships coming for 👀🤖
What’s happening behind the scenes? Are we about to see a big surprise in the world of artificial intelligence? 🚀
Imagine if one of these partnerships were with OpenAI, the company behind ChatGPT! 🤯
Integrating autonomous AI agents with major AI platforms could open entirely new doors for the project and increase interest in the token $FET 📈
👀 But the most important question is:
Which three companies could be behind these announcements?
Could we see a big name that turns expectations upside down? 🔥
⚠️ Just speculation for discussion, with no confirm
post-image
FET+5.15%
#交易机器人 I’m using the ETHUSDT futures grid bot on Gate—come copy-trade with me
post-image
$SUI In Decision Mode!
Upside Target🎯: $1.1282
Downside Target 🎯:1.1091
Up then down... 👀
NFA, DYOR ⚠️
#Crypto #Trading #SUI
SUI-0.24%
$PEPE # PEPE (PEPEUSDT) — Key Support & Resistance | Breakout
‍# PEPE (PEPEUSDT) — Key Support & Resistance | Breakout or Reversal Ahead?
### Technical Outlook
PEPE is one of the most recognized meme cryptocurrencies on the Ethereum blockchain. Launched in 2023 and inspired by the popular Pepe the Frog meme, PEPE has attracted significant market attention through its strong community, speculative trading activity, and high volatility.
Fundamental Perspective
Unlike traditional blockchain projects, PEPE is primarily a community-driven meme token with limited underlying utility. Its market perfo
post-image
PEPE+3.01%
75x leverage flip to a short! $ZEC The short position directly pocketed a terrifying 829.76% unrealized profit! It opened at 1441.41 and crashed to 1272.85—this waterfall was insane!
The logic is simple: it rallied on the privacy narrative and AI concept, but the fundamentals simply cannot support such a high valuation. On top of that, the broader market traded sideways late at night, severely draining funds from altcoins. Seeing large sell orders and weakening longs around 1441, I immediately flipped short and rode the selling pressure to profit!
75x leverage leaves virtually no room for err
post-image
ZEC+4.04%
AKE-5.58%
  • 4
10.10–10.11 Weekend zec Silk Road Recap
$ZEC currently peaked at 1299, still just 1 point short of reaching the fourth target. But no matter—the third target was 1290, and those who caught this Silk Road wave are now absolutely rolling in profits! Easily keeping 🫴zec under control—the strictest father of zec, 🤩🤩🤩
It has now pulled back to around 1270. The Bollinger Bands are opening upward, with short-term support at 1250 and mid-term support at 1230. Its momentum is extremely strong, but after a rapid surge, selling pressure was released and the short-term rise became overextended. It wi
AChenBit
10.10-10.11 Weekend ZEC strategy
Priority execution $ZEC long strategy
  Entry range: lightly go long on a pullback near 1210, add near 1200
  Stop-loss defense: near 1190 (set according to position size; execute planB if it breaks below)
Take-profit levels
  First take-profit: near 1230 (touching the upper Bollinger Band)
  Second take-profit: near 1250 (short-term high resistance)
Third take-profit: near 1290 (medium-term high-volume trading zone)
Long-term target: near 1300 (form a long-term position layout following the pullback trend)
Operational factors: The Bollinger Bands are gradually narrowing. After the sharp drop, the market has entered range-bound consolidation and recovery, with the short-term long-short battle relatively balanced. The red bars are extending slightly, and short-term bullish momentum has a slight advantage, but the indicator's upward momentum is limited, without a strong golden cross accompanied by a surge in volume. The rebound is a recovery after being oversold, rather than a strong one-way bullish trend. For the range-bound movement, first watch the first and second take-profit levels. Observe and analyze the trend dynamically on Sunday evening, then assess the third take-profit level and long-term target after determining next week's overall trend.
planB
If the entry range is not reached, the stop-loss at 1190 is broken, or the price breaks above 1250, execute the short strategy
Entry range: wait for a pullback to the high level above 1250 to go short, add near 1270
  Stop-loss defense: 1290 (uniform stop-loss)
Take-profit levels
  First take-profit: near 1230
  Second take-profit: near 1200 (lower-band support)
Third take-profit: below 1170
Long-term target: below 1140
#Gate亮相TOKEN2049
#Ledger事件损失近9000万
#GateWCTCS9全球交易赛
repost-content-media
ZEC+4.04%
Load More

Join 40 M users in our growing community

⚡️ Join 40 M users in the crypto craze discussion

💬 Engage with your favorite top creators

👍 See what interests you

Trending Topics

GateAtTOKEN2049

41.35k Views21.85k Discussing

Gate brought a series of major events to TOKEN2049 Singapore! From the official launch of Gate Money to the F1 Red Bull driver meet-and-greet and the Gate Gala, we witnessed a new chapter of "One Gate, Borderless Finance." Which moment from TOKEN2049 stood out most to you?

LedgerLossesNear90Million

39.52k Views300 Discussing

GateWCTCS9GlobalTradingCompetition

34.6k Views5.16k Discussing

View More