





Share your thoughts
placeholder
Article
$FIL is in a normal pullback and correction phase following a strong rally. After being rejected from the $1.02–$1.04 resistance zone, the price is currently cooling off and fluctuating around $0.99. The first area to watch next is $0.90–$0.92. If this support holds, buyers can re-enter and the bullish structure can remain healthy. If $0.90 breaks, the next support is around $0.84–$0.88. For now, this looks more like a post-rally correction than a complete trend reversal. Key levels: Resistance: $1.02–$1.04 Support: $0.90–$0.92 Next support: $0.84–$0.88 Trade with $FIL
post-image
FIL+12.46%
Nobody is talking about SYMBOL while the 1h setup looks too clean to ignore.

$SOL /USDT - LONG

Trade Plan:
Entry: 100.49 – 100.83
SL: 99.06
TP1: 101.86
TP2: 102.66
TP3: 103.86

Why this setup?
Why now? The daily trend is bullish, the 1h ATR is 0.667068, and the 15m RSI sits at 47.28, meaning momentum is balanced but leaning bullish without being overextended. The entry zone between 100.49 and 100.83 aligns perfectly with the 1h price of 100.67, giving a precise risk-defined level. TP1 at 101.86 and TP2 at 102.66 project realistic moves from the entry reference of 100.66. The invalidation
SOL+1.52%
$ROBDOG is one of the few projects on RH I’ve been bidding every dip, momentum looks great and it’s clear it’s not just one day project.
Team and marketing pushing daily and looks like it’s accumulating here ready for a push to new highs, nice new entry or DCA here looks destined to run.
post-image
$SOL is consolidating around $100–$106 after a strong rally. Holding the $97–$100 support keeps the bullish setup alive, with a breakout above $106 potentially opening a move toward $110–$112.
post-image
SOL+1.50%
$XRP PRICE PREDICTION: CAN XRP REACH $10?
The long-term XRP chart is showing a potential bullish breakout setup.
🔹 Bullish Breakout Above: $1.55
🔹 Previous ATH: $3.66
🔹 Long-term Target: $10
If XRP dips below $1 again, that could present an attractive DCA accumulation opportunity for long-term investors.
Will #XRP reclaim its ATH and enter price discovery?
NFA & Always DYOR
@Ripple
post-image
XRP+4.24%
Sept 14 Update:
#Bitcoin ETFs:
1D NetFlow: -933 $BTC(-$72.67M)🔴
7D NetFlow: -5,892 $BTC(-$458.93M)🔴
#Ethereum ETFs:
1D NetFlow: +74,493 $ETH(+$186.65M)🟢
7D NetFlow: +31,407 $ETH(+$78.7M)🟢
post-image
BTC+1.69%
ETH-1.17%
SOXL saw a clear sharp rejection at the 99.80 support level, accompanied by a significant volume increase and bullish RSI divergence on the 15m chart. As the price reclaimed MA7 and tested MA25, a short-term mean reversion toward around 108.00 is highly likely. Open oversized LONG: $SOXL ! 🚀 Position entry: 101.66 - 103.95Target 1: 108.57Target 2: 113.18Stop-loss/exit if: 97.59Click here to trade 👇👇👇Other coins: $REZ : Current price 0.004636 - 24-hour change: +20.48%$ETH : Current price 2,511.41 - 24-hour change: +1.05%
post-image
SOXL-10.97%
REZ+19.36%
ETH+1.09%
$XAUT Today’s trading strategy
The market is like rivers and seas: some harness the momentum and set sail, while others sink with the waves. May you hold firmly to your own helm amid the rises and falls! ​​​
post-image
XAUT-1.55%
Congratulations to the fans who followed the short trades on gold and silver in the livestream and successfully secured $XAUUSD
XAUUSD-1.79%
Energy, healthcare, and other defensive sectors rose, while AI beneficiary sectors fell, with only a few exceptions.
This is a trade of higher oil prices, higher interest rates, and lower stock prices.
This pressure is most evident in the parts of the market most sensitive to growth/risk appetite. $MU
post-image
MU-5.99%
Musk slams the brakes while Trump floors the accelerator! $SNDK plunges 2.69%, triggering a massive waterfall—how can retail investors survive the 1500 defense battle?
AI giants are collectively calling for the brakes, but Trump is firmly flooring the accelerator to preserve hegemony, sending competitive pressure through the roof! However, antitrust and security controversies have triggered short-term panic-driven sell-offs in tech stocks. The moving averages are bearishly stacked in a waterfall pattern, with the price plunging all the way from the 1735 high and now at 1533, still in the bott
SNDK-1.14%
The “roundabout ways” left behind by ancient people have been discarded today.
Hundreds of years have passed, craftsmanship hasn’t improved, but the art of cutting corners has reached perfection.🙃
#每周来晒
#美联储加息会议
My September Fed Meeting Market Outlook
The September Federal Reserve meeting is now the most important macro event on my radar. The Fed’s September meeting is taking place on September 15–16, with the decision arriving early on September 17 Beijing time, followed by the press conference. In my view, this meeting is not simply about whether the Fed delivers a 25-basis-point move. The bigger question is what the Fed says about inflation, future policy, the dot plot and the possibility of another rate move.
The market is entering the meeting with expectations already heavily pos
post-image
#JPMorganRaisesMeta$820 JPMorgan Raises Meta Price Target to $820
JPMorgan has turned more bullish on Meta Platforms, upgrading the stock from Neutral to Overweight and raising its price target from $640 to $820.
The major catalyst is Meta’s aggressive AI expansion. JPMorgan analyst Doug Anmuth highlighted the early traction of Meta’s new Muse AI agent, which reportedly reached No. 3 on the U.S. App Store shortly after launch.
🔥 Why JPMorgan is bullish
🤖 Muse AI could create new consumer AI revenue opportunities.
🧠 Meta’s frontier AI models may expand its business beyond advertising.
📈
post-image
META+0.70%
  • 2
Nobody is talking about this $CL /USDT setup, but the numbers tell a different story.

$CL /USDT - SHORT

Trade Plan:
Entry: 99.43 – 99.83
SL: 101.55
TP1: 98.19
TP2: 97.23
TP3: 95.78

Why this setup?
Why now? The daily trend is a range, which means the market is coiling for a directional move and the 1h ATR of 0.801183 shows enough momentum to fuel it. The 15m RSI at 59.89 is not overbought yet, so we can enter near 99.63 without chasing. The target TP1 at 98.19 and TP2 at 97.23 represent measured moves from the entry zone, while the invalidation level at 95.91 acts as the hard line in the
CL+3.40%
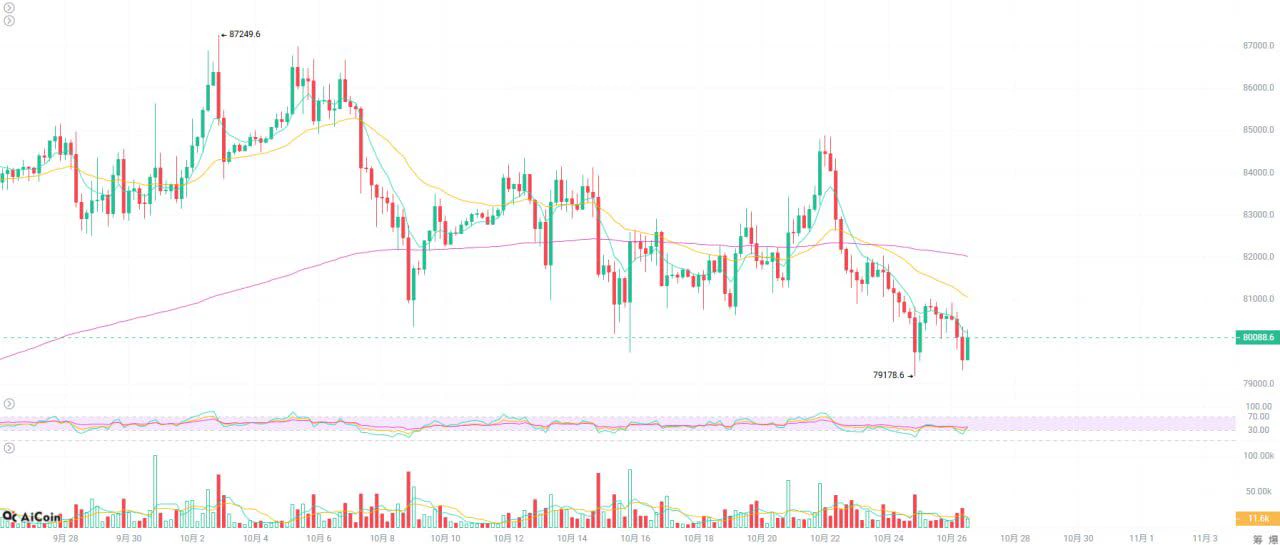
BTC has surged to 78500.....
U.S. stocks opened lower in the evening, while BTC moved higher, with a wave of gains reaching the first take-profit level in our strategy.
Based on the chart: if BTC retests 77811—77475 without breaking below, continue buying the dip! Why?
BTC is in an uptrend on the 4-hour chart. According to right-side trading, today's key downside level for BTC is 77475. We are trading with the trend, so we should buy on the pullback. As long as this level holds, the upward structure remains intact, and continuing to go long is the wisest choice. Next, we will see whether we ca
BTC+2.05%
Gate futures newly listed: $CATE
🔹 Trading pair: $CATE / $USDT
🔹 Trading time: Now open
🔹 Supports 1–20x leverage, trading bots, and copy trading
Doge has dominated Meme for years, and cats are finally taking over 🐱👑
Trade $CATE: https://www.gate.com/zh/futures/USDT/CATE_USDT
More details: https://www.gate.com/zh/announcements/article/101730
post-image
CATE+5.93%
  • 2
  • 6
#每周来晒
#美联储加息会议
My September Fed Meeting Market Outlook
The September Federal Reserve meeting is now the most important macro event on my radar. The Fed’s September meeting is taking place on September 15–16, with the decision arriving early on September 17 Beijing time, followed by the press conference. In my view, this meeting is not simply about whether the Fed delivers a 25-basis-point move. The bigger question is what the Fed says about inflation, future policy, the dot plot and the possibility of another rate move.
The market is entering the meeting with expectations already heavily pos
Nobody is talking about this hidden bullish setup forming right now.

$BTC /USDT - LONG

Trade Plan:
Entry: 77788.4 – 77965.0
SL: 77028.9
TP1: 78512.5
TP2: 78936.4
TP3: 79572.3

Why this setup?
Why now? The daily trend is firmly bullish, setting the stage for continuation. The 1h price is sitting near 77872.2, right inside the entry zone of 77788.4 to 77965.0. The 15m RSI at 52.82 shows room to run before hitting overbought territory. The 1h ATR of 353.244617 means the next leg can easily push toward the first target at 78512.5 and then the second target at 78936.4. The line in the sand is
BTC+2.05%
  • 1
Load More

Join 40 M users in our growing community

⚡️ Join 40 M users in the crypto craze discussion

💬 Engage with your favorite top creators

👍 See what interests you

Trending Topics

GateTopsGlobalGrowth

23.68k Views363 Discussing

According to the latest CryptoQuant data, Gate's spot trading volume ranks top 3 globally, with the fastest growth worldwide, while futures trading volume growth also ranks top 3 globally. Market activity is accelerating back, and Gate's growth momentum continues to lead. Market heat is back — are you mainly trading spot or futures these days? [👉 Full report:](https://cryptoquant.com/insights/research/6aa7aaca26ed15760f9ca834)

GateUSExpandsTo37StateLicenses

21.48k Views189 Discussing

AnthropicPicksNasdaqForIPO

72.22k Views582 Discussing

View More