Share your thoughts
placeholder
Article
I originally just wanted to freeload a breakfast, but the market ended up serving me dumplings for half a year. 🔥
A few days ago in the early hours, $AKE pulled back to around 0.0088431. The key level held, with clear buying support below. After grinding sideways for half a day without breaking down, I went straight long and entered without hesitation. 💪
When I opened the chart this morning, the price had shot up to 0.0159464, handing me +1970.24%. This long trade delivered the answer. It was truly sluggish beforehand, but the breakout feels absolutely great. 😎
In terms of execution, I fir
post-image
AKE+9.83%
ETH+0.22%
BTC-0.57%
Insiders are quietly stacking shorts on SYMBOL while the 1d trend stays flat.

$PONS /USDT - SHORT

Trade Plan:
Entry: N/A – N/A
SL: N/A
TP1: N/A
TP2: N/A
TP3: N/A

Why this setup?
Why now? The 4h bias says SHORT with moderate conviction, so we lean into the sell side. The 15m RSI sits at 41.62, which means momentum is leaning bearish but has not collapsed into oversold yet. The 1h ATR is absent, so we rely on the 4h structure to size risk. The entry reference of 0.7241 gives us a precise level to initiate the short. The daily trend being range-bound means we expect the price to revisit the
PONS-12.37%
$MARSCOIN has plunged 17%, and you’re still buying the dip? Retail suckers really are endless! The price of 0.1521 looks tempting, but 240M USD in 24h trading volume shows that the big players are dumping like crazy. Wasn’t the roller coaster from 0.197 down to 0.1469 exciting enough? Let me be blunt: this coin is just the market maker’s ATM. A rebound to 0.16 is your chance to escape; set your stop-loss at 0.145. Anyone catching this falling knife is an idiot. If your position is over 5%, you should halve it now. Don’t tell me about some Musk narrative—he hasn’t even mentioned this shitcoin
MARSCOIN-16.70%
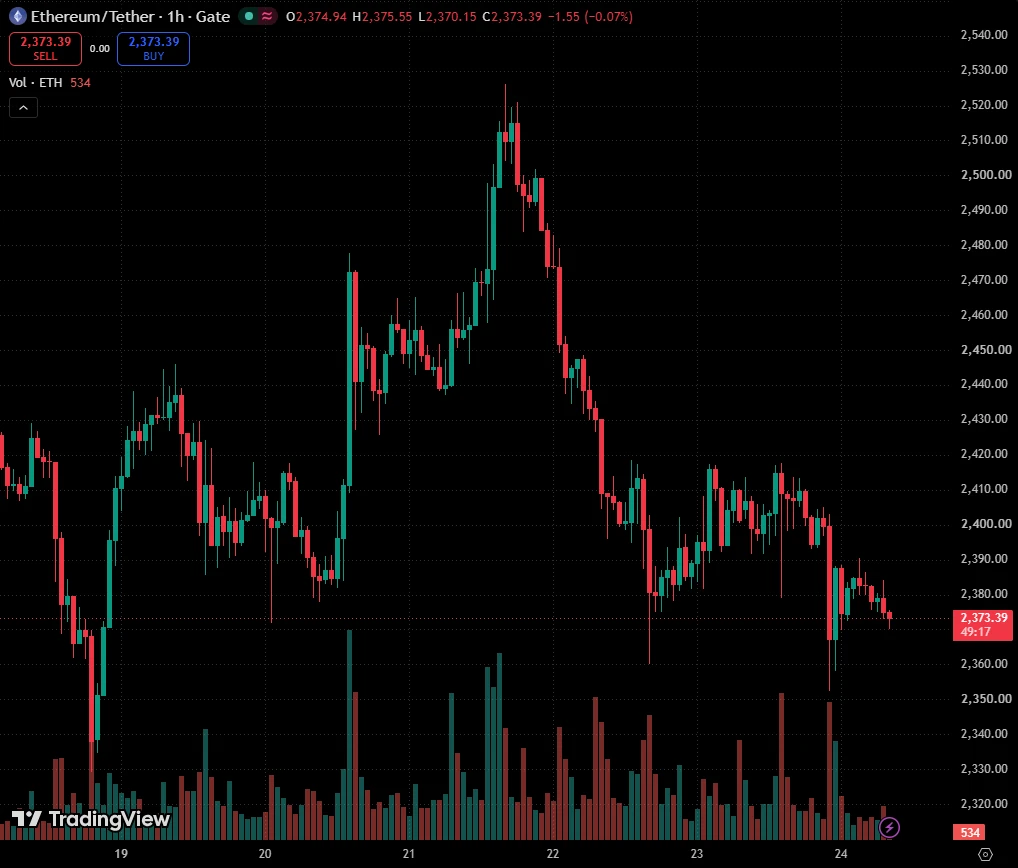
Ethereum ($ETH ) is holding near $2,494, with 24H trading volume above $13.5B and market cap around $304B. CoinMarketCap is also showing ETH around the $2.49K area.
ETH remains close to the $2,500 psychological level. A clean breakout and hold above this zone could strengthen bullish momentum, while recent analysis highlights $2,462 as an important downside level.
The next move could be decisive.
$ETH #Ethereum #ETH #Crypto #Altcoins
post-image
ETH-2.49%
  • 5
Capital Rotation Returns Across Crypto! Could BTC & ETH Lead The Next Market Expansion?
live-cover
LIVE1,269
I was just about to go rant on the forum, but then I looked at my balance and thought, forget it—the market is always right.
First, the answer: The batch of $FN I shorted a few days ago was entered at 490.3, and the current price is 422.9, with unrealized profit already reaching +269.86%. It wasn’t a huge bite, but the timing felt pretty good.
When the dumping started early in the session, the price didn’t plunge all at once. Instead, it first rebounded to a high level for a second test. Every push upward came up just short, volume kept shrinking, and it looked like there was a wall overhead.
post-image
FN+1.24%
ZEC-4.45%
LAB-2.67%
Everyone is watching gold but silver is about to break lower.

$XAG /USDT - SHORT

Trade Plan:
Entry: 66.24 – 66.38
SL: 66.97
TP1: 65.82
TP2: 65.49
TP3: 65.00

Why this setup?
Why now? The 1h price is sitting at 66.31 inside a tight entry zone between 66.24 and 66.38, and the 15m RSI at 54.76 shows the market is not yet overbought, leaving room for the short to run. The daily trend is range-bound, which means a breakdown from this range is more likely than a continuation, and the 1h ATR of 0.273073 confirms enough volatility to push through 65.82 and reach the deeper target at 65.49. The in
XAG+0.15%
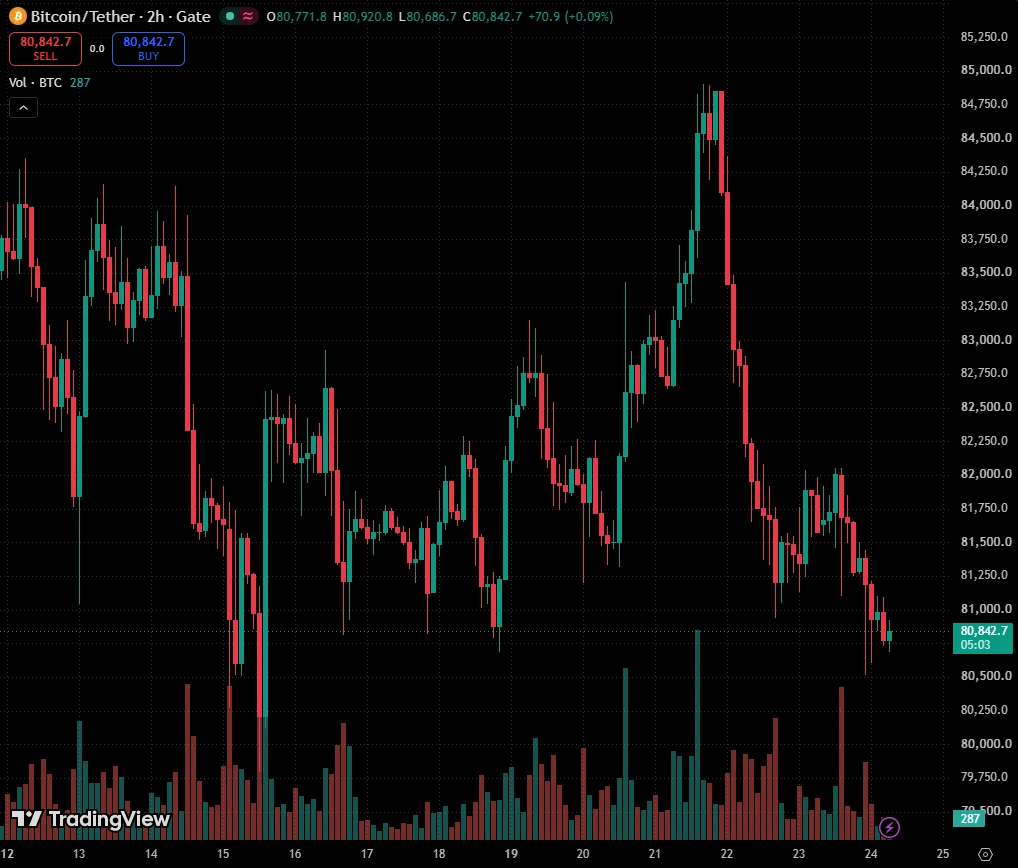
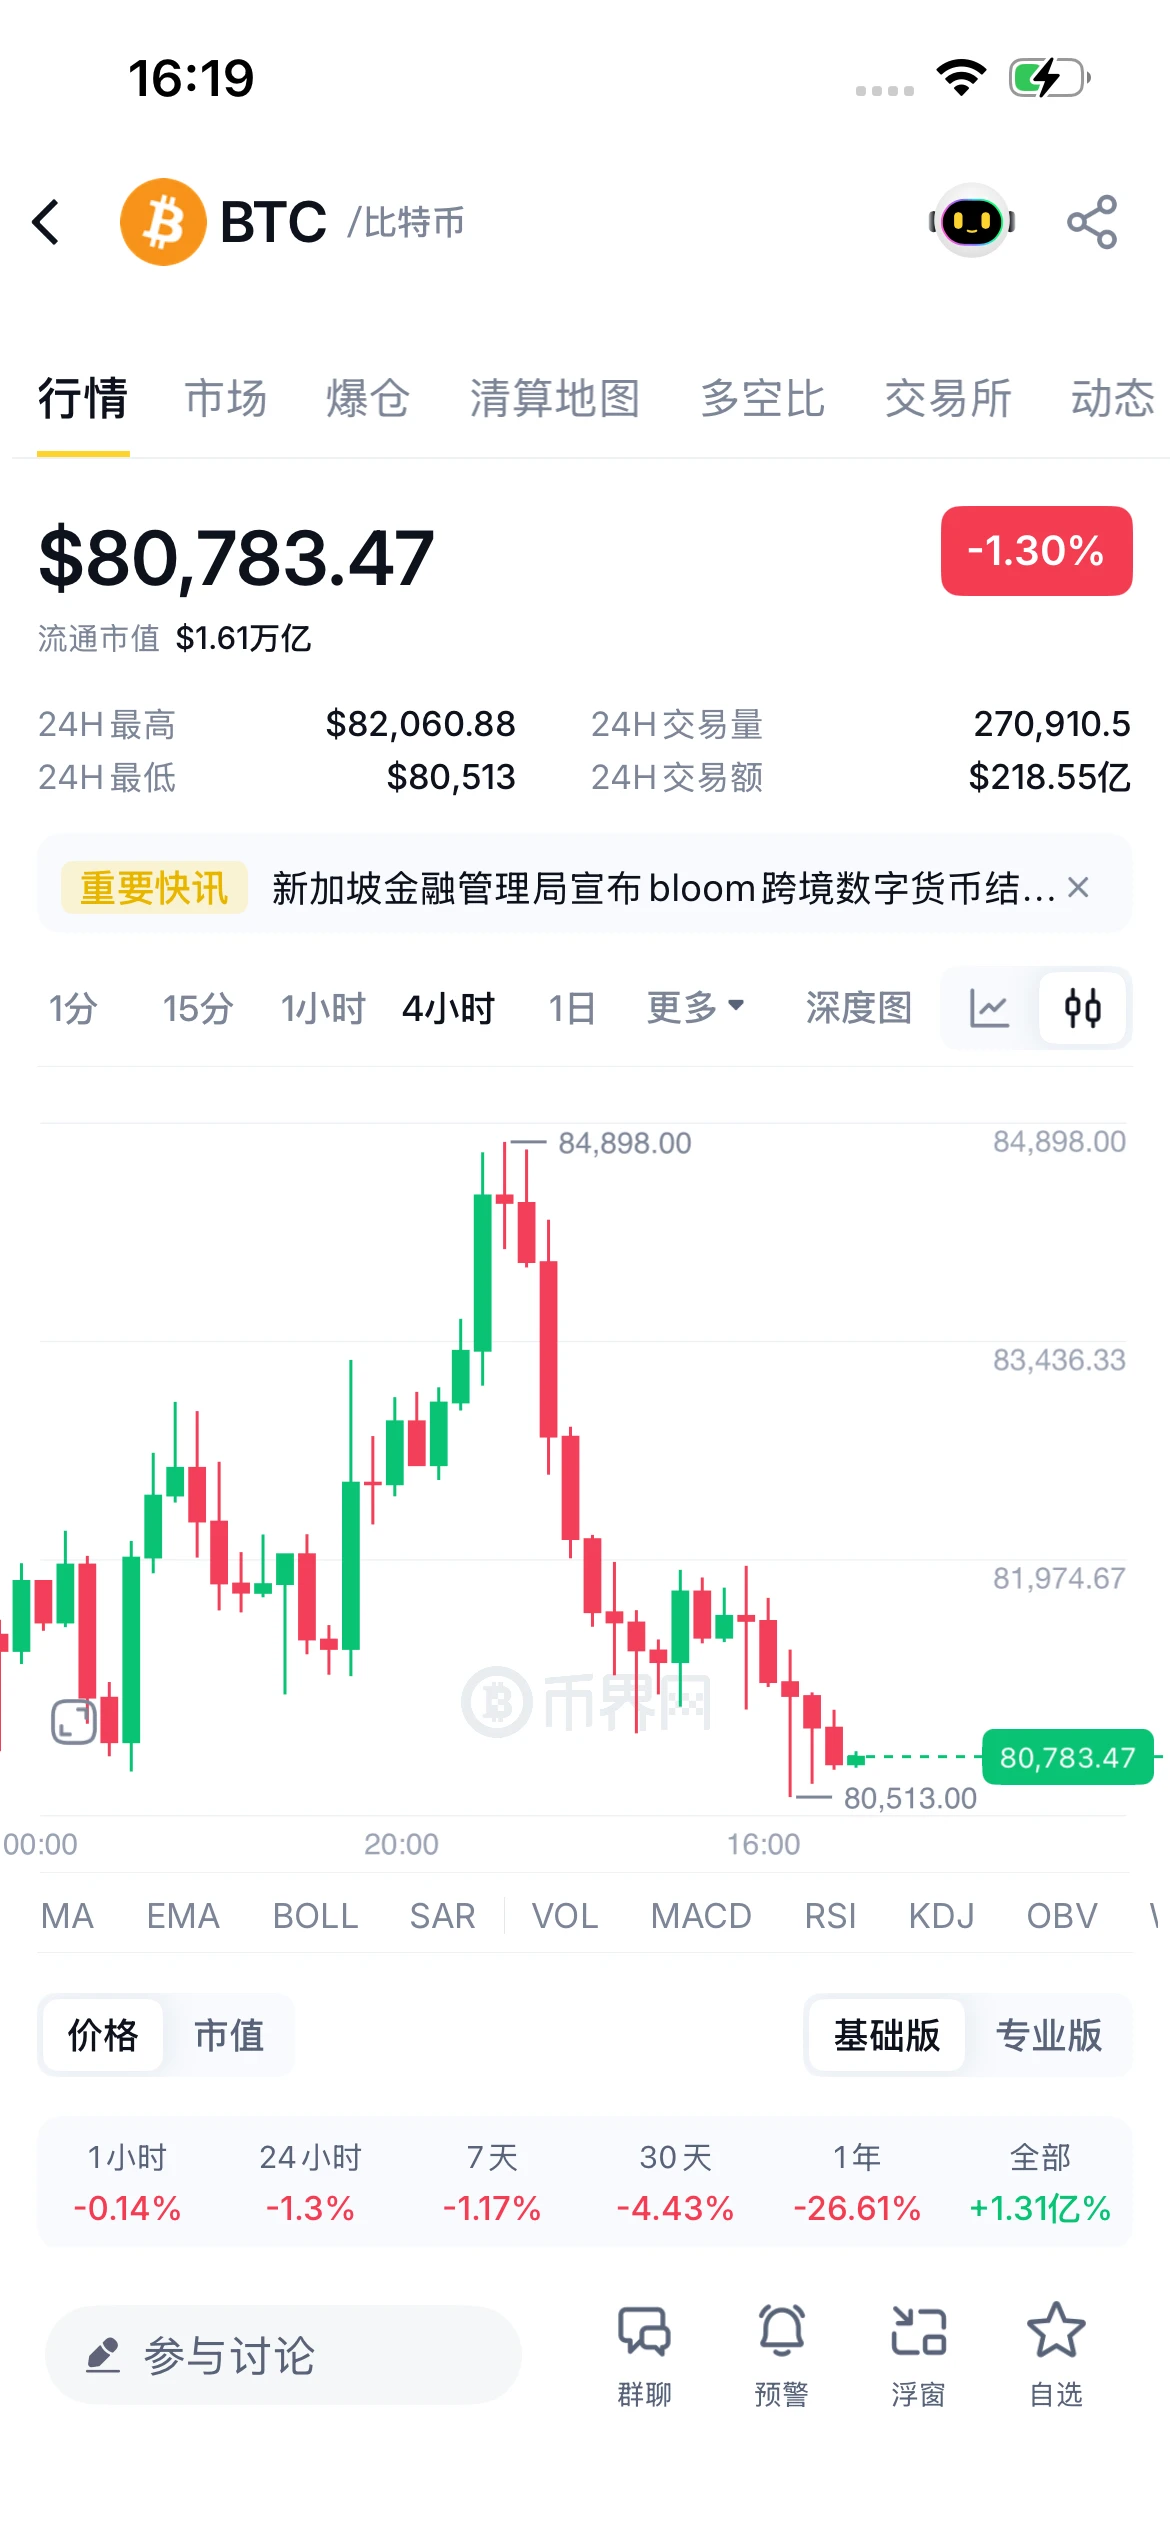
🚀 Could you earn $2,700 daily from Bitcoin mining? UE Crypto is betting big as Bitcoin surges back above $80K! 📈 With ETF inflows hitting $987M, is this the future of mining? $BTC #CryptoNews
BTC-0.57%
I didn’t chase the first bullish candle after the breakout; my first reaction was to worry it was a false breakout. It wasn’t until the pullback held and the second volume surge started the next move that I confirmed the direction and added to my long position.
After the price surged near the target and momentum began to stall, I followed the plan and first reduced the position by 70%, keeping the remaining 30%. Later, the pullback hit my protection level, so I simply closed the rest of the position as well.
This long position made one thing clearer to me: entering a little later is nothing to
post-image
LAB-2.67%
ETH+0.22%
No big-picture vision, can't hold, the profit on this move is as thin as paper, but I love it. 🤤 Just after lunch, when I checked the chart, $BTC was grinding back and forth around 78760.0. The price barely moved, but large orders kept quietly absorbing liquidity in the trade tape. This sign of money quietly entering is more concrete than any signal. I watched it for nearly half an hour, waiting for it to show a direction. Truly good opportunities are never loud or restless.

I entered a long, held it, and then a volume spike finally came. The price has now reached 79108.3, with the position
post-image
BTC-0.57%
XRP-0.62%
ZEC-4.45%
$SNDK /USDT is range-bound, but a hidden breakdown could rewrite the short thesis.

$SNDK /USDT - SHORT

Trade Plan:
Entry: 1784.64 – 1788.62
SL: 1805.77
TP1: 1772.28
TP2: 1762.71
TP3: 1748.36

Why this setup?
Why now? The daily trend is range, so any break of structure matters more than direction. The 1h price is 1786.63, which sits right at the entry_ref and defines the trigger for the short. The 1h ATR of 7.97331 shows average hourly noise is tight, meaning a false move is likely and the real move will be sharp when it comes. The 15m RSI at 54.43 is neutral, confirming no exhaustion yet
SNDK+0.31%
Crypto Market and Trading Insights
live-cover
LIVE295
$SOL I’m bearish on this move. It fell 2.7%, while the retail long-short ratio rose from 1.96 to 2.02 and the large traders’ ratio rose from 2.43 to 2.50—both sides increased their long positions in the same direction, and no one has capitulated. This is not the structure of a bottom. The funding rate flipped from positive to negative, meaning those willing to pay to go long have exited; in the past hour, only 4 short positions were liquidated, while not a single long was liquidated, showing that none of the leverage has been forced out and all the overhead positions are still stacked above. I
post-image
SOL-1.15%
I originally just wanted to freeload a breakfast, but the market ended up serving me dumplings for half a year.

That dip in $DOGE in the early hours a few days ago nearly shook me out. Luckily, before the chart had fully taken off, I took a close look and saw clear buying support at 0.08454. The key level held, and the price-volume action was relatively clean, so I didn’t panic-sell along with the crowd.

When I opened the chart this morning, it was at 0.09004, with +604.08% gains already in the bowl. This wasn’t luck—it was about getting the rhythm right. The grind beforehand was maddening
post-image
DOGE+1.01%
ZEC-4.45%
ADA+0.96%
Nobody is talking about this HYPER liquidation zone yet.

$HYPE /USDT - LONG

Trade Plan:
Entry: 84.807 – 85.255
SL: 82.882
TP1: 86.643
TP2: 87.717
TP3: 89.329

Why this setup?
Why now? The 1D trend is bullish, setting a macro backdrop for upside. The 15m RSI sits at 32.74, signaling deep oversold conditions within the hour. The 1h ATR of 0.895449 shows the recent volatility is enough to push price from the entry reference of 85.031 toward the first target at 86.643. A sustained break above 86.643 opens a path to the second target at 87.717, but the trade is invalidated if 1h price closes b
HYPE-2.28%
Why is everyone suddenly treating SYMBOL as a range-bound asset when the data says otherwise?

$LTC /USDT - SHORT

Trade Plan:
Entry: 55.02 – 55.52
SL: 57.71
TP1: 53.44
TP2: 52.22
TP3: 50.39

Why this setup?
Why now? The daily trend has been flat, but the 1h price is sitting at 55.27, which is the exact entry_ref we have been watching. The 15m RSI is 42.19, showing bearish momentum without being oversold yet, meaning the drop likely has room to run. The 1h ATR is 1.017264, so a move from the entry zone of 55.02 to 55.52 is well within a single volatile hour. We are targeting TP1 at 53.44 an
LTC+2.06%
Why XLM is about to break range and surprise every long holder

$XLM /USDT - SHORT

Trade Plan:
Entry: 0.18871 – 0.19019
SL: 0.19653
TP1: 0.18414
TP2: 0.18061
TP3: 0.17530

Why this setup?
Why now? The 1h price is holding near 0.18945 inside a tight range, and the 15m RSI at 45.02 shows sellers are regaining control after a brief bounce. The 1h ATR of 0.002948 confirms volatility is compressing, which often precedes a sharp move, and the daily trend being range-bound means a directional breakout is overdue. The entry zone between 0.18871 and 0.19019 gives a precise trigger, with TP1 at 0.18
XLM+5.07%
Insiders are quietly pressing short on $XAUT /USDT while the range traps longs.

$XAUT /USDT - SHORT

Trade Plan:
Entry: 4405.2 – 4410.2
SL: 4431.3
TP1: 4390.0
TP2: 4378.1
TP3: 4360.4

Why this setup?
Why now? The daily trend is range, which means $XAUT /USDT is coiling inside a narrow band and a directional breakout is overdue. The 1h ATR of 9.8535 shows volatility is compressed, so a sudden expansion could fuel a swift move toward the short entry zone at 4407.7. With the 15m RSI at 54.11, momentum has not yet exhausted itself, leaving room for the first target at 4390.0 and a deeper test
XAUT-0.24%
This trend is so obvious I don’t even need to think—the account is dancing on its own. 🎉

Before the market fully took off, everyone was watching from the sidelines. I saw the bottom grinding sideways without breaking down, with buyers stepping in below and volume recovering, so I judged that taking a long position here offered strong risk-reward. I entered decisively at 0.4156. Today’s candlestick turned sharply upward, and the price has now reached 0.7242, giving me a +1468.82% return. All I can say is, this profit feels great. Those already on board should be waking up laughing—it was wor
post-image
SNDK+0.31%
ZEC-4.45%
During the early session, the price pulled back to around 140.53 and stabilized, so I went long directly. The plan is simple: as long as the hourly candle body does not break down, the upside target is the high-volume trading zone, with the stop-loss placed simultaneously.

After entering, it consolidated for a short while, with one wick in between, but I held the position. Once the hourly candle closed bullish again and pushed upward on increased volume, I took 70% off at the first target, and moved the stop-loss on the remaining position directly above the breakeven line.

The subsequent m
post-image
SOL-1.15%
BNB-1.00%
Load More

Join 40 M users in our growing community

⚡️ Join 40 M users in the crypto craze discussion

💬 Engage with your favorite top creators

👍 See what interests you

View More