Square
Following
Hot
News
Notifications
Profile
Share your thoughts
placeholder
Article
BTC stremer
live-cover
LIVE1,545
BTC-0.67%
ETH-1.26%
$ENA Cycle Divergence: 1-Hour Strength, 4-Hour Weakness—Which Will Shift First?
Currently, $ENA is at 0.0989 USDT, down 0.60% over 24 hours, with a range of 0.0897–0.1002. The 1-hour trend is bullish, with support at 0.0897 and resistance at 0.1; the 4-hour trend is bearish, with support also at 0.0897 and resistance at 0.1181. The two timeframes give opposing signals, and the direction is still being contested.
The 1-hour RSI is 75.6, already in overbought territory, and EMA20 at 0.09770221 is below the price; the 4-hour RSI is 37.8, indicating weakness, and EMA20 at 0.10242771 is above the
post-image
ENA+8.04%
Trenches
IDOL
I
bade
b
IDOL
0x3b...ab07
Market Cap
$.
Change
.
24h Vol
$.
Holders
.
PIEVERSE
P
bade
b
PIEVERSE
0x0e...25a9
Market Cap
$.
Change
.
24h Vol
$.
Holders
.
FIONA
F
bade
b
FIONA
B34n...pump
Market Cap
$.
Change
.
24h Vol
$.
Holders
.
CLAUDIA
C
bade
b
CLAUDIA
2j5S...W2ZM
Market Cap
$.
Change
.
24h Vol
$.
Holders
.
Singularity
S
bade
b
Singularity
7R4M...pump
Market Cap
$.
Change
.
24h Vol
$.
Holders
.
$RARE — Short entry: 0.01421 Take-profit 1: 0.01407 Take-profit 2: 0.01393 Stop-loss: 0.01478 The trend is slowly moving lower, while overall market activity remains notably calm. Without higher trading volume driving the decline, the gradual slide could easily level off.
post-image
RARE-0.89%
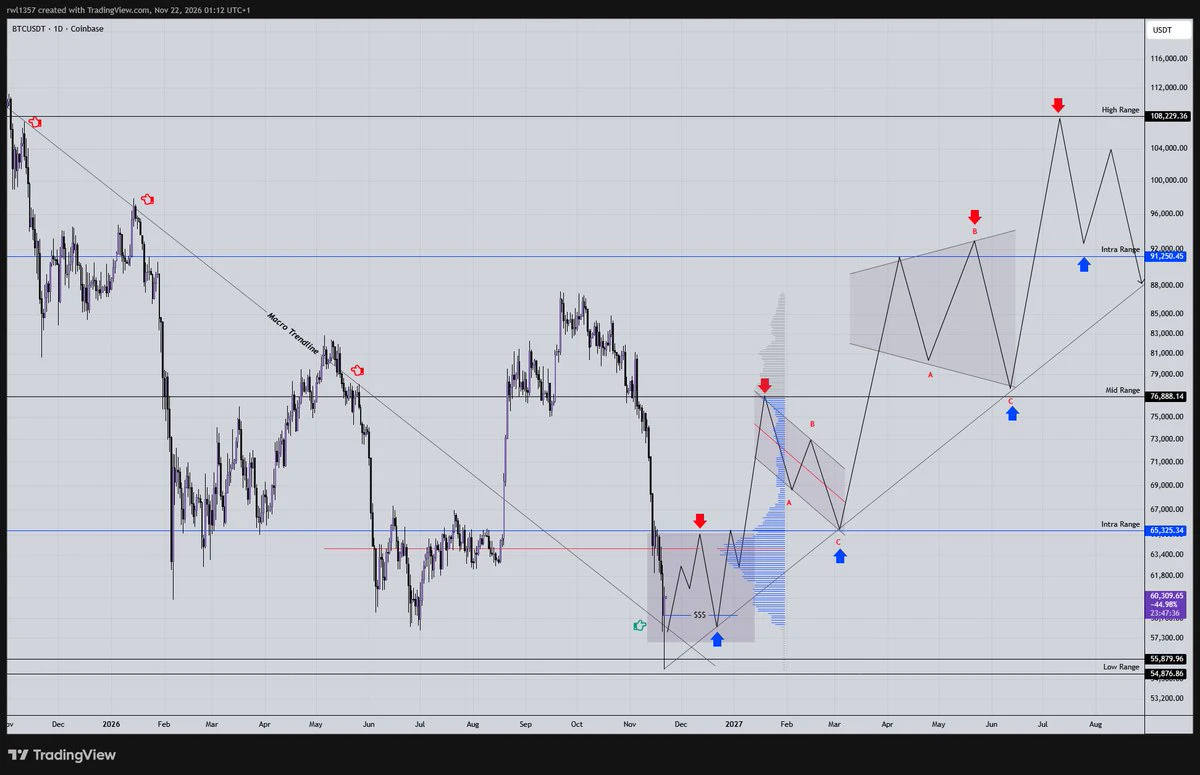
This is what I see for the bullish case in crypto going into 2027. Right now on the lower timeframe we are looking at the 64-65k area which is acting as the LTF trend, meaning that below it selling pressure will persist, and above it buying pressure will kick in. At first expect a pullback from that area before price breaks above the trend and begins the expansion move to fill the gap left behind by the recent crash, up to 76-78k which will be our mid term trend reversal, once we flip it as well, we can enter a more aggressive and sustainable breakout higher, pushing Bitcoin towards the ATH ag
post-image
BTC-0.67%
MARKET PREDICTION
live-cover
LIVE1,388
ETH-1.23%
BTC-0.65%
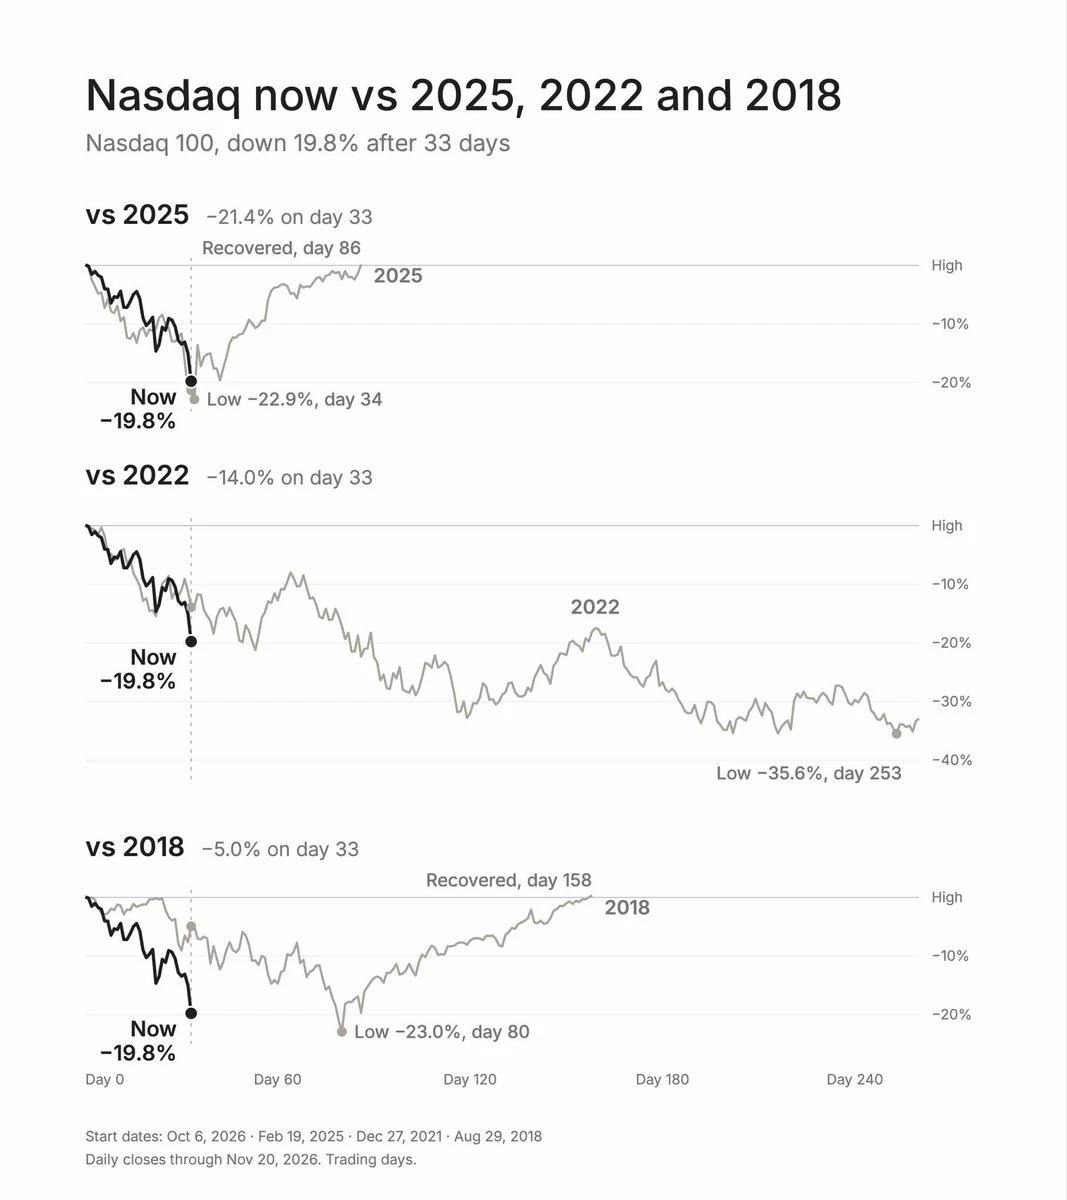
Looking at this chart, this downturn really does look a lot like 2025, because it’s falling too fast
So on Monday, I’m definitely going to rush in and start buying the dip with a fixed allocation
Otherwise, I might regret it
Mainly because I’ve been waiting for 5 months, and my DCA allocation has been too low
Now I have to start taking action
Disclaimer: those of you who already have positions, don’t follow me
Those who want to short are free to do so
For the detailed plan, if there’s a chance, I’ll analyze it in a special article this weekend
As before, I’ll post on the homepage and
Thank you
post-image
Nov 22 morning session: ETH resumed moving sideways after a rebound. Watch the 1674–1692 range first.

There is support at 1674–1676, where you can wait for a brief long opportunity after the price stabilizes. If it fails to break through 1689–1692, watch for a pullback. If it later holds above 1692 on increased volume, look next at 1697–1705; if it breaks below 1672, watch 1663 and 1653.

My approach is to stay mostly inactive in the middle and wait for confirmation at key levels. Don’t let a sharp rally or sell-off throw off your rhythm. The key now is which of these two levels gives a direc
post-image
ETH-1.23%
  • 3
$TRX Current price: 0.3054, up 1.09% in 24h. The 1-hour RSI of 63.89 signals relative strength, but the 4-hour RSI of 34.55 is deeply weak, while the volume ratio is only 0.20, indicating a clear drop in volume. The two timeframes are at odds above the same support at 0.2987, with no clear directional consensus. I’ll wait for confirmation. A break above 0.307 confirms the move once reached; a break below 0.2987 is my stop-loss. Low-volume standoffs are most likely to lure traders into one-sided thinking, so I’ll wait for volume confirmation before making a call. Not investment advice
#TRX #波场
post-image
TRX+0.42%
Lao Hei is clearly putting his own skin in the game with this trading call $VVV ! The project is also currently offering open-source models at half price, and if they sell well, 40 will probably be coming soon too!
post-image
VVV+0.37%
#英伟达单日重挫近14%
Nvidia closed down 13.8% on November 20, while the Nasdaq Composite fell 5.28%. Despite reporting strong earnings, the market is repricing the AI sector due to ongoing concerns over heavy capital spending, stretched valuations, and return on investment.

Here is a technical breakdown of the price action based on the provided charts:

Daily Chart (1D): The asset has experienced a severe breakdown, falling from a high of 243.42 down to the 125 area. The price is trading significantly below the 5, 10, and 30 moving averages. The MACD is deeply negative, and the OBV shows a clear dow
NVDA-13.84%
NDAQ-0.95%
$SOL 70.3, 24H +1.28%. The 1h chart is showing some strength, but RSI at 76 is overbought, and volume is only 0.23x the average. The 71.12 resistance overhead has yet to be broken. I’m keeping my eye on this level: I’ll only consider higher prices if it holds above 71.12; a break below 64.87 would turn the short-term outlook bearish. Short-term momentum is still finding its footing, so I’m mostly staying on the sidelines and waiting for a clear direction before making a move. The divergence between the two timeframes is still pronounced, so don’t mistake a short-term rebound for a trend. I’ll
post-image
SOL-0.77%
$ADA timeframes diverge: bullish on the 1-hour, bearish on the 4-hour, with key levels at 0.1462 and 0.1333
Currently, $ADA is at 0.1446 USDT, up 1.05% over 24 hours, with a range of 0.1333–0.1462. The 1-hour trend looks bullish, while the 4-hour trend remains bearish; the two timeframes give opposite answers.
My view: I’d rather see this as a direction that remains unconfirmed, rather than rush to label it a rebound or a pullback.
The 1-hour RSI at 77.4 has entered overbought territory, while the 4-hour RSI at 37.7 is neutral to bearish; the 1-hour EMA20 at 0.14358511 is below the current pr
post-image
ADA-1.48%
$NAORIS Up 15% in a day, touching a high of 0.036—is the “breakout pattern confirmed”?
There’s a widely circulated claim: once the price clears the previous high and closes green on heavy volume, the pattern is confirmed and it’ll keep moving up. Sounds convincing, but doesn’t hold up in practice. Today’s 24-hour trading volume was 13.8M. In a 15% green candle, that volume shows there was turnover, but also that selling pressure was absorbed—and being absorbed doesn’t mean it’s all been cleared. Looking at the move from 0.0296 to 0.036, the price has already covered a lot of ground. Structural
NAORIS+0.66%
  • 1
  • 1
The conventional belief is: when a war ends, energy prices fall. But there’s a countercyclical trend—the postwar reconstruction rally.
When conflicts end and geopolitical risks materialize, crude oil, copper, and coal can instead surge.
The clearest example is the end of the Iraq War in 2003, when oil prices climbed from $25 to $147 in 2008.
There are two reasons: reconstruction drives huge demand for raw materials, while oil production capacity is hampered during the war, leaving supply unable to keep up. This supply-demand mismatch pushes prices higher.
$COP #黄金逼近3500美元关口
COP+0.85%
The FBI’s own criminal database may have been hacked—talk about irony!
The NCIC, used by law enforcement agencies across the U.S., has also reportedly been breached. It contains fugitives, missing persons, criminal records, and stolen property—if that data leaked, who would take responsibility?
Both AP and NBC got word from people familiar with the matter that the FBI is investigating, but on Saturday the FBI flat-out declined to comment, not even bothering to give the public a “we’re investigating”
Axios said the scope remains unclear and there’s no proof the attackers took the entire databas
post-image
VVV | Long 🟢 | Bullish | 15-minute, 24-hour: +19.37% | Volume: 78.6M USDT. Long rationale: Price is above EMA200; EMA20/50/200 are in bullish alignment; RSI14 is 71.8; MACD histogram is positive; ADX14 is 39.2; volume is 0.97 times the 20-candle average; trend pullback/continuation. Entry: 24.822 Stop-loss: 23.734 Take-profit 1: 26.1819 | Take-profit 2: 26.9979 | Take-profit 3: 28.0859. Entry levels are for reference only; do not chase prices. The strategy is invalidated if the stop-loss level is hit. This is a technical analysis strategy only and does not constitute financial advice. $VVV
post-image
VVV+0.37%
  • 1
Barring any surprises, remember that today, 11/21, will likely officially rank among the top 10 liquidation events in history.

With a slight move tonight, liquidations will surpass the $2.768 billion recorded on 2021.4.16.

Over the past 24 hours, liquidations have already reached $2.675 billion, affecting 350636 people.
#英伟达单日重挫近14%
NVDA-13.84%
$TRX The real logic behind TRON fees in one sentence:
USDT transfers burn energy → someone stakes TRX in advance and “rents out” the energy → high-frequency users rent it to save 5x → stakers collect rent while sitting back.
A closed loop that sustains an entire ecosystem niche. Once you understand this, you’ll understand why some people keep buying TRX.
post-image
TRX+0.42%
$EVAA The most important thing is still open interest. The long-short ratio has been out of balance for a long time, and the other indicators are already useless. As long as open interest doesn’t fall below 200 million (a safe level), I personally think the market maker will be increasingly eager to trigger ADL (simply put, create a price wick to sell off). This is also contradictory: triggering ADL requires cashing out at a high price and reducing positions, and the market maker is already planning this. So just keep an eye on open interest as the key indicator
post-image
EVAA-0.49%
  • 1
Real and strong communities will be fine, I'm not worried bout them
Fear your fake coins...
Zero
post-image
Load More

Join 40 M users in our growing community

⚡️ Join 40 M users in the crypto craze discussion

💬 Engage with your favorite top creators

👍 See what interests you

Trending Topics

BTCBreaksBelow60K

2.1M Views30.1K Discussing

BTC fell below $60,000 on November 20 for the first time since July, alongside a tech stock selloff and broader pressure on risk assets. Will $60K become resistance, or can BTC quickly reclaim it? What price or volume signals would convince you that selling pressure is easing?

GateDirectIPOPhase3ANTAllocates92100Shares

799.8K Views4.9K Discussing

NvidiaDropsNearly14Percent

335K Views7.6K Discussing

View More