Square
Following
Hot
News
Notifications
Profile
Share your thoughts
placeholder
Article
#BTCBackAbove80K #ShareWeekly

BITCOIN FALLS BACK BELOW $80,000: IS THIS A HEALTHY RETEST OR THE START OF ANOTHER CORRECTION?

Bitcoin's recent recovery above $80,000 has lost momentum, bringing the market back to an important technical decision point. After rebounding from its recent low, BTC briefly climbed toward $80,949, raising hopes that buyers were preparing for another bullish move. However, the latest price action suggests that sellers are still defending higher levels, and the market has not yet established a convincing recovery.

Current Bitcoin Market Overview

As of the latest ma
BTC-0.67%
  • 7
  • 2
so they dumped nvidia and meta and decided to go all in high calorie sweet trash and ai slop owl?
absolute cinema
NVDA-9.05%
OWL-7.14%
Trenches
ZIG
Z
bade
b
ZIG
0x8c...1145
Market Cap
$.
Change
.
24h Vol
$.
Holders
.
BTC
B
bade
b
BTC
C5xp...pump
Market Cap
$.
Change
.
24h Vol
$.
Holders
.
HIGH
H
bade
b
HIGH
7ymF...high
Market Cap
$.
Change
.
24h Vol
$.
Holders
.
STONK
S
bade
b
STONK
6GmA...UNgx
Market Cap
$.
Change
.
24h Vol
$.
Holders
.
CORLA
C
bade
b
CORLA
0xba...7777
Market Cap
$.
Change
.
24h Vol
$.
Holders
.
A-Share and Hong Kong Stock Markets Weaken in Pre-Market Trading! ChangXin
live-cover
LIVE81
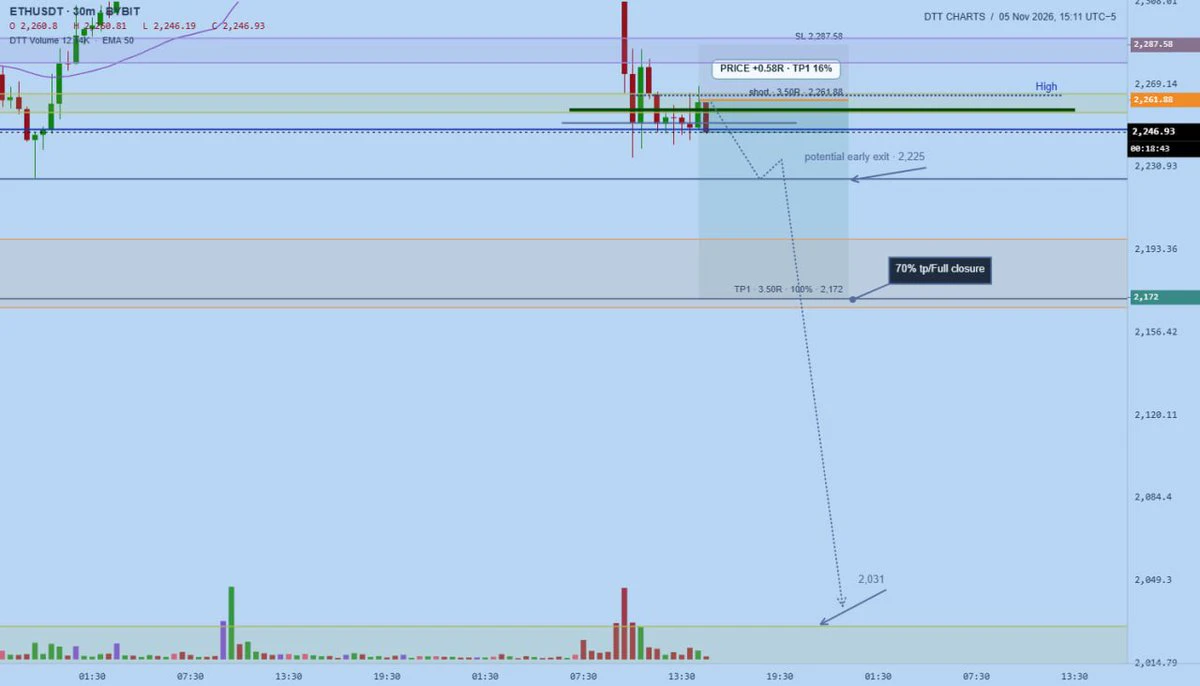
Entered a new short on $eth
Sl: $2287.58
Tp: 2172
3.5RR
Potential early closure at $2225
post-image
ETH-1.23%
Nvidia is down nearly 9% in a day—don’t rush to call the bottom. Democrats have taken Congress, and the shoe hasn’t dropped yet on data center restrictions. This selloff is about policy expectations, not earnings. Historically, dips caused by political shocks like this tend to recover within a few days—but only if you don’t jump in while funding rates are still bleeding longs. Keep it on your watchlist. What are you seeing on your end? I’ll wait until the details of the restrictions come out before saying more.
NVDA-9.05%
  • 6
i just received free position voucher of 250USDC according to $ZEC ‌and I'm going to short on this level 1239
and my exit is 1230,1225
#ShareWeekly
post-image
ZEC+1.29%
Obviously, $ARIA has already surged parabolically. 🔥 This pullback is another opportunity to catch the next 10x coin. Keep an eye on $MOVR and $GNS . If you're trading, give this post a like 👍
post-image
ARIA+22.03%
MOVR-1.92%
GNS-6.46%
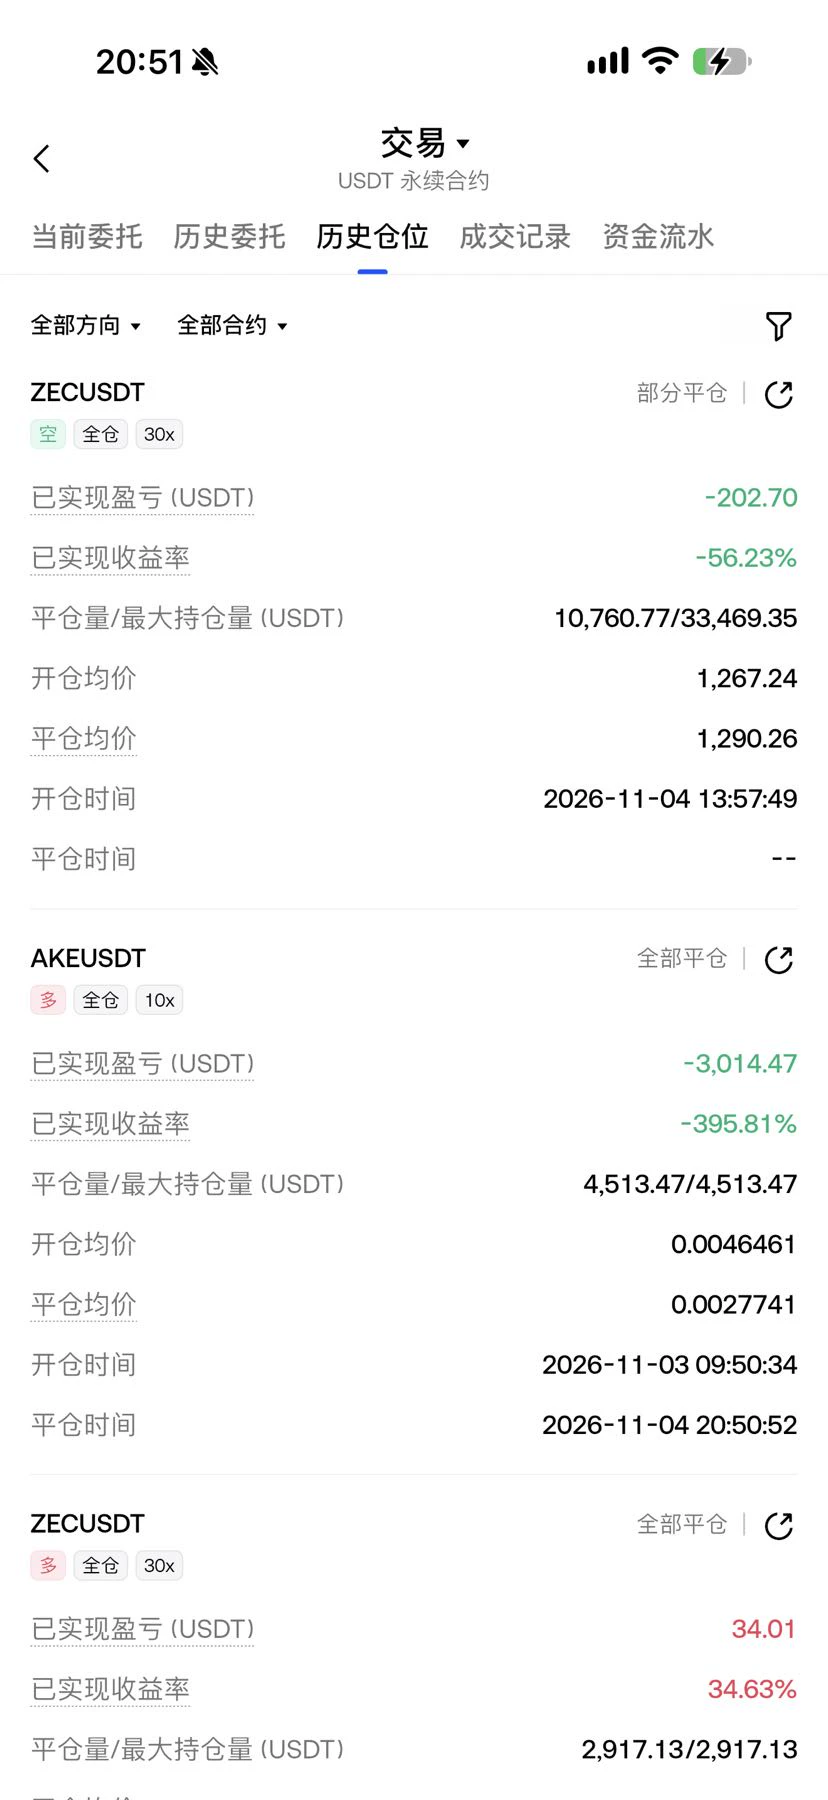
$AKE Always baiting people into longs. My position went from 29 to 34, and I thought it was going up. I adjusted the leverage to 25x and added to my position, then one candle took it straight back to 29. Market makers, you're making your greed way too obvious
post-image
AKE+6.07%
  • 3
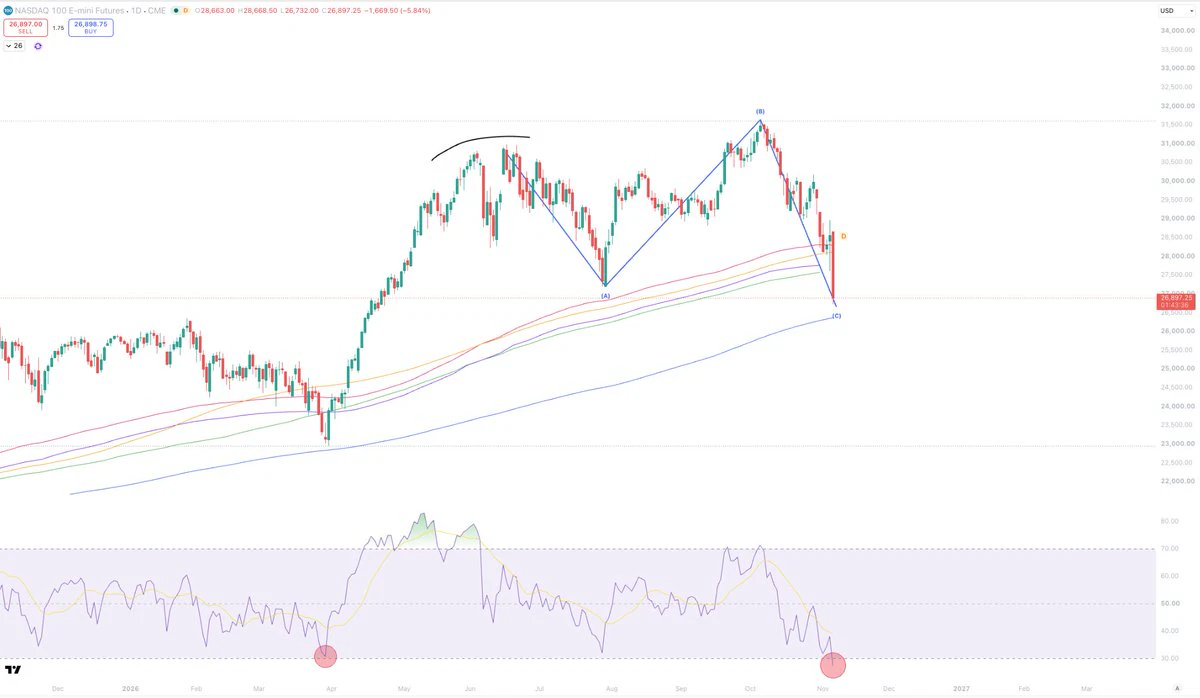
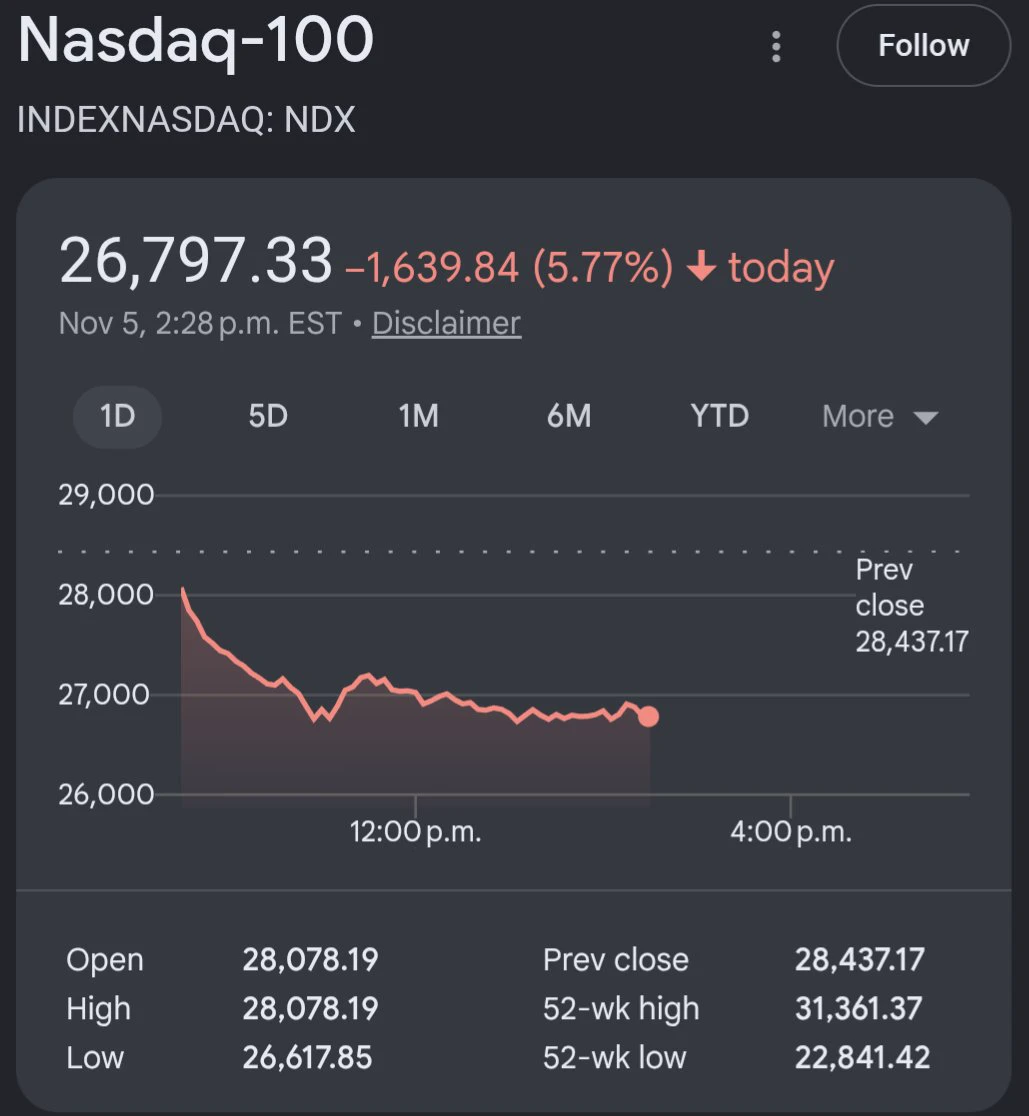
I think you could bid this Nasdaq nuke pretty comfortably.
Scary headlines out there but this looks like a pretty textbook expanded flat.
The VIX up 64% today which historically a buy signal.
And the lowest Daily RSI reading in 17 months.
These kinds of RSI readings are very uncommon in equities.
post-image
NDAQ-2.51%
$HYPE ‌ 's recent recovery has hit a serious resistance wall, and the latest candle shows sellers stepping back in.

Price is around $77.68 after rejection near $84.89. The daily Supertrend remains bullish at $75.21, but buyers need to defend that support to keep the recovery structure alive.

Levels worth watching:

Support: $77.45
Major support: $75.21–$74.41
Resistance: $82.67–$84.89
Next upside zone: $88.20

Holding above $75 could set up another attempt toward $82.67. A break below $74.41 would put the bullish structure under pressure.

HYPE still has a chance to stabilize, but buyers ne
HYPE+0.24%
AMD-15.69%
  • 5
OMG...
The market is crashing.
post-image
$CAP ‌ is building a strong bullish structure, and buyers are clearly back in control.

Price has climbed to $0.1071 after reclaiming the $0.09 area. The daily Supertrend remains bullish at $0.06086, while momentum is now bringing the previous high into focus.

Key levels to watch:

Support: $0.091–$0.089

Near-term resistance: $0.1129

Major resistance: $0.1219

Trend support: $0.0608

A clean break above $0.1129 could set up a retest of $0.1219. If buyers fail to hold $0.089, a deeper pullback becomes possible.

CAP is showing impressive relative strength. The next challenge is turning thi
CAP+8.34%
TSLA-10.94%
  • 1
  • 2
another day at the office.
post-image
ETH Technical Outlook: Ethereum Tests Critical Support as Bearish Pressure Remains

Ethereum is trading around $2,265–$2,267, testing the 0.236 Fibonacci level near $2,265.68 after pulling back from its recent recovery high around $2,358–$2,385.

The latest daily chart shows ETH trading below all four major EMAs. Although RSI has started to recover, the broader structure remains under pressure. Holding the $2,241–$2,265 support area is important for preventing another move lower.

EMA Structure

ETH is currently trading below all four major moving averages:

- 20 EMA: $2,349.35
- 50 EMA: $2,40
ETH-1.26%
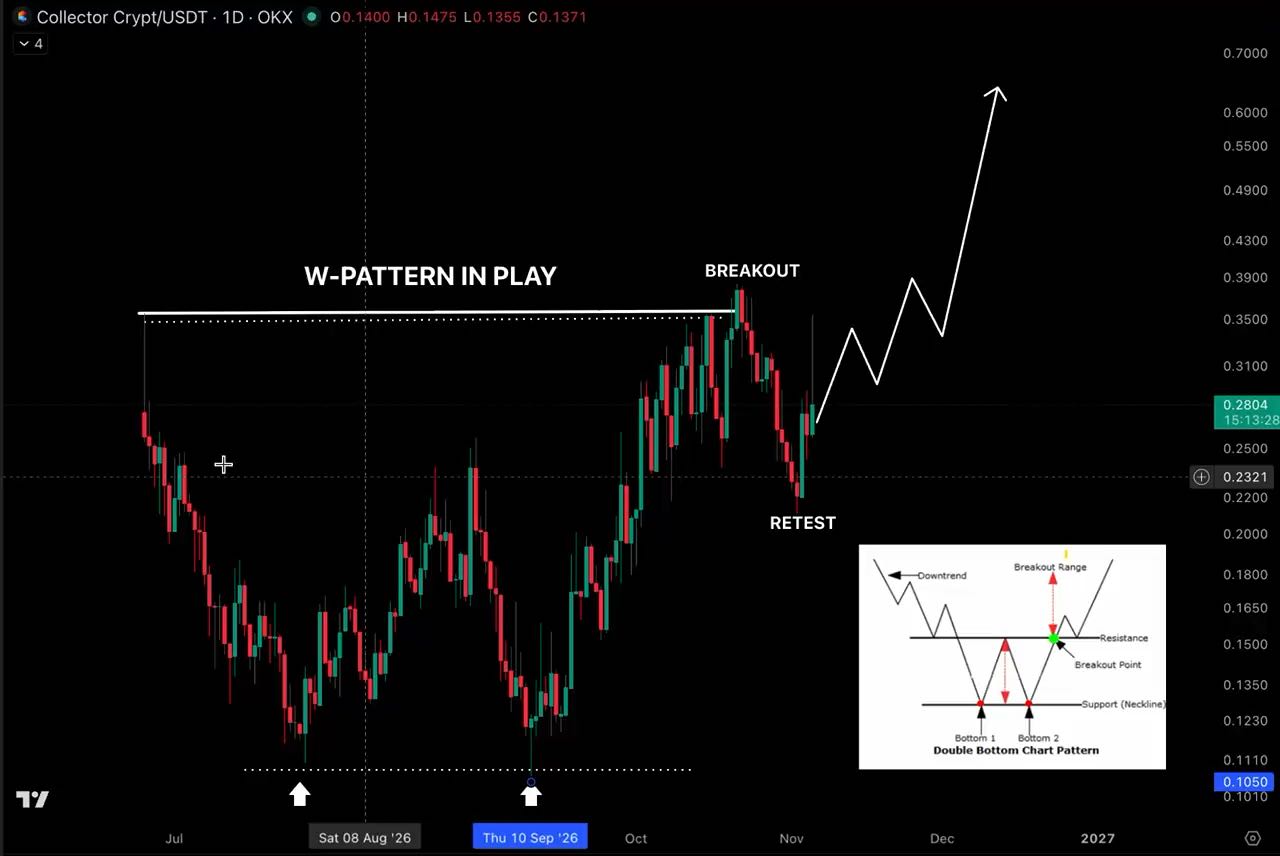
COLLECTOR $CARDS to $0.60?

that’s the bullish path i’m watching rn tbh

this W-pattern has broken out, price has pulled back to retest, and we’re now looking for continuation.

there’s still work to do, but the structure is getting interesting.

either this chart rewards patience or humbles us publicly

no in-between
CARDS-6.47%
$BTC is still churning along the upper boundary of the bull flag, without managing a decisive, high-volume breakout to the upside. The biggest mistake at this level is rushing in for fear of missing out—the truly prudent approach is to wait for price to decisively break above the upper boundary and then confirm it can hold on a retest before considering moving your stop-loss higher. Until then, patiently waiting for a pullback to enter long is the better play. First, watch the support around 79000; support near 77388 is more solid, while 74800 is the key floor for this structure. A break belo
post-image
BTC-0.67%
$ETH BTC currently ≈ $75,700 - $76,200 (significant pullback)
• Longs: $73,500 - $75,000 (if it holds, watch for $80,000+)
• Shorts: $78,500 - $80,500 (on a breakdown, watch below $72,000)
ETH currently ≈ $2,250 - $2,280 (significant pullback)
• Longs: $2,100 - $2,200 (if it holds, watch for $2,450+)
• Shorts: $2,400 - $2,500 (on a breakdown, watch below $2,050)
Market-wide long/short probabilities (Fear & Greed around 32-50, fear/neutral; sharp pullback; cautious sentiment on X/news; technical support test):
Bulls 54-61% (oversold bounce, support test possible).
Bears 39-46% (downward pre
ETH-1.26%
📡 Signal Card | Relay Mode
Source: Bit_Guru
Asset: $RARE
Short entry: 0.01212
Targets: 0.01195 / 0.01184 / 0.01168
Stop-loss: 0.01223
Speaking of which, earlier today (11-06), sis relayed this person’s $ELSA trade, and here they are again. That’s a pretty high attendance rate 👀
As usual, sis is just the messenger, passing along the 5 elements unchanged. Whether to follow and how much to position are up to you. The market owns the price action; the decision is yours 🫠
Shared as a personal record, not investment advice. #US AI stocks diverge: cloud service providers rise while data center s
ELSA+5.80%
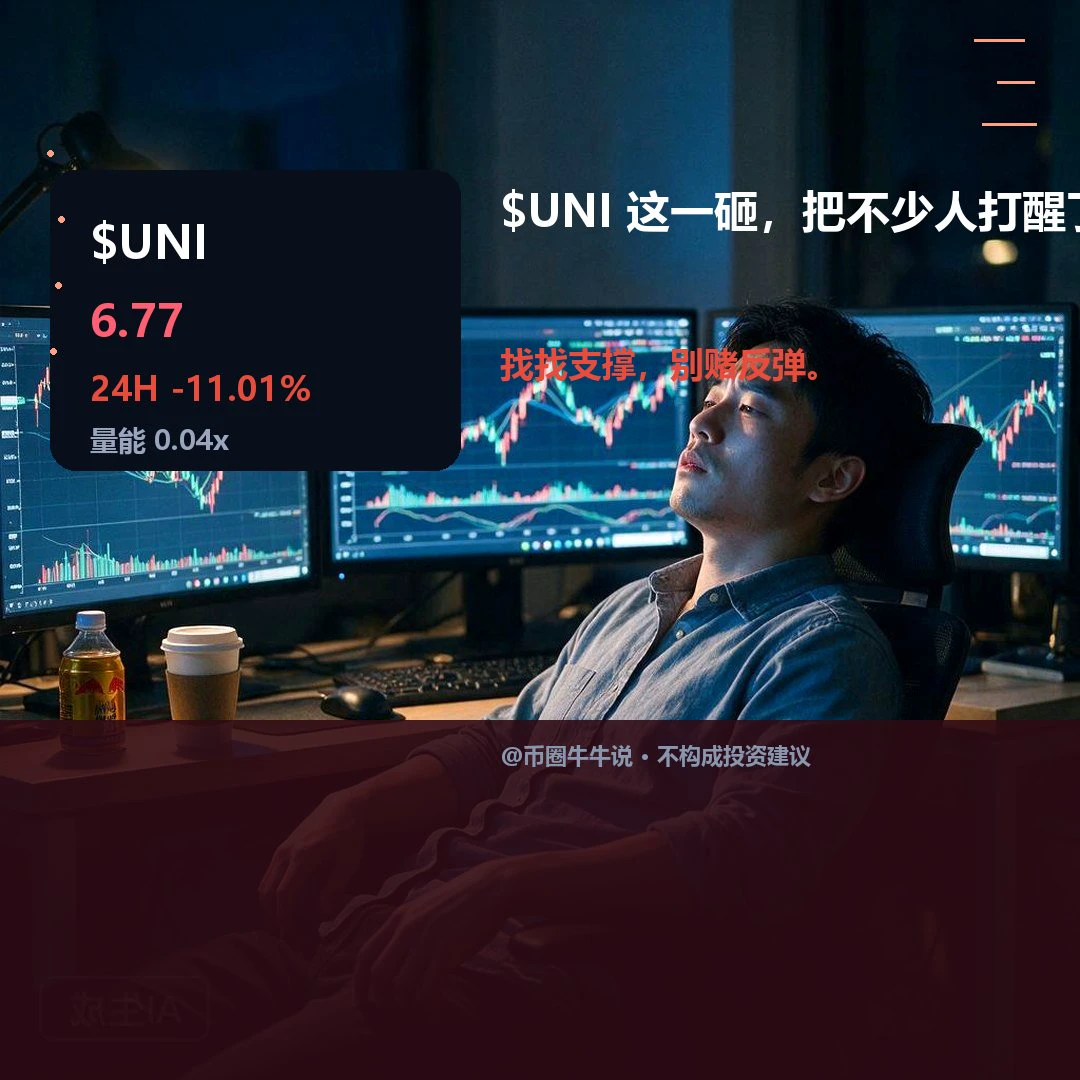
$UNI Currently trading at 6.773, down 11.01% over 24H (6.616–7.82). Weak on the 1H: RSI 18.99, with price below the EMA20 at 7.221; weak on the 4H: RSI 40.84, with price below the EMA20 at 7.266. The 1H volume ratio is 0.04. If price holds above the 7.82 resistance level, watch for a continuation; if it breaks below the 6.616 support level, near-term momentum will weaken. In the next review, check whether price can hold above 7.82 and recover after losing 6.616. Volume is only 0.04 times average, so a single breakout still needs confirmation from participation; a breakdown that cannot be recov
post-image
UNI+3.05%
Load More

Join 40 M users in our growing community

⚡️ Join 40 M users in the crypto craze discussion

💬 Engage with your favorite top creators

👍 See what interests you

Trending Topics

GateLaunchesPoSECProofOfSecurity

7.69k Views542 Discussing

Beyond Proof of Reserves, Gate has introduced PoSEC, a new Proof of Security framework focused on how user assets are stored and protected. By disclosing the distribution of assets across cold storage and hot wallets, users can directly understand Gate’s storage structure and risk coverage under extreme scenarios. Gate’s latest cold storage coverage ratio stands at 104.58%, meaning cold-storage assets alone are sufficient to cover all user assets. PoR verifies whether reserves are sufficient, while PoSEC shows how assets are stored and how risks are covered — together forming a more complete asset security framework. Share your results and experience! [👉 Learn more](https://gate.com/proof-of-security)

BTCBackAbove80K

126.19k Views41.58k Discussing

DemocratsWinBothChambers

28.37k Views529 Discussing

View More