Square
Following
Hot
News
Notifications
Profile
Share your thoughts
placeholder
Article
#Gate股票畅聊季 #美股财报季
US Earnings Season: Can Corporate Results Drive the Next Major Move in the Stock Market?
The US earnings season is one of the most important periods for global financial markets. During this time, publicly listed companies release their quarterly financial results, providing investors with a clearer picture of business performance, revenue growth, profitability, and future expectations.
As investors evaluate corporate earnings, attention is shifting toward major technology companies, artificial intelligence businesses, semiconductor manufacturers, financial institutions, and
#Gate股票畅聊季 #美股AI板块遭遇重挫 #作手分析 #WCTCS9
🔥 AI sector rebounds after plunge: Has the industry outlook changed? Could Anthropic’s IPO become a turning point?

Trading focus: $NVDA $AMD $GOOGL $BTC

On November 5, U.S. AI stocks took a beating: the Nasdaq fell 5.5%, the Philadelphia Semiconductor Index dropped about 12.2%, Nvidia fell 9.3%, and AMD plunged 17.3%.

Does this mean the AI industry outlook has changed, or is it a concentrated repricing of high valuations and capital expenditures?

I. The long-term AI trend remains intact, but short-term valuations need to be reassessed

After the U
NVDA+2.80%
AMD+11.55%
GOOGL+0.72%
BTC-0.65%
NDAQ+0.28%
  • 1
Trenches
ZIG
Z
bade
b
ZIG
0x8c...1145
Market Cap
$.
Change
.
24h Vol
$.
Holders
.
STONK
S
bade
b
STONK
6GmA...UNgx
Market Cap
$.
Change
.
24h Vol
$.
Holders
.
CLAUDIA
C
bade
b
CLAUDIA
2j5S...W2ZM
Market Cap
$.
Change
.
24h Vol
$.
Holders
.
IDOL
I
bade
b
IDOL
0x3b...ab07
Market Cap
$.
Change
.
24h Vol
$.
Holders
.
FLOAT
F
bade
b
FLOAT
Bv1a...BMmr
Market Cap
$.
Change
.
24h Vol
$.
Holders
.
Cetus’s Pro menu includes LP Pro, alongside Token Pro.
It’s designed specifically for viewing liquidity pools on Sui.

LP Pro’s table lays out everything about a pool at a glance: whether anyone is trading in it, how much it has collected in fees, whether it offers additional rewards, and how long it’s been open.
When evaluating a pool, pay special attention to Volume/Liquidity.
Dividing the 24-hour trading volume by Liquidity (the funds in the pool) gives you a rough idea of how efficiently the pool’s capital is being used.
For example, between two pools with similar liquidity, the one with h
CETUS-1.62%
SUI-1.05%
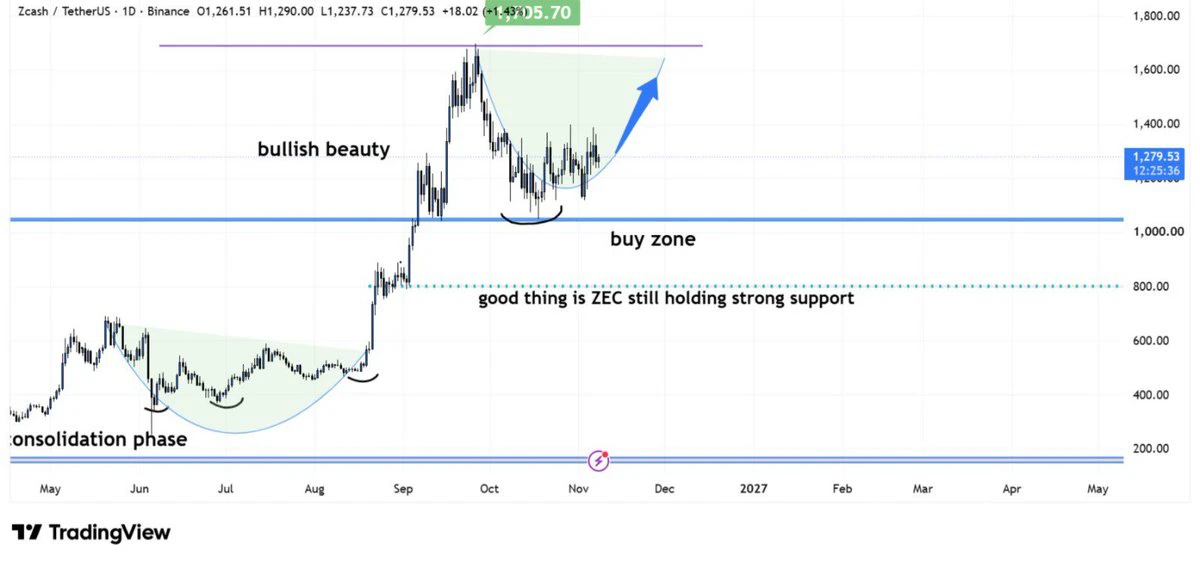
$ZEC is showing a beautiful bullish structure on the daily chart. Price is holding strong above the $1,000 buy zone and a bullish reversal pattern appears to be forming.
If support continues to hold, we could see another strong rally toward $1,500–$1,650.
post-image
ZEC+1.16%
Pirate ship 🚢
Can we go on an adventure once we board? 🤔
🔹 Prediction markets assign a 52 probability that Bitcoin will rise to $70,000 by the end of 2026
live-cover
LIVE1,402
#NEAR

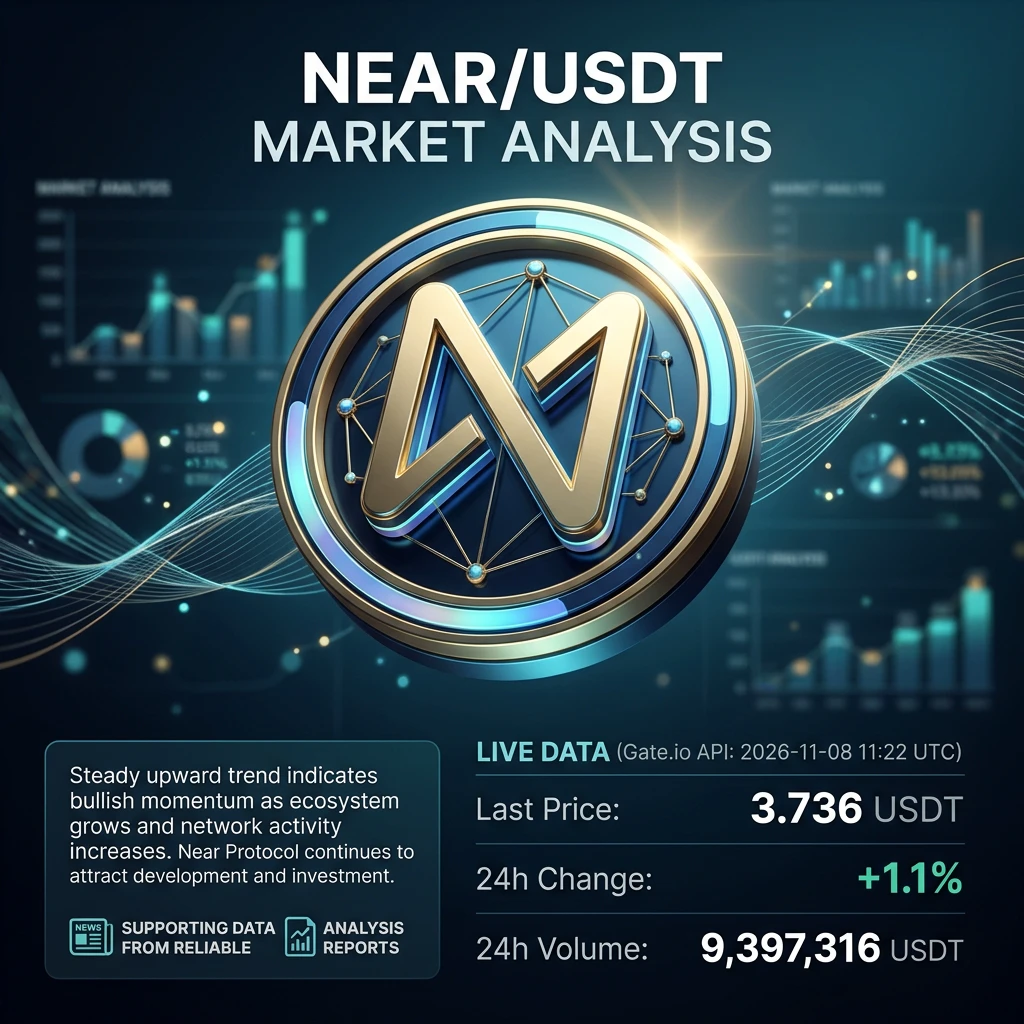
NEAR Edges Higher: Myth vs Fact Behind Its Latest Market Move

Myth 1: A Green 24-Hour Move Means a Strong Bullish Trend

Fact: The Current Increase Is Positive, but Still Limited

NEAR is showing a positive move, but the size of that increase deserves attention. At 11:22 UTC on November 8, 2026, NEAR/USDT was trading at $3.736, up 1.1% over the previous 24 hours. Trading volume during the same period was approximately $9.39 million.

This indicates that NEAR has maintained a positive short-term direction. However, a 1.1% increase alone does not confirm that buyers have taken control o
post-image
BTC-0.67%
$ZEC The liquidation map for the past 30 days shows:
If ZEC rises to $1,414, cumulative short liquidation intensity on major exchanges is $89.1 million.
If ZEC falls to $1,117, cumulative long liquidation intensity on major exchanges is $136 million.

Trading strategy:
Place a limit order to go long at $1,117; long liquidation intensity is greater below, so exercise caution when going long.$ZEC ‌
ZEC+1.29%
Prediction markets assign a 52 percentage probability that Bitcoin will rise to $70,000 by the end
live-cover
LIVE2,775
$NVDA ‌Let’s gooooo! Love you, mwah!😘😘😘😘😘😘😘😘😘😘😘😘😘😘😘😘😘😘😘😘😘😘😘😘😘😘😘😘😘😘😘😘😘😘😘😘😘😘😘😘😘😘😘😘😘😘😘😘😘😘😘😘😘😘😘😘😘😘😘😘😘😘😘😘😘😘😘😘😘😘😘😘😘😘😘😘😘😘😘😘😘😘😘😘😘😘😘😘😘😘😘😘😘😘😘😘😘😘😘😘😘
post-image
NVDA+2.80%
$HOT This rally has no volume backing it at all. I've already flipped and opened a short. The funding rate is nearly down to -2; to put it plainly, this market could collapse at any moment.
Trading performance over the past 90 days: +$1,499.85, return +66.05%. HOT is currently up +25.00%. Risk warning: The above is only a record of my personal trades and does not constitute investment advice. Contract trading involves extremely high risk, so please be sure to manage your position size.
post-image
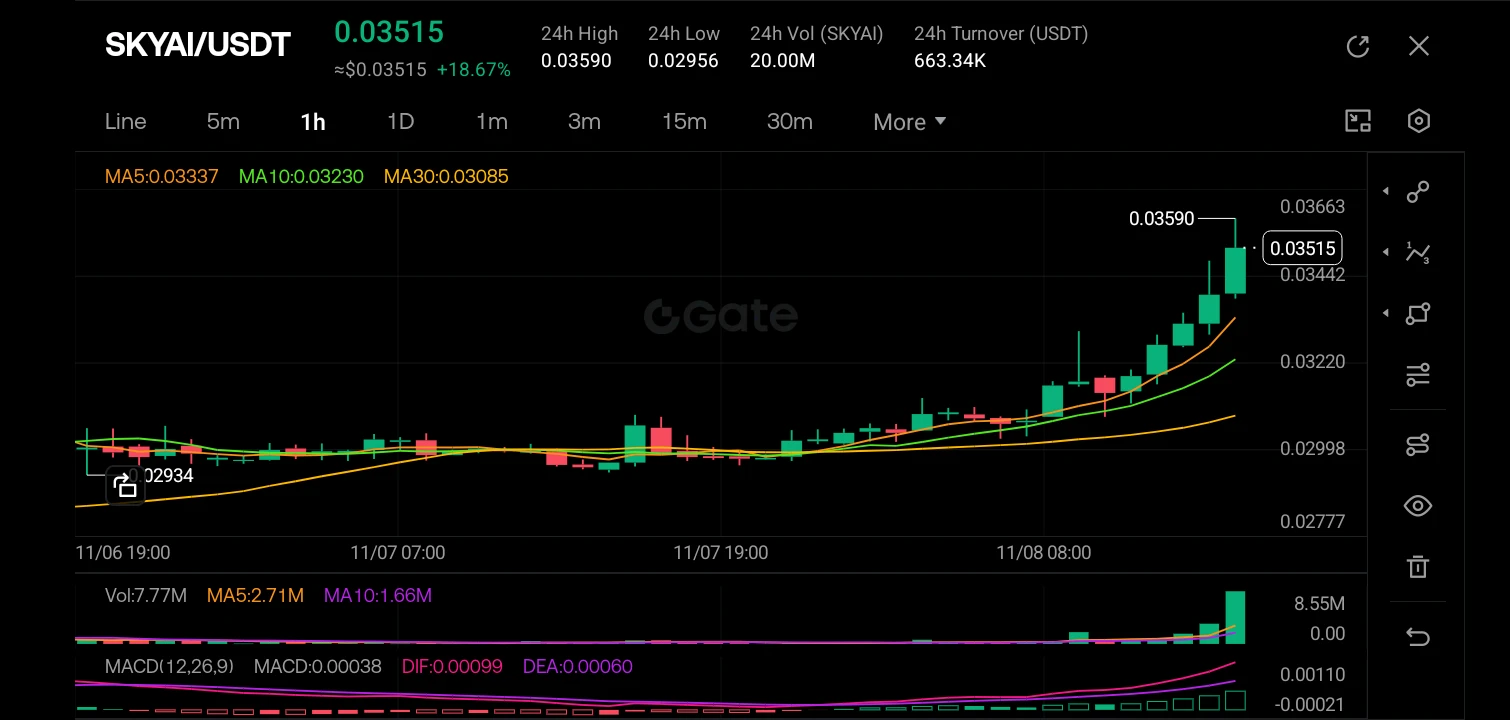
$SKYAI ‌
The chart has bullish breakout structure. After a prolonged period of sideways consolidation between roughly 0.0293 and 0.0300, the price has exploded to the upside, currently trading at 0.03515 with a massive +18.67% gain. The Moving Averages (MA5, MA10, MA30) are fanned out in perfect bullish alignment, acting as dynamic support. Volume confirms the move, surging significantly on the breakout candles. The MACD is also expanding bullishly, with the DIF line crossing well above the DEA line and both trending upward.

The most prominent candlestick pattern here is a series of strong B
post-image
SKYAI-7.58%
  • 2
#ICNT

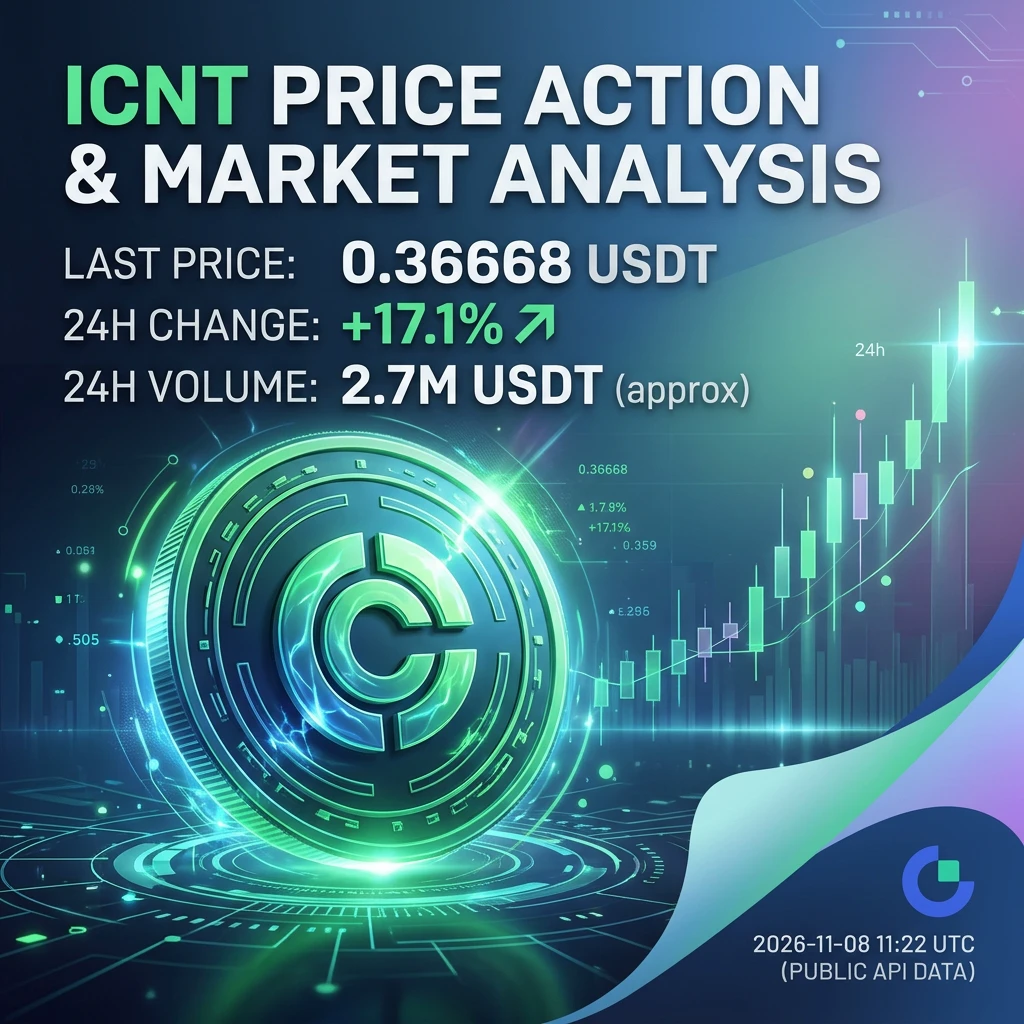
ICNT Rises 17.1%: What Happened, What Comes Next, and Where Are the Risks?

What Are Traders Asking Right Now?

ICNT has attracted attention after a strong upward move against USDT. The important question is not simply why the price increased, but whether the buying activity can support further growth or whether the market is approaching a period of profit-taking.

At 11:22 UTC on November 8, 2026, the supplied market snapshot recorded ICNT/USDT at 0.36668 USDT, representing a 17.1% increase over 24 hours. Reported trading volume was approximately 2,773,050 USDT.

These figures show a
post-image
ICNT-10.32%
$JCT $JCT has seen several consecutive waves of sharp drops, all suddenly plunging more than 40%! This 🐶 market maker is playing rapid dumps and pumps—hold tight to your 🈳 positions!
post-image
JCT-3.26%
🤖 Vitalik Buterin believes slowing the construction of giant AI data centers would do more good than harm. In his view, algorithmic efficiency gains would make it possible to achieve the same capabilities with existing infrastructure, about two years later.
The Ethereum co-founder believes this slowdown would give society more time to address cybersecurity and biosecurity risks, and that a one-year delay in AI would not significantly delay scientific research.
post-image
ETH-1.26%
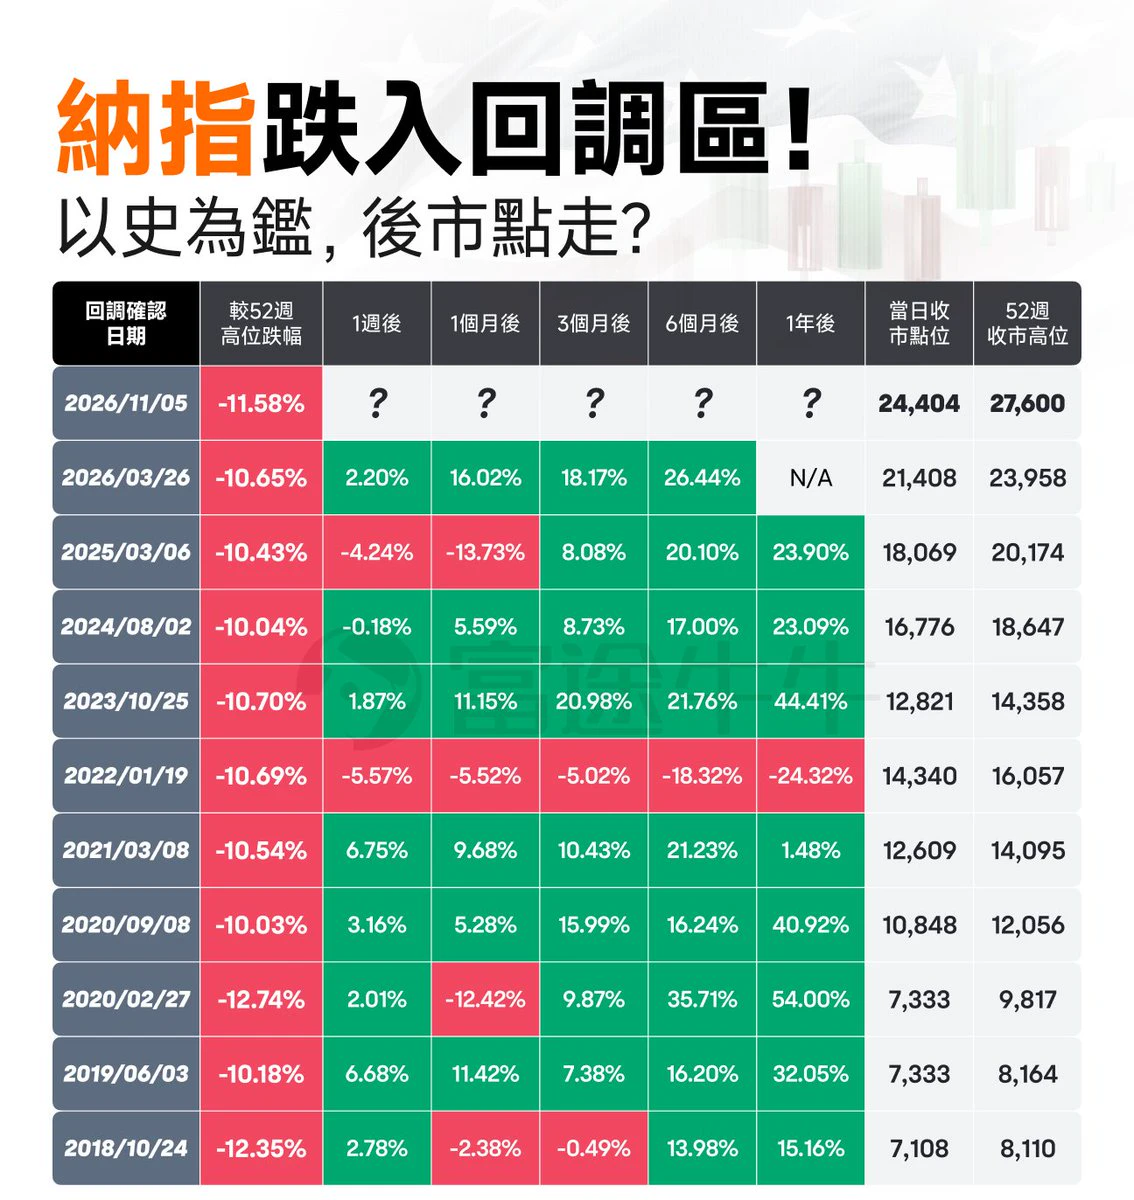
This statistic is very interesting: the last 10 times the Nasdaq fell 10% from its peak, how long did it take to recover
There was an 80% chance of recouping losses after 1 week and a 90% chance of being back in positive territory after 6 months
But the only exception was in January 2022, when it took a full 2 years. The reason sounds familiar: inflation led the Fed to raise rates, Treasury yields surged, and tech stocks were crushed
post-image
NAS100-0.07%
I control the market, slaughtering both bulls and bears!
BTC and ETH fire in both directions: bait longs at the top and precisely lay in wait with shorts; once the bottom stabilizes, reverse course and go long. Every turning point is locked in ahead of time, price levels nailed down, and the market obediently follows the forecast.
A screen full of closed-position records is the best proof: returns of several times over are realized one after another, trade after trade, harvesting nonstop!$BTC ‌$ETH

#CPI数据前瞻
BTC-0.65%
ETH-1.23%
#ARIA

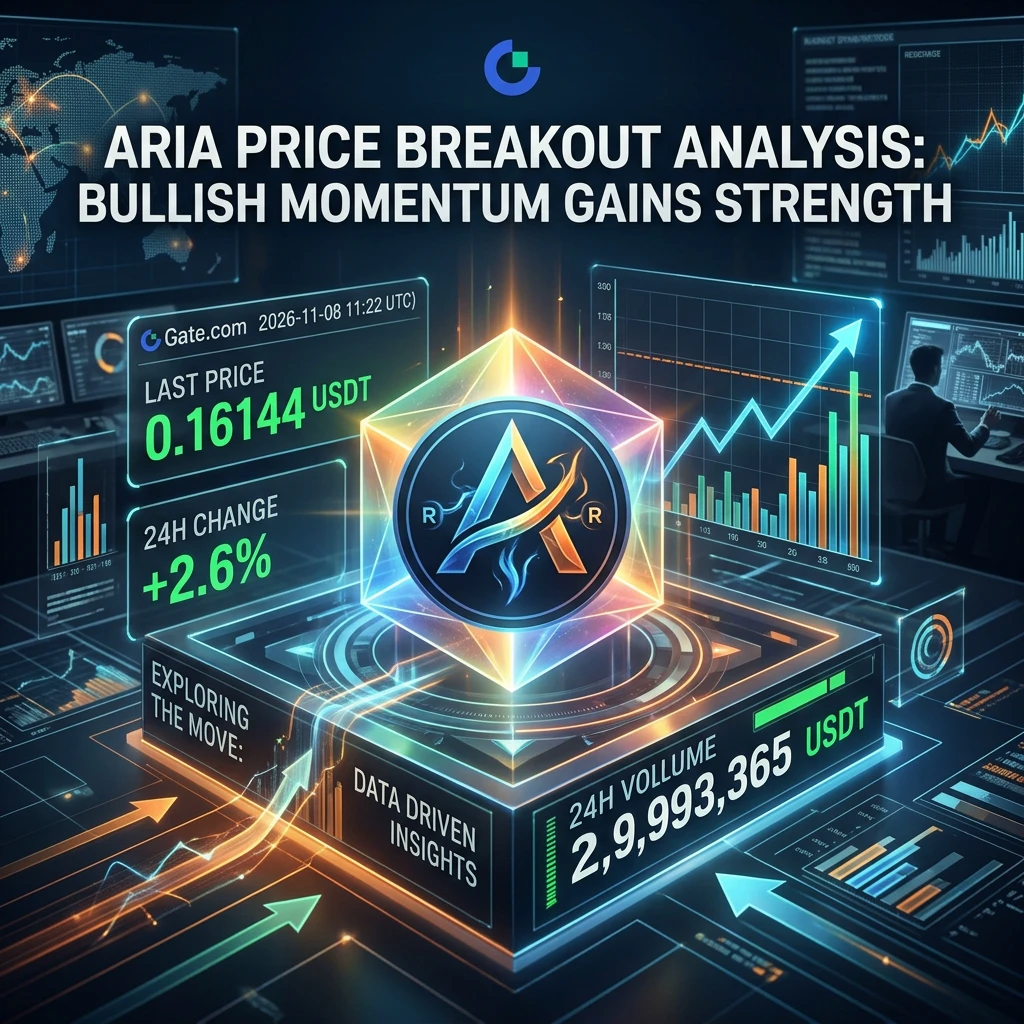
ARIA at $0.16144: Is This a Sign of Stronger Demand or Just a Short-Term Move?

What Is Happening With ARIA?

Is ARIA building genuine buying momentum, or is the latest price increase simply a short-term market move? That is the important question traders should consider before making a decision.

As of November 8, 2026, at 11:22 UTC, ARIA/USDT was trading at $0.16144, showing a 2.6% increase over 24 hours. Its 24-hour trading volume was approximately $2,993,365 USDT.

These figures show positive price movement alongside meaningful trading activity. However, they do not automatically c
post-image
ARIA+22.03%
Shatter the illusion of perfection
Take off the filter and see life as it really is
Inner harmony is the ultimate destination
post-image
#WCTCS9 #广场交易达人 Gold bulls and bears battle; crude oil consolidates and recovers

Spot gold: Gold formed a volatile pattern this week, rebounding from its lows before rallying and then pulling back. The weekly candle had a long upper wick, showing that buying support remains at lower levels, while selling pressure overhead is also significant.
Spot gold is currently consolidating near $4,070/oz. After dipping to around 4,029 intraday on Friday, it rebounded, with bulls and bears locked in a short-term tug-of-war.
Gold remains driven in the short term by interest rate expectations and the dolla
CL-1.83%
  • 3
Load More

Join 40 M users in our growing community

⚡️ Join 40 M users in the crypto craze discussion

💬 Engage with your favorite top creators

👍 See what interests you

Trending Topics

USCPIDataIncoming

7.61k Views1.57k Discussing

The U.S. October CPI report will be released on November 10 at 8:30 a.m. ET. September CPI came in at 3.7% year over year, and markets will be watching closely for signs that inflation is cooling, especially in core CPI. A softer-than-expected reading could strengthen rate-cut expectations, while hotter inflation may pressure risk assets through higher Treasury yields and a stronger dollar. How do you think this CPI print will move $BTC, U.S. stocks and gold?

USAIStocksHitHard

26.63k Views3.72k Discussing

USNonfarmPayrolls

49.41k Views4.46k Discussing

View More