









Share your thoughts
placeholder
Article
$SNDK What Does SanDisk’s Inclusion in MSCI Mean?
On August 12, 2026, MSCI announced its quarterly index review results. Effective after the close on August 31, 2026, SanDisk (SNDK) was added to the MSCI All Country World Index (ACWI). Also added were 55 companies including Carpenter Technology (CRS) and ATI Inc (ATI), while another 92 were ruthlessly removed. SanDisk reversed its late-session decline and rose more than 5%, entering the MSCI global index after today’s close.
The ETF tracking MSCI World is the iShares MSCI World series, while ACWI corresponds to the iShares MSCI ACWI ETF (ACWIU
post-image
SNDK+11.88%
MSCI-0.29%
CRS+1.72%
ATI+2.91%
MU+5.89%
This $PONS long position has been quite a grind. There was one downward spike in the middle that swept out quite a few short chasers, coming just a few points away from my protective level. I did not manually cut the position at the time because the four-hour structure had not broken down.
I entered based on a double bottom on the hourly chart. After the right-side breakout, the price pulled back to the prior high neckline and stabilized. Once confirmed, I went long with the trend. The entry was not particularly cheap, but the stop-loss was very close, making it a case of using limited risk to
post-image
PONS-7.88%
BTC+0.05%
SOL+2.14%
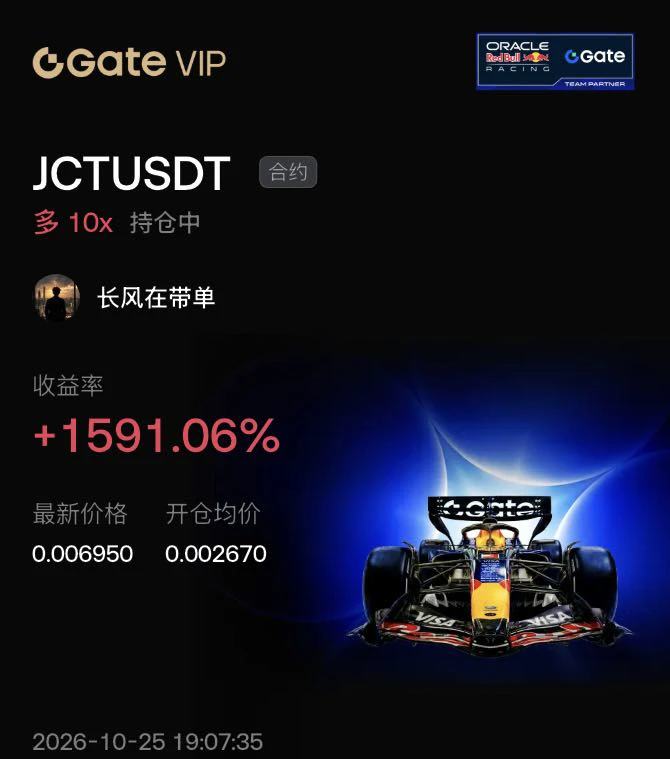
A few days ago, the hand that set the stop-loss trembled slightly; this morning I realized that extra bit of filial piety was unnecessary. When $PENDLE was repeatedly fluctuating intraday, everyone was running, while I was the only one watching the key level.
The key level held, and buying support was always there. This wasn't distribution—it was shaking people out. I decisively opened a long around 1.540, and the price later reached 2.1.
A +2568.2% gain. In one sentence: that was a very satisfying bite.
The brothers on board should have woken up laughing.
Being out of the market isn't a sin;
post-image
PENDLE+5.59%
BNB-2.57%
BTC+0.05%
Everyone’s watching $SPCX /USDT pump—but the 4h chart just whispered a secret that most retail will ignore.

$SPCX /USDT - SHORT

Trade Plan:
Entry: 151.06 – 151.26
SL: 152.44
TP1: 150.20
TP2: 149.56
TP3: 148.60

Why this setup?
- Price is pinned at 151.16 with a **SHORT bias (77% confidence)** while the daily trend says “range”—that’s a compression zone.
- RSI on 15m is only 57.97—not overheated, not cold. It’s a **lull before a snap**, not a breakout signal.
- ATR on 1h (0.41) is tight—meaning the next 4h candle could stretch 3x that move.
- The “Waiting” status + invalidation at 14
SPCX+0.89%
$MARSCOIN 24-hour dump of 22%, with $350 million in trading volume—this isn’t a pullback; someone is throwing their holdings in your face. Here’s the conclusion: if the 0.177 low breaks, there is no meaningful support below, so don’t rush to catch a falling knife.
You’re asking about the macro picture? There is indeed no CPI or nonfarm payrolls today, and the Federal Reserve is still in its blackout period, but don’t forget that last week’s meeting minutes revealed one signal—the internal disagreement over rate cuts is much greater than what the market has priced in. I pulled nearly three year
MARSCOIN-21.21%
BTC+0.01%
NAS100+0.22%
Everyone’s long ZEC—but my 4h chart just whispered a secret that could ruin your Friday.

$ZEC /USDT - SHORT

Trade Plan:
Entry: 1206.8 – 1222.6
SL: 1313.6
TP1: 1140.5
TP2: 1091.0
TP3: 1016.8

Why this setup?
- RSI on the 15m is still hot at 61, while price stalls under 1214.7—momentum is fading, not flipping.
- With 84% confidence on a SHORT and TP1 at 1140.5, the risk/reward from 1222.6 to 1091 (TP2) is nearly 1:3.
- The bullish 1D trend is the trap: it’s pulling in late buyers right as the 4h structure rolls over.
- Why now? Because ATR (31.7) says volatility is expanding—and it’s
ZEC+22.69%
A sincere piece of advice: trade fewer altcoins and focus more on major coins.
Looking at SNDK and ZEC, how many people were completely wiped out by the extreme market moves?
Over the past two days, watching SNDK and ZEC take turns delivering extreme roller-coaster moves has left me with a lot of thoughts. Many friends were drawn in by the narrative of explosive price increases and rushed in out of FOMO, only to see the market quickly reverse and their accounts get completely wiped out. Some others ended up deeply trapped in their positions.
This is how small-cap coin markets work: when short
ZEC+22.69%
SNDK+1.18%
$ARB broke above the previous high but did not accelerate immediately, instead quickly pulling back. I treated the breakout level as a key reference level and entered long when the pullback held above it. This was a standard breakout-and-pullback confirmation; as long as this level held, the logic remained unchanged.

After entry, the price did not continue pulling back and instead rose directly. During the first surge, I took profit on 70% as planned, while gradually moving the protection level higher on the remaining 30% to let the profits run.

The biggest taboo during this process is fre
post-image
ARB+10.24%
ETH+0.73%
DOGE+0.09%
I originally wanted to cut my losses as a sacrifice to the heavens, but the ceremony never happened—the meat cooked itself instead🍖A few days ago, the last thing I saw before bed was $SEI pushing slightly higher again, but the volume looked nothing like a genuine breakout. The selling pressure was massive, with someone dumping every time it surged. I thought to myself, if I don't short this level, I'd be letting myself down, so I entered directly at 0.06851. Feeling great, brothers😎

The subsequent price action gave me the complete answer, sliding all the way from my entry price to 0.04914.
post-image
SEI+3.30%
XRP+0.36%
ADA+0.50%
I didn’t do a thing—just went to the restroom, and when I came back, the candlestick chart had already done the work for me. 😂
When I opened the market this morning, $ETH /ETH had just started moving, and volume suddenly surged. Funds were quietly flowing in, buying pressure kept getting stronger with every sell-off, and the pullbacks showed no hesitation at all. I issued a long signal at 2451.64 and entered directly.
Looking again now, the current price is 2498.48, +331.7%. Those already on board must be waking up laughing—this move was purely a gift to the early risers. 😌
Don’t get greedy w
post-image
ETH+0.73%
SNDK+1.18%
XRP+0.36%
Honglu Di team
Sincerely bow three times
Make a great fortune this year
MARKET prediction
live-cover
LIVE55
Everyone’s watching ARB’s range—but the 4h chart just whispered a secret that most retail is ignoring.

$ARB /USDT - SHORT

Trade Plan:
Entry: 0.18559 – 0.18925
SL: 0.20496
TP1: 0.17426
TP2: 0.16549
TP3: 0.15233

Why this setup?
Why now? The 1D trend is flat, yet the 4h structure is screaming SHORT with 55% confidence. RSI on 15m is at 59.58—not overheated, but stalling right under entry resistance (0.18742). ATR (0.00731) shows tight coils; break below 0.18559 opens the trapdoor to TP1 at 0.17426. This isn’t a reversal—it’s a range rejection play.

Debate:
If ARB taps 0.18925 first, do yo
ARB+10.24%
how’s your weekend going?
post-image
#BTC Morgan Stanley is quietly buying Bitcoin, while market makers are opening short positions—which side are you on?
On one side, traditional financial giants are adding to their Bitcoin holdings with real money; on the other, crypto market makers are aggressively opening short positions on-chain. The same market, two completely opposite bets.
On September 5, these two pieces of news emerged almost simultaneously, once again putting the question of whether institutions are actually bullish in the spotlight.
① Morgan Stanley: 355 BTC bought in 4 days According to on-chain monitoring, Morgan St
post-image
BTC+0.01%
ETH+0.67%
HYPE+2.66%
ASST+1.21%
BMNR-5.48%
I did nothing—just went to the restroom, and when I came back, the candlestick chart had already done the work for me 💨 Before bed last night, I was still thinking about my position. The judgment at the time was simple: it was forming a base without breaking down, and someone would always buy the dip, so there was no need to scare myself. So I didn’t tinker with anything, set my stop-loss, and closed the app.

Then I opened the market this morning, and 2505.95 gave me a direct surprise. This move up from 2111.16 went even more smoothly than I expected. Calculated out, the +3252.19% gain is a
post-image
ZEC+22.69%
SOL+2.14%
Everyone is focused on Bitcoin’s weekly close $BTC
, while I’m focused on taking profits in altcoins 💲🤑
The idea of all coins forming a new bottom has become a distant dream
You took the bait, my bear-market friend... you took the bait 😘
post-image
BTC+0.01%
What can be the AMC top? I’m a bit conflicted.
post-image
AMC-1.11%
Staying cautious on a real bull cycle turn until we get a weekly close above that previous high, especially with USDT dominance back at a massive support zone.
On the smaller timeframe $80,600 is the area I'm watching right now.
post-image
Load More

Join 40 M users in our growing community

⚡️ Join 40 M users in the crypto craze discussion

💬 Engage with your favorite top creators

👍 See what interests you

View More