Square
Following
Hot
News
Notifications
Profile
Share your thoughts
placeholder
Article
$PI Cut your losses; the great waves wash away the sand and reveal gold too
post-image
PI-0.60%
  • 3
Has anyone used the ROG Super Kill monitor
How is it
post-image
Trenches
ZIG
Z
bade
b
ZIG
0x8c...1145
Market Cap
$.
Change
.
24h Vol
$.
Holders
.
STONK
S
bade
b
STONK
6GmA...UNgx
Market Cap
$.
Change
.
24h Vol
$.
Holders
.
IDOL
I
bade
b
IDOL
0x3b...ab07
Market Cap
$.
Change
.
24h Vol
$.
Holders
.
FLOAT
F
bade
b
FLOAT
Bv1a...BMmr
Market Cap
$.
Change
.
24h Vol
$.
Holders
.
BTC
B
bade
b
BTC
C5xp...pump
Market Cap
$.
Change
.
24h Vol
$.
Holders
.
#ELIZAOS

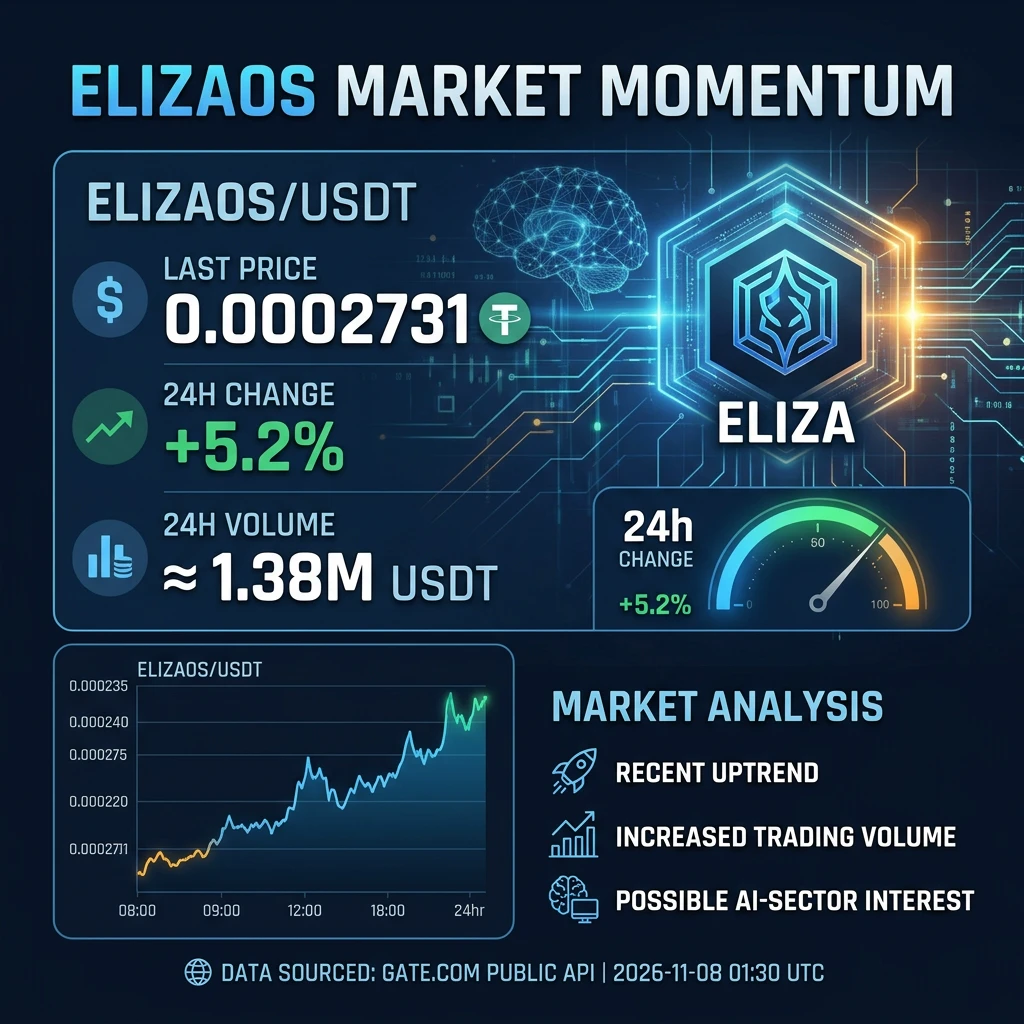
ELIZAOS Rises 5.2%: A Short-Term Recovery Amid Deeper Questions About Project Support

The Number That Deserves Attention

ELIZAOS recorded a 5.2% increase in 24 hours, reaching $0.0002731 against USDT. Its reported 24-hour trading volume stood at approximately $1.37 million. These figures show renewed market activity, but the more important question is whether this movement reflects lasting demand or simply a temporary recovery.

The market data was recorded on November 8, 2026, at 01:30 UTC. For Dragonfly Official, the key point is that a positive daily percentage does not automat
post-image
ELIZAOS-3.63%
  • 1
$UAI Entered at 0.12 with 100U and made over 100, then I didn’t check for a few minutes and got blown up for 400U
post-image
UAI-7.58%
In cryptocurrency trading, many people spend a lot of time analyzing whether BTC will rise or fall, but overlook a more important question: even if your prediction is correct, you may still fail to make money without a reasonable stop-loss and take-profit plan.

Why are stop-losses and take-profits so important?
First, a stop-loss is for controlling risk. When the market moves against your view, exiting in time can prevent a small loss from continuing to grow. This is especially important in futures trading, where leverage magnifies the impact of price movements on your account, so setting ris
post-image
BTC-0.65%
#TRX

TRX Holds Near $0.32: What Is Supporting the Price, and What Could Change the Picture?

A Small Move, but What Does It Tell Us?

Imagine checking your crypto portfolio in the morning and seeing TRX slightly higher than the previous day. The price has not made a dramatic jump, but it is moving in a positive direction. Is this the beginning of a stronger recovery, or simply a period of normal market movement?

As of November 8, 2026, at 01:30 UTC, TRX/USDT was trading at $0.3205, recording a 24-hour increase of 0.8%. Its 24-hour trading volume was approximately $2.65 million USDT.

This i
post-image
TRX+0.42%
BTC-0.67%
  • 1
$SOL is showing long-side liquidation pressure around $89.29, suggesting that leveraged buyers are being flushed from the market. Price is trading near the $89.80 area, where buyers need to defend demand and reclaim nearby resistance. SMC liquidity suggests a potential recovery if selling pressure weakens and volume confirms a bullish shift.
Support: $88.50 – $89.00
Resistance: $91.00 – $92.20
Next Target: $94.00 – $96.00
Bullish Confirmation: A strong reclaim above $92.20 could attract fresh buyers and open the path toward $94+. Losing $88.50 may expose lower liquidity.
Let's go $SOL 🚀
post-image
SOL-0.77%
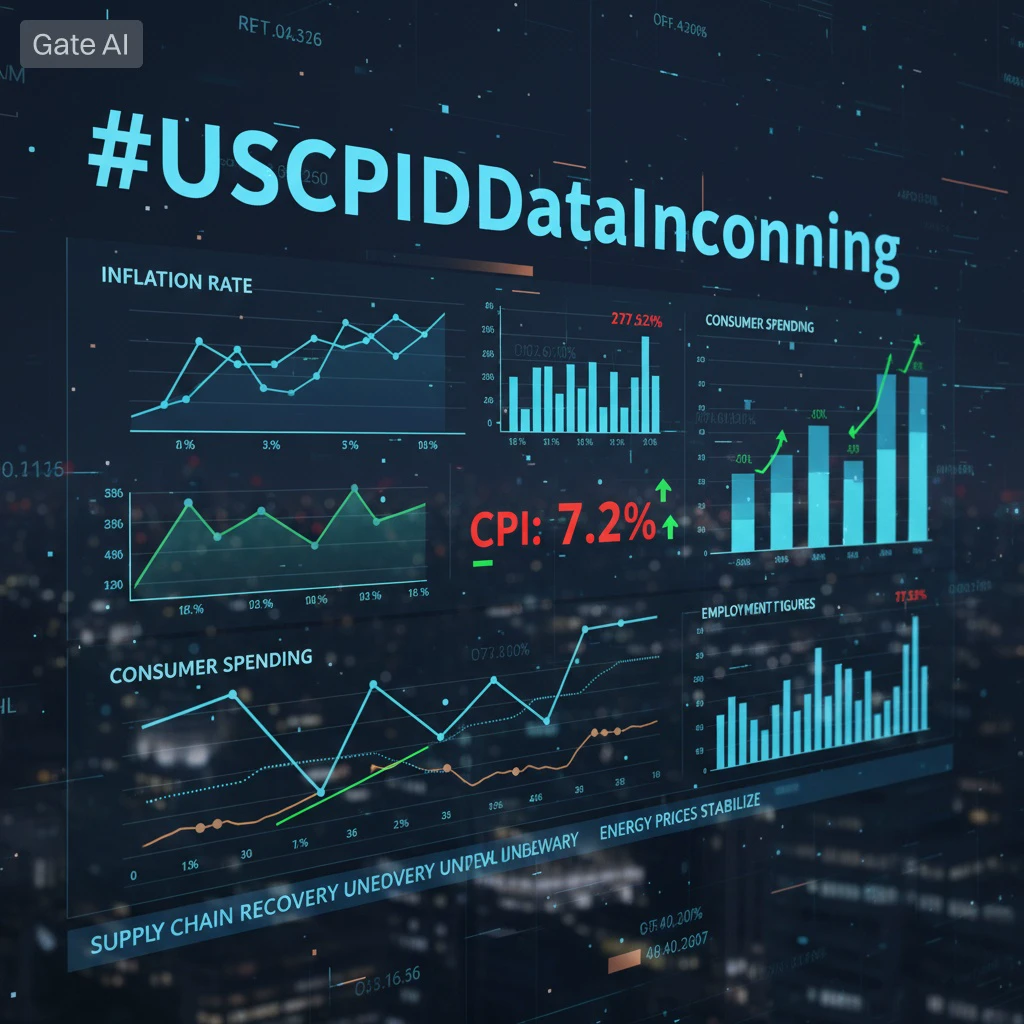
#USCPIDataIncoming #每周来晒
Unpacking the October CPI Scenarios and Monetary Crossroads

The global financial system is bracing for a high-stakes macroeconomic checkpoint as the U.S. Bureau of Labor Statistics (BLS) prepares to release its October Consumer Price Index (CPI) report on Tuesday, November 10, 2026, at 8:30 AM ET (6:30 PM Pakistan Time). Following the exceptionally robust October Nonfarm Payrolls report (+165,000 jobs, 4.1% unemployment), this inflation print serves as the ultimate decider for the Federal Reserve's final monetary policy track of the year.
Traditional equities, digita
post-image
GAS-0.57%
SPX500+0.19%
XAU+0.38%
BTC-0.67%
  • 1
  • 1
BTC, go long around the current price of 75,700, stop-loss at 74,800, target around 78,000. $BTC
post-image
BTC-0.67%
OpenAI CFO: Data center investments will not change due to the midterm elections.
live-cover
LIVE1,867
This father-son relationship is probably beyond saving, huh😂
post-image
#BTCETFOutflowsContinue

BTC ETF Outflows Continue: Is Institutional Demand for Bitcoin Losing Momentum?

What Is Driving the Latest Withdrawals?

Are investors losing confidence in Bitcoin, or are they simply becoming more cautious after a period of market uncertainty? This is an important question as US spot Bitcoin ETFs continue to record net outflows, raising concerns about institutional demand and the direction of the crypto market.

The latest figures show that selling pressure through Bitcoin investment funds remained significant during the first week of November 2026. However, underst
post-image
BTC-0.67%
  • 3
[new streamer]MARKET UPDATE
live-cover
LIVE411
$SOL Can it make it back to $200? This question has been asked a lot lately. First, let’s look at some real data: one trader shared a portfolio showing $SOL down 1.32% and $GIGGLE down 2.25%, yet the cumulative PnL was +1,042.83 USDT—showing that they rely not on simply holding one coin, but on timing and position management. Back to SOL itself: $200 won’t happen just because people call for it. It depends on whether on-chain activity can remain strong, whether ecosystem projects have new narratives, and whether broader market liquidity is favorable. SOL’s last rally was driven by the meme
post-image
GIGGLE-1.51%
#USCPIDataIncoming
Mark your calendars. The next major U.S. inflation print drops in less 48 hours
This is the last CPI before the December FOMC meeting, and markets are already positioning. After two consecutive hotter-than-comfortable prints, the consensus is looking for a cooldown. But “cooling” is relative when the year-over-year rate is still sitting well above the Fed’s 2% target.

Quick Recap of the September Print (Released Oct 14)
- Headline CPI: **+0.6% month-over-month**, **+3.7% year-over-year**
- Core CPI (ex-food & energy): **+0.3% m/m**, **+2.6% y/y**
- Gasoline alone jumped *
XAU+0.38%
BTC-0.67%
A brief analysis of BTC short-term trends from Dow Theory, Chan Theory, Elliott Wave Theory, volume-price relationships, order flow, and price action (strategy recommendations)
Comprehensive assessment
Dow Theory confirms that the break below 75,000 has accelerated the bearish trend + volume is contracting as the market consolidates
Chan Theory: Each stroke makes a new low; the 75,460 potential bottom fractal is unreliable due to low volume
Elliott Wave Theory: Subwave ③ of Wave C's fifth wave is nearly complete (74,791 is just 31 points above the 1.0× target); a subwave ④ rebound could begin
BTC-0.67%
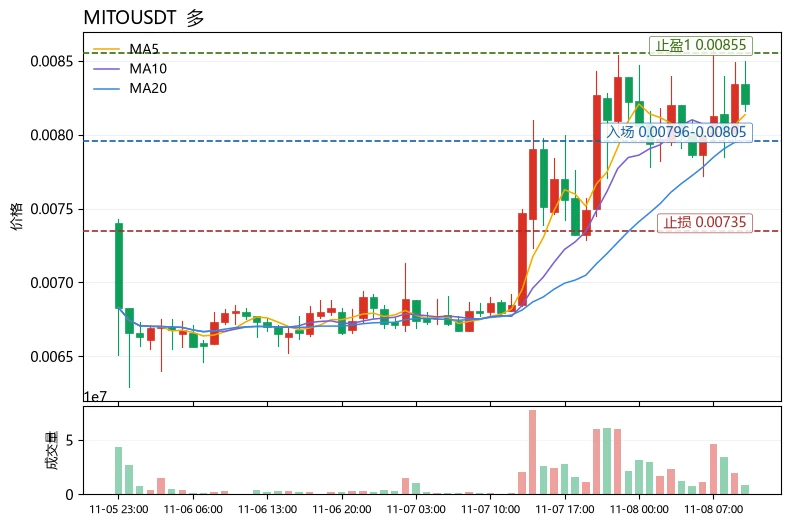
$MITO Short-term bias is bullish, but this is a low-tolerance trade amid high volatility, so the position must be kept below half the usual size. Rationale: The current price of 0.00821 is above MA5 (0.008136) and MA20 (0.0079635), with the moving averages in a bullish alignment; however, the MACD histogram remains negative (-1.393e-05), indicating that upward momentum is not yet confirmed. RSI at 59.2 has also not entered the strong zone, and the 30-candle amplitude is as high as 23.51%, making this a typical high-volatility asset. The Fear & Greed Index is at 28, in the fear zone; sentiment
post-image
MITO+8.51%
HYPE+0.24%
ETH-1.26%
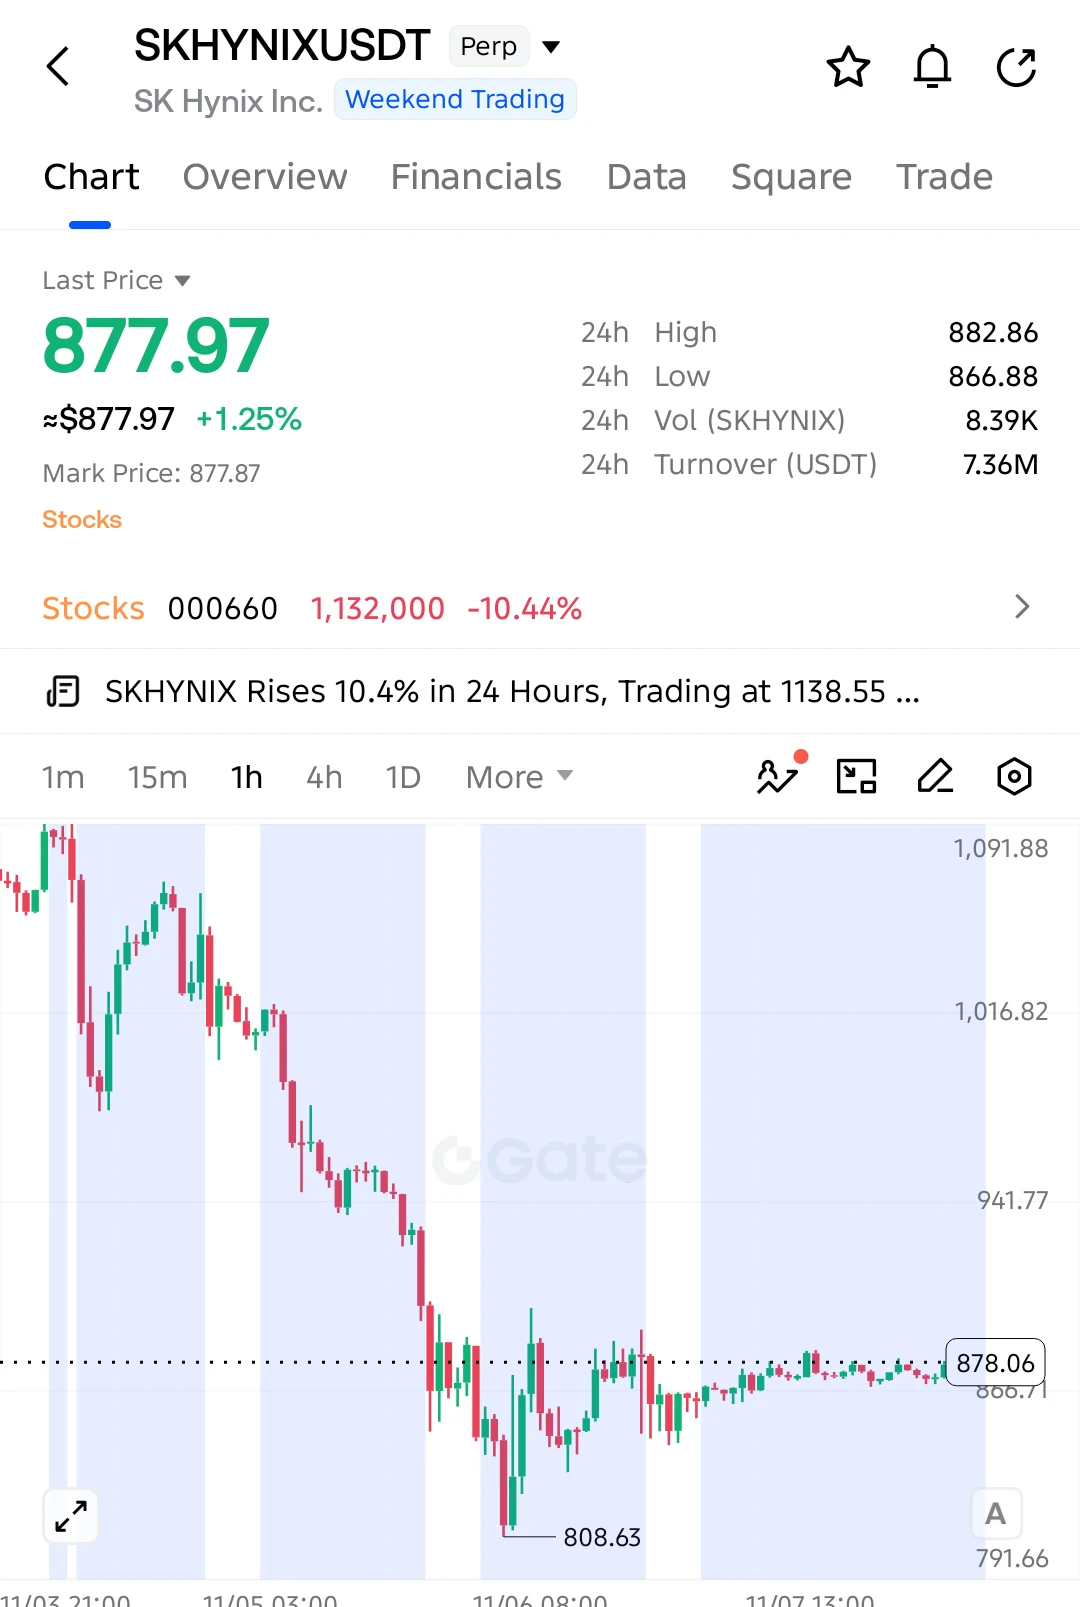
$SKHYNIX LONG SETUP — BIG RECOVERY AHEAD?

$SKHYNIX is showing signs of stabilization after a massive sell-off. Buyers are defending the 866 support area, with a potential recovery developing!

Entry: 877.97
SL: 865.00

TP1: 892.50
TP2: 905.00
TP3: 920.00
Final Target: 938.86

Selling pressure has eased as price consolidates near 878. Buyers are gradually rebuilding strength, and a breakout above 882.86 could open the door toward 905 and higher.

Invalidation: A sustained break below 865.00 weakens the bullish setup.

Keep your eyes on $SKHYNIX!
post-image
SKHYNIX+1.41%
$UAI That hit took back the 23,000 I’d just made back in my account. Yesterday I was enjoying the view above 0.15; today it’s straight down to 0.0799, down 43.49% in 24 hours, with trading volume at 74.6M—this isn’t a pullback; it’s wiping out leveraged traders wholesale.
But after taking a loss, it’s time to get to work. I pulled the data again: the 24-hour low is 0.0766, and the current price is 0.0799, just 4% off the bottom. A trading volume of 74.6M isn’t massive for a drop this sharp, which means panic selling hasn’t fully played out, but there’s also no death signal of liquidity drying
UAI-7.58%
  • 1
AIOT | Long 🟢 | Bullish | 15-minute, 24-hour: +16.51% | Volume: 26.6M USDT Long rationale: Price is above EMA200; EMA20/50/200 are in bullish alignment; RSI14 is 71.6; MACD histogram is positive; ADX14 is 24.2; volume is 5.65 times the average of the past 20 candles; trend pullback/continuation. Entry price: 0.12148 Stop-loss: 0.113301 Target 1: 0.131704 | Target 2: 0.137839 | Target 3: 0.146018Entry price is for reference only; do not chase the price. The strategy is invalidated if the stop-loss level is hit. Technical pattern analysis only; this is not investment advice. $AIOT
post-image
AIOT-2.28%
Load More

Join 40 M users in our growing community

⚡️ Join 40 M users in the crypto craze discussion

💬 Engage with your favorite top creators

👍 See what interests you

Trending Topics

USCPIDataIncoming

188 Views1.46k Discussing

The U.S. October CPI report will be released on November 10 at 8:30 a.m. ET. September CPI came in at 3.7% year over year, and markets will be watching closely for signs that inflation is cooling, especially in core CPI. A softer-than-expected reading could strengthen rate-cut expectations, while hotter inflation may pressure risk assets through higher Treasury yields and a stronger dollar. How do you think this CPI print will move $BTC, U.S. stocks and gold?

USAIStocksHitHard

23.2k Views3.69k Discussing

USNonfarmPayrolls

39.23k Views4.37k Discussing

View More