


Share crypto content and earn up to 60% commissions through content mining.
placeholder
gatefun
In the period leading up to August 28, the green line’s bearish expectation of breaking below 90 briefly surged, and the market at one point priced in the risk of a deep correction; afterward, that expectation steadily declined.
The blue line (breaking below 100) rose steadily, with bearish expectations continuing to strengthen, eventually becoming the absolute main theme of the market.
The black curve’s surge to 120 saw only a slight uptick near month-end; bullish sentiment remained depressed throughout, with no meaningful rebound impulse.
View Original
post-image
  • Reward
  • Comment
  • Repost
  • Share
JUST IN: U.S. spot Bitcoin ETFs posted a net outflow of $201.9M, snapping nine days of prior inflows. If this signals a shift in holders, watch for near-term liquidity shifts in $BTC.
BTC-2.99%
post-image
  • Reward
  • Comment
  • Repost
  • Share
Four members of the master-disciple group
0x15947abfd9711984e19c70bd99ee189761af7777
0x1d7658a32cdba3f55d1dc6f0a322ae4499d27777
0x01856bda968ddca3ae5f866a4e07405480967777
0x482f95fa469c43a0419e4a31a53b70a4b95c7777
View Original
post-image
  • Reward
  • Comment
  • Repost
  • Share
#Gate7DayNetInflowsTop3
🔥 Gate 7-Day Net Inflows — Top 3 Globally!
Capital flow is one of the most useful indicators for understanding where market liquidity is moving. Recent DefiLlama data showed Gate recording $75.23 million in net inflows over a 7-day period, placing it among the Top 3 global centralized exchanges.
This is more than just a single-day volume spike. Strong net inflows over a full seven-day window can indicate that capital is continuing to enter the platform rather than simply moving through it temporarily.
📊 Why 7-Day Net Inflows Matter
🔹 Liquidity: Higher net inflows ca
post-image
  • Reward
  • Comment
  • Repost
  • Share
I meant to cut my losses and sacrifice them to the heavens, but the heavens never got their offering—the meat roasted itself.
When I first saw the bearish news, I was nervous too, but the chart told me one thing: the rebound had no volume at all. Every push upward fell just short, and no one bought in—classic bull-trap behavior. As the market kept swinging intraday, I told my bros: Don’t panic. This rebound is weak, so hold your shorts. The market will give us the answer later.
I entered the short at 0.09355. I just refreshed the page, and there it was: 0.03227, +3154.07% secured. Feels great—
SNDK2.47%
SOL-2.65%
View Original
post-image
  • Reward
  • Comment
  • Repost
  • Share
No vision, can’t hold, the profits on this move are paper-thin, but I love it.

The first thing I did when I opened the charts this morning was check whether the short position from a few days ago $ARB was still open. The rebound lacked momentum, every push upward fell just short, resistance above was obvious, and selling pressure was firmly suppressing the price. That’s when I knew this trade had potential. The short was entered at 0.10881. I didn’t add to the position or stubbornly hold through it—I just watched it move down, feeling more at ease with every drop.

Now it has reached 0.087
ARB-2.33%
DOGE-2.65%
BTC-2.42%
View Original
post-image
  • Reward
  • Comment
  • Repost
  • Share
$HEMI LONG
Entry: 0.012076 – 0.012112
Stop Loss: 0.011297
TP: 0.012413 - 0.013290 - 0.013847
HEMI19.85%
post-image
  • Reward
  • Comment
  • Repost
  • Share
#StrategySharesBreak135ForFirstTimeIn12Weeks
Strategy Shares Break $135: Full Breakdown, Analysis and What Comes Next
The Headline, Decoded
"Break $135" is an upside breakout. Strategy Inc (Nasdaq: MSTR), formerly MicroStrategy, closed at $137.39 on August 27, 2026, up 11.6%. That was its first close above $135 since June 2, 2026 ($136.10), a gap of roughly 12 weeks. But the breakout did not hold: on August 28 it opened at $134, touched $135.97, then sold off to close at $127.29, down 7.34%. The market is now testing whether the break was genuine or failed.
The 12-Week Journey and Chart Patte
MSTR-7.40%
post-image
post-image
  • Reward
  • 3
  • Repost
  • Share
Yusfirah:
To The Moon 🌕
View More
This FIRM BROKERS didn’t figure it out🥲 @thefirmbrokers
View Original
post-image
  • Reward
  • Comment
  • Repost
  • Share
#NVIDIAEarnings
🚨 NVIDIA EARNINGS ARE DONE — NOW THE REAL MARKET ANALYSIS BEGINS. 📊🔥 NVIDIA has once again reminded the market why it remains one of the most important companies in the AI and semiconductor story. The latest quarterly results came in stronger than Wall Street expectations, with revenue of about $96.2 billion, adjusted EPS of $2.22, and data-center revenue reaching approximately $89 billion. NVIDIA also projected around $108 billion in revenue for the following quarter, keeping the focus firmly on the strength of AI infrastructure demand.
But for traders, earnings numbers ar
post-image
  • Reward
  • 1
  • Repost
  • Share
ChintuBhai:
lets go
Goal: Turn 100U into 100,000U in 100 days; Day 8: 2,700U.
Control risk and achieve steady returns; short at highs and long at lows.
I didn't know how to read charts or identify entry points during my first two years, and lost tens of thousands of U for nothing.
I re-entered the market in August this year, depositing 100U and turning it into 2,700U in 8 days—a 27x return.
The goal is to challenge myself to turn 100U into 100,000U in 100 days.
Follow me and let's work hard together. In the remaining months of 2026, I will reclaim everything that belongs to me!
Let's work hard together and turn o
View Original
post-image
post-image
ZECUSDT
Long
Isolated 75X
Return %
-3.81%
-0.51 USDT
Entry Price(USDT)
799.32
Mark Price(USDT)
798.89
  • Reward
  • Comment
  • Repost
  • Share
#NVIDIAEarnings
NVIDIA just delivered another quarter that makes one thing very clear: the AI infrastructure cycle is still running at an extraordinary pace.
NVIDIA reported $96.2 billion in revenue for the quarter ended July 26, 2026, up 106% from the same quarter last year and 18% from the previous quarter. Net income reached $59.7 billion, while diluted GAAP EPS came in at $2.46. Gross margin remained at 75%.
But the headline number is not the part I find most interesting.
The real story is Data Center.
NVIDIA generated $89.0 billion from its Data Center business, up 117% year over year an
NVDA-4.00%
post-image
  • Reward
  • 2
  • Repost
  • Share
LittleQueen:
LFG 🔥
View More
$XLM – Bearish continuation on daily profile
XLM SHORT
Entry: 0.17735 – 0.17749
Stop Loss: 0.18097
TP: 0.17600 - 0.17209 - 0.16961
XLM-2.72%
post-image
  • Reward
  • Comment
  • Repost
  • Share
The rugs are back
Memecoins are back
We are so back (bruh)
  • Reward
  • Comment
  • Repost
  • Share
💎 Best Cap Crypto coin to Buy Now
gate liveLIVE
912
live-coin
  • Reward
  • Comment
  • Repost
  • Share
I only wanted to mooch a free breakfast, but the market ended up serving me half a year’s worth of profits. I opened the charts this morning, and with a move like this, I didn’t even need to think—the account was dancing on its own. I spotted it when funds quietly started flowing in earlier and knew this move had more to it than met the eye. Holding from 0.06471 all the way to 0.06499, my position’s return reached +8.52%—a satisfying bite of profit. All those sleepless nights were worth it; everyone onboard should have woken up smiling.

Good opportunities come from waiting, and profits come
SNDK2.47%
ETH-1.72%
View Original
post-image
  • Reward
  • Comment
  • Repost
  • Share
Fed Rate Watch Economic Signals Could Reshape the Next Policy Decision
gate liveLIVE
321
live-coin
  • Reward
  • Comment
  • Repost
  • Share
🧲 $COTI – Poised for a pull‑back retest within a mixed regime
🟢 COTI LONG
🎯 Entry: 0.012924 – 0.012958
🛑 Stop Loss: 0.012627
🎯 TP: 0.013067 - 0.013412 - 0.013632
COTI2.63%
post-image
  • Reward
  • Comment
  • Repost
  • Share
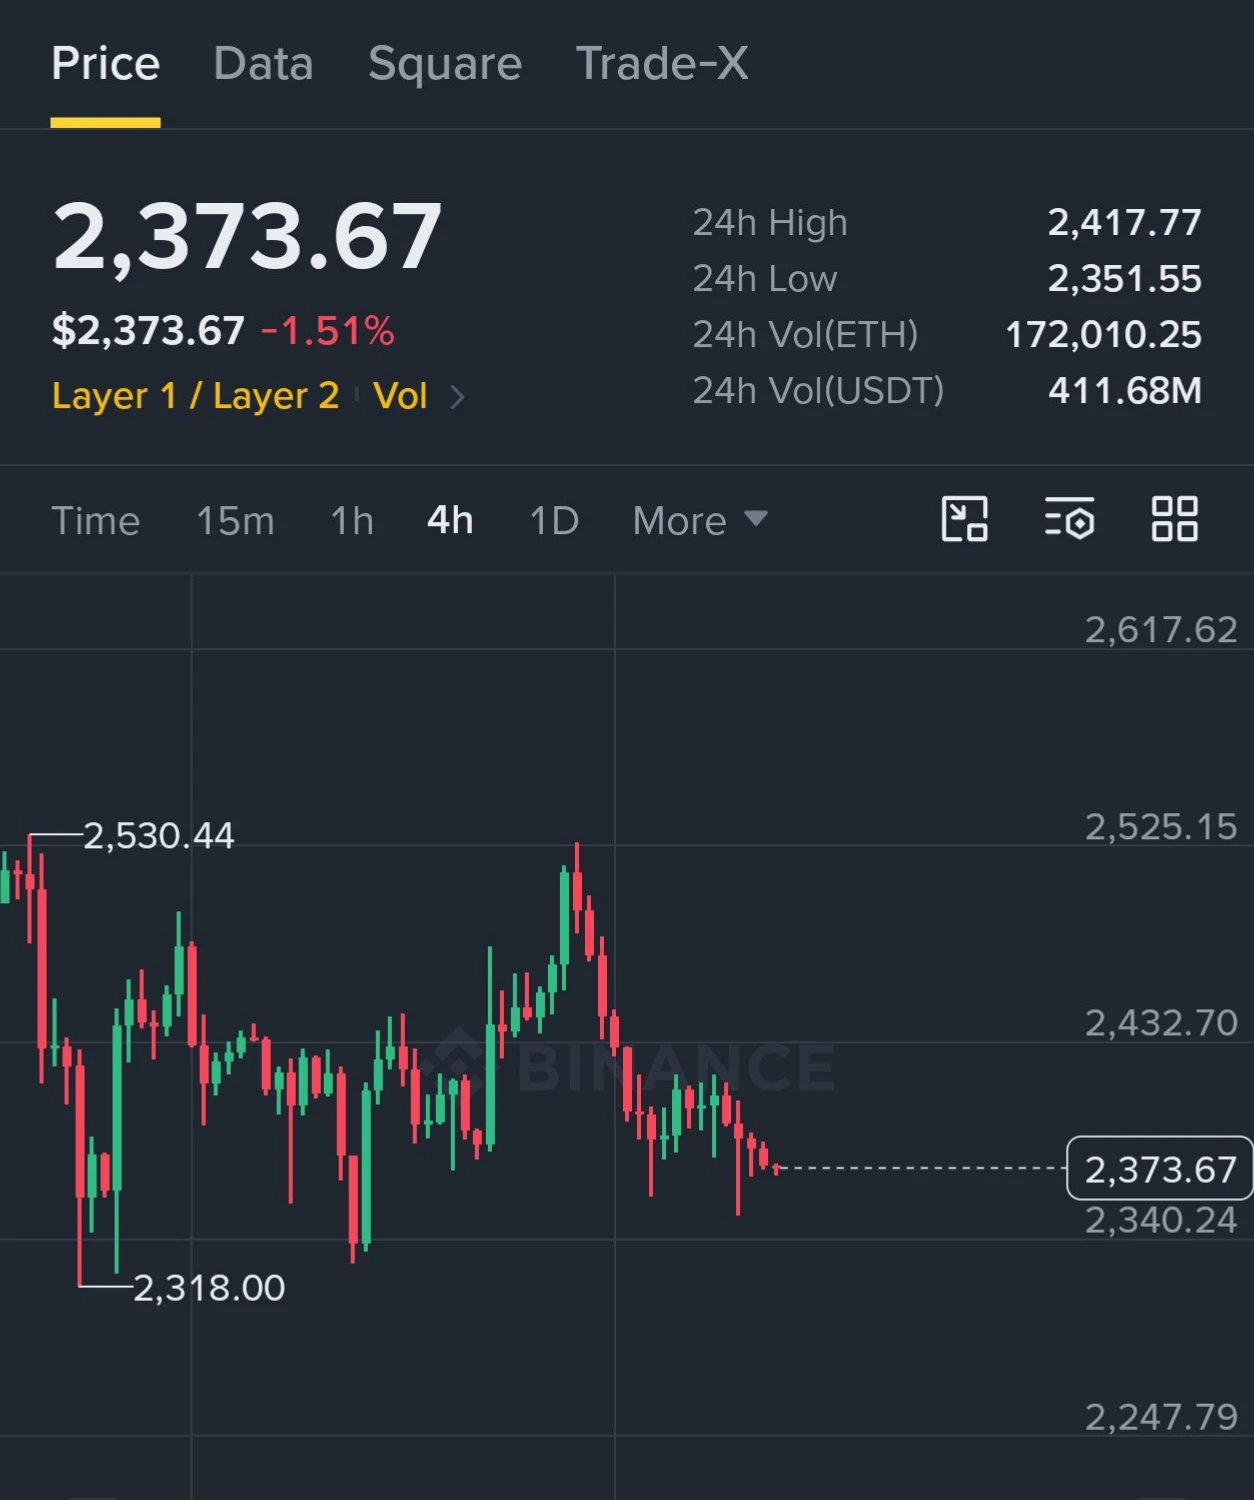
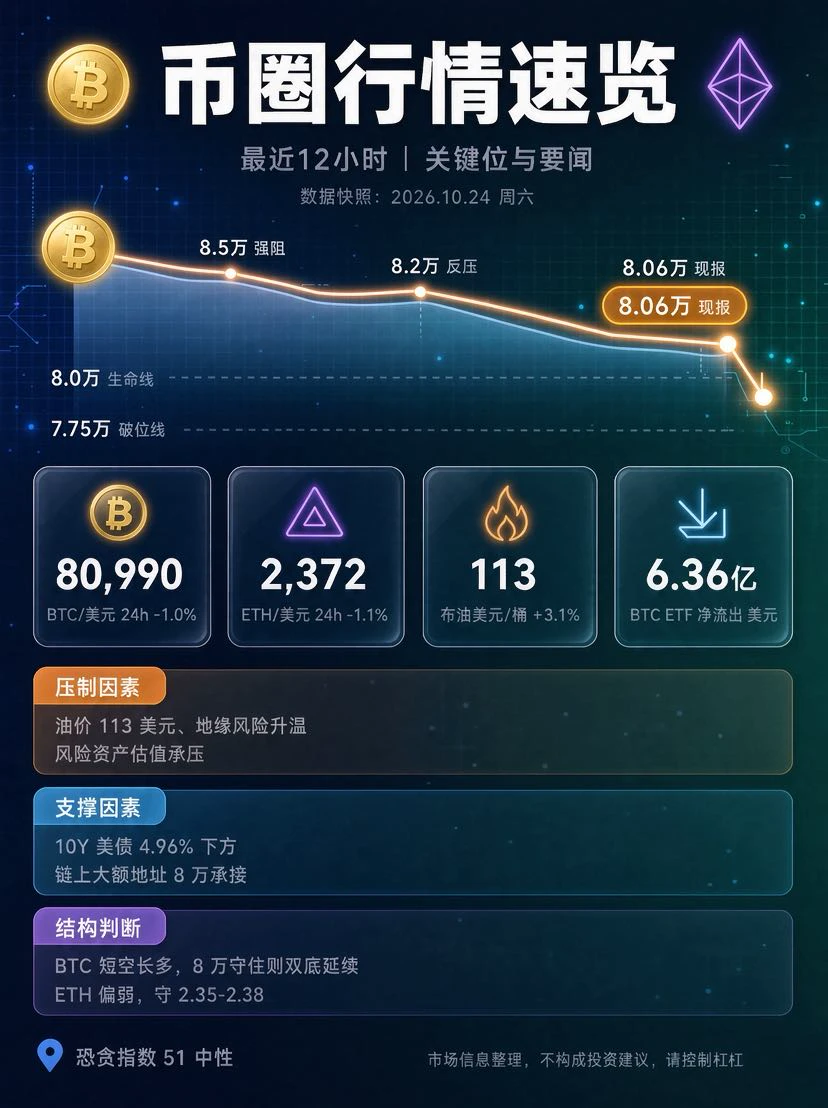
Crypto markets took a sharp hit after Fed Chair Kevin Warsh delivered a hawkish message at Jackson Hole, keeping inflation and the Fed’s 2% target firmly in focus.
bitcoin:native slipped back toward $77.9K, while $ETH and ripple:native also moved lower as traders quickly repriced the outlook for U.S. rates.
The reaction was broad:
• BTC → $77,901, down 3.1%
• ETH → $2,444, down 3.1%
• XRP → $1.39, down 5.0%
• September rate-hike odds → climbed from 30% to 49%
And it wasn't just the macro backdrop. BTC was rejected around the $81.5K area, while reports of heavy whale selling near $81K added ano
BTC-2.39%
ETH-1.69%
XRP-2.17%
post-image
  • Reward
  • Comment
  • Repost
  • Share
#GateStockInsightsChallenge #DRAM
$DRAM ‌ USDT Futures Drop 3.30% to $56.28: Earnings Volatility Creates a Critical Decision Point for Traders.**
The DRAMUSDT perpetual futures contract is currently trading at $56.28, reflecting a significant 3.30% decline over the last session. This price action occurs precisely as the market approaches a major earnings catalyst, creating a high-stakes environment where technical weakness clashes with fundamental anticipation. The current chart structure reveals a decisive breakdown from recent highs near $59.01, with price now testing the lower bounds of
DRAM0.18%
post-image
post-image
  • Reward
  • Comment
  • Repost
  • Share
Load More

Join 40 M users in our growing community

⚡️ Join 40 M users in the crypto craze discussion
💬 Engage with your favorite top creators
👍 See what interests you
  • Pinned