


Square
Following
Hot
News
Profile
Share your thoughts
placeholder
Article
buy good coins, do nothing, hold spot, touch grass, make money season (loading)
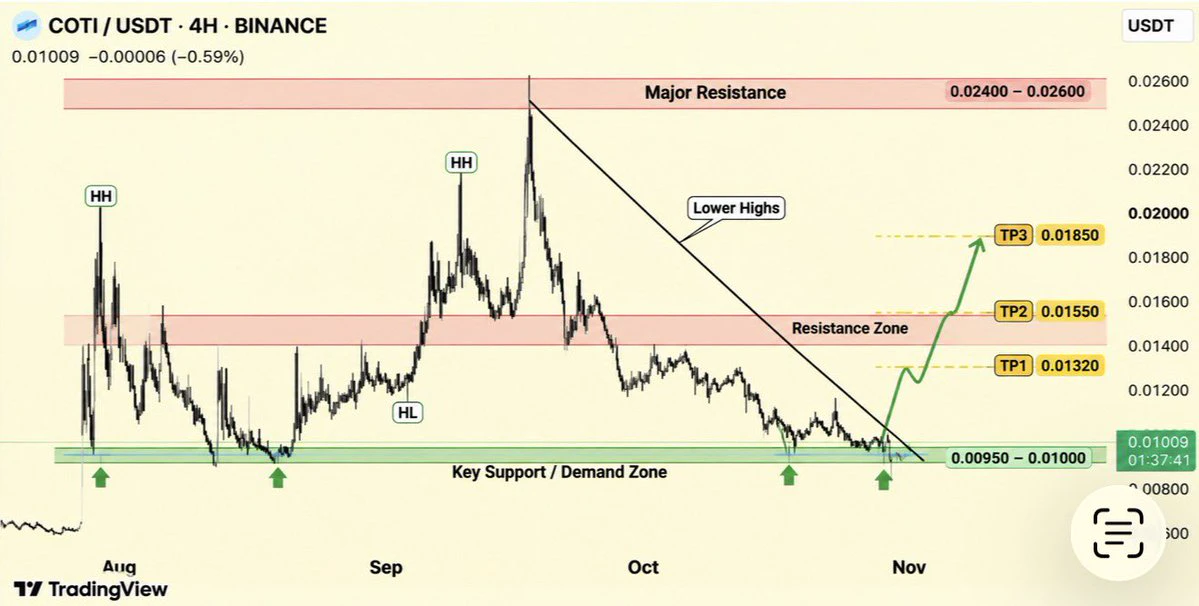
$COTI is sitting at critical support zone!
Price is holding around 0.00950–0.01000 after a prolonged downtrend. If buyers defend this area and momentum returns, we could see a recovery toward 0.01320, 0.01550 and 0.01850.
A breakdown below support would weaken the bullish case.
post-image
COTI-2.75%
  • 3
Trenches
ZIG
Z
bade
b
ZIG
0x8c...1145
Market Cap
$.
Change
.
24h Vol
$.
Holders
.
BTC
B
bade
b
BTC
C5xp...pump
Market Cap
$.
Change
.
24h Vol
$.
Holders
.
HIGH
H
bade
b
HIGH
7ymF...high
Market Cap
$.
Change
.
24h Vol
$.
Holders
.
STONK
S
bade
b
STONK
6GmA...UNgx
Market Cap
$.
Change
.
24h Vol
$.
Holders
.
CORLA
C
bade
b
CORLA
0xba...7777
Market Cap
$.
Change
.
24h Vol
$.
Holders
.
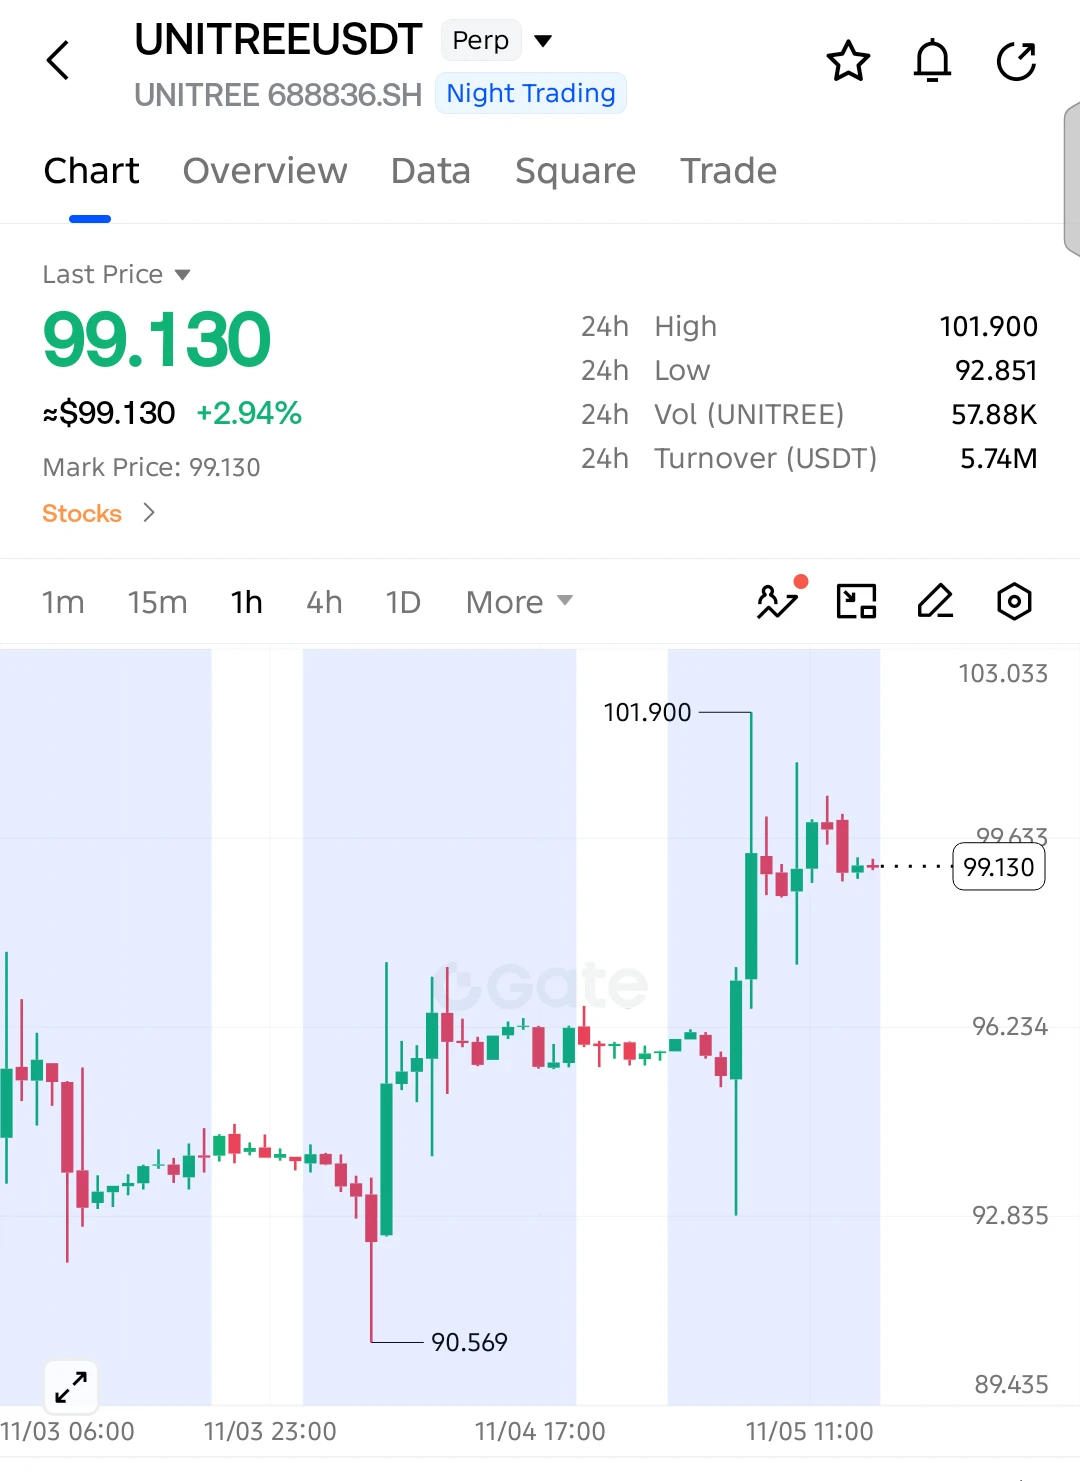
$UNITREE LONG SETUP — BULLS HOLDING STRONG!
$UNITREE is consolidating near 99.13 after a powerful breakout. Buyers are defending the recent gains, keeping another upside move toward 101.90 in play.
Entry: 99.130
SL: 97.850
TP1: 99.900
TP2: 100.800
TP3: 101.900
Final Target: 103.000
Price is holding above its previous consolidation zone around 96.20. If buyers maintain control and push through 99.65, bullish momentum could accelerate toward the recent high.
Invalidation: A sustained break below 97.850 weakens the bullish setup.
post-image
UNITREE+4.35%
  • 3
  • 2
Citadel in October: Tech companies created an AI bubble reminiscent of the dot-com crash.
Citadel in November: “The setup has improved”
Earnings continue to beat while AI infrastructure valuations compressed sharply.
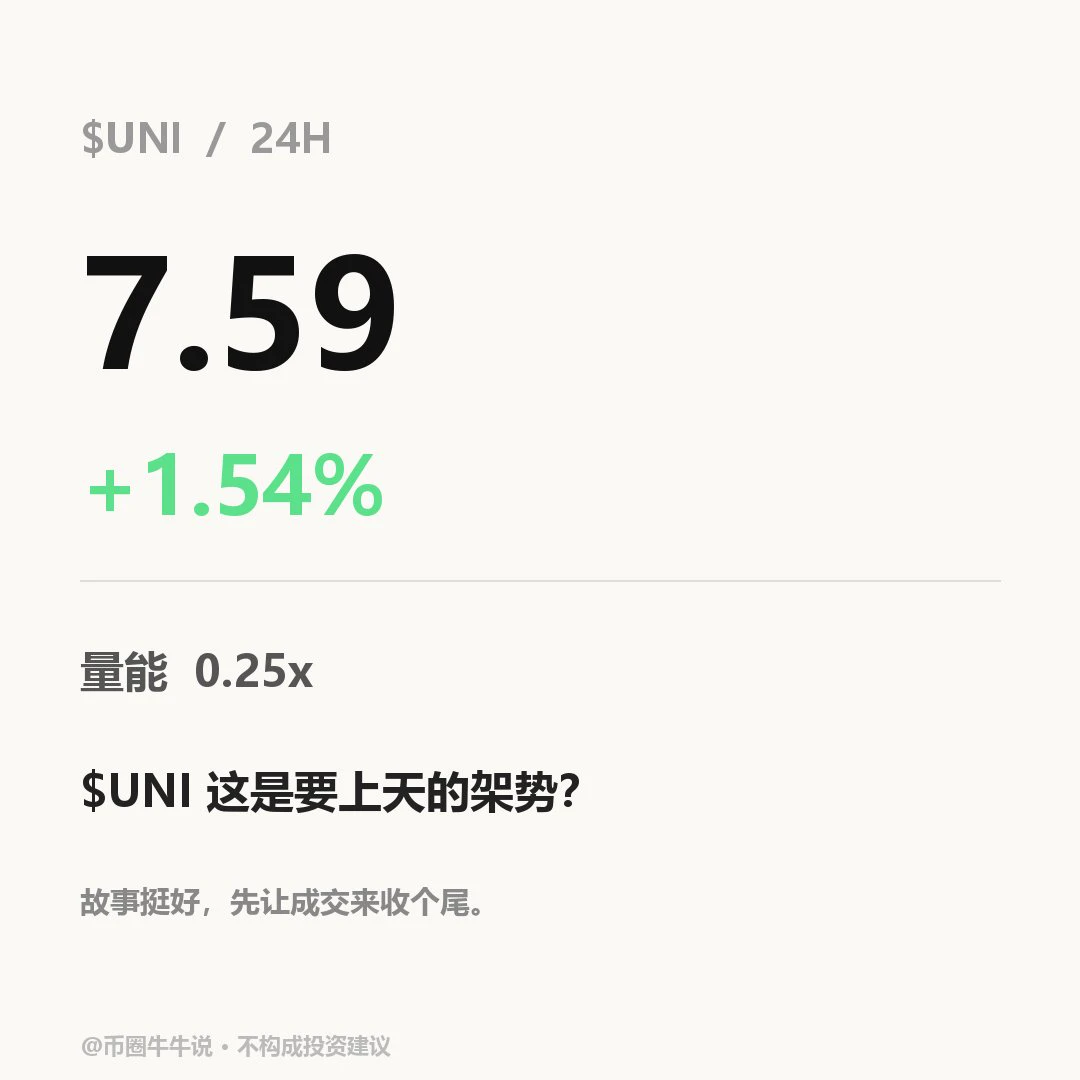
$UNI Currently at 7.592, 24H +1.54% (7.255–7.82). 1H momentum is weak: RSI 52.04, with the current price above the 1H EMA20 at 7.591; 4H momentum is strong: RSI 69.05, with the current price above the 4H EMA20 at 7.389. The 1H volume ratio is 0.253. If the price holds above the 7.82 resistance, watch for continuation; if it breaks below the 7.255 support, the short-term outlook may weaken. In the next review, check whether the price can hold above 7.82 and whether it can reclaim 7.255 if that support breaks. The two timeframes remain divergent; a break below support that cannot be reclaimed wo
post-image
UNI+3.05%
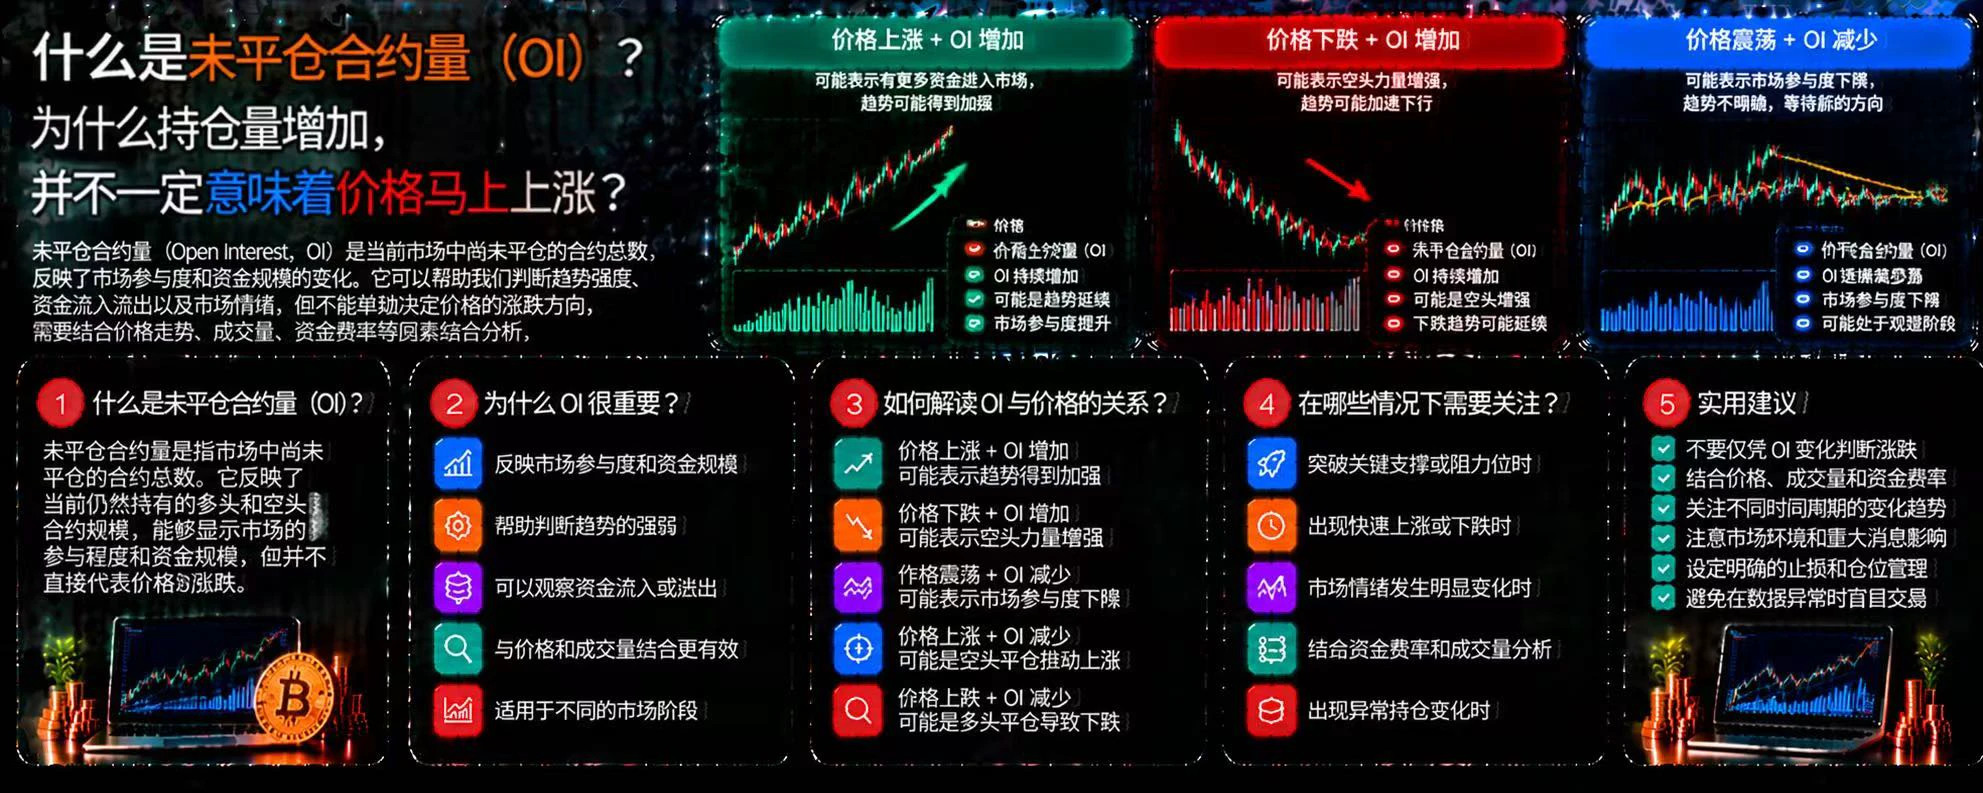
What Is Open Interest (OI)? Why Doesn’t Rising Open Interest Necessarily Mean Prices Will Rise Soon?
In crypto futures trading, many people see open interest continue to rise and assume the market is about to rally. But open interest reflects the size of contracts that have not yet been closed, not simply the amount of buying capital. To correctly understand market movements, OI must be analyzed alongside price, trading volume, and funding rates.
First, what is OI?
Open interest (OI) refers to the total number of contracts that remain open at a given point in time. OI may increase when new con
post-image
CRYPTO MARKET TRENDS
live-cover
LIVE1,427
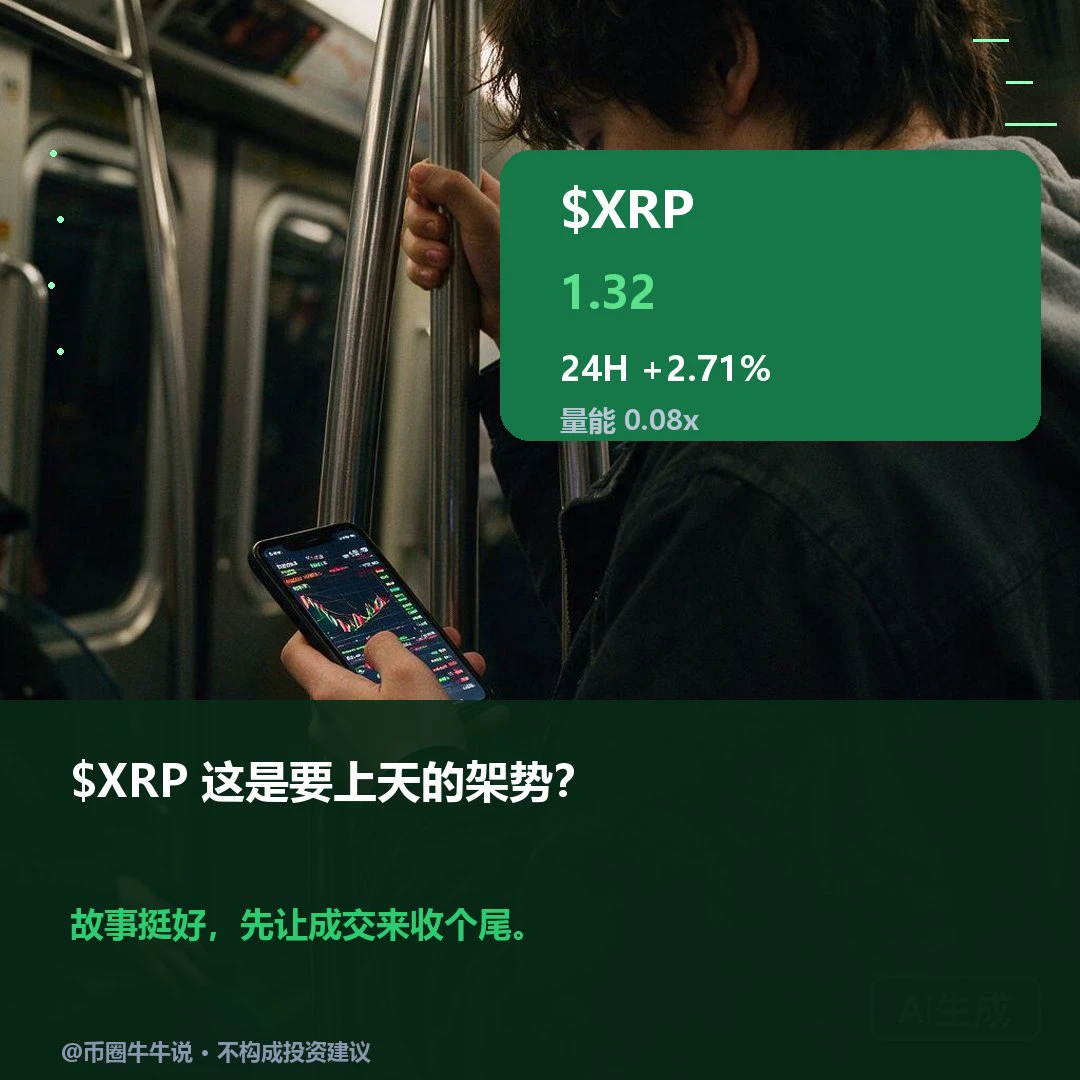
$XRP Currently at 1.319, up 2.71% over 24H (1.2765–1.342). 1H momentum is strong: RSI is 64.49, and the current price is above the 1H EMA20 at 1.3078. 4H momentum is strong: RSI is 73.83, and the current price is above the 4H EMA20 at 1.2857. The 1H volume ratio is 0.079, indicating very low participation. If the price holds above the 1.342 resistance, watch for a continuation; if it breaks below the 1.2765 support, short-term momentum may weaken. In the follow-up review, check whether it can hold above 1.342 and whether it can reclaim 1.2765 after losing that level. Volume is only 0.08 times
post-image
XRP-1.15%
What can happen if BTC market braks 82000
live-cover
LIVE2,290
11.5
Bitcoin has been moving sideways all day
On the 4-hour timeframe, price has been pressured downward, so there’s still a risk of a pullback
Since it’s consolidating like this, we don’t need to watch the charts constantly
Trading is just one part of life. The money we make from trading should enrich our lives. Life’s journey is all about cultivating the mind—working on what we can and cultivating our inner selves. Keep it up!$BTC $ETH #BTC重返8万
FyPaymentMadeEasy
11.5
BTC has risen nearly 6,000 this round. I imagine quite a few people got caught in losing positions. I’ve been calling for longs at 76,500 for days—do you still want to short?
Being stuck in a losing position isn’t scary; what’s scary is not knowing how high it could go. It’s been moving sideways around 80k without breaking below it. Honestly, the bulls are pretty strong this time. If you’re not too deep in the hole, let’s fight back!!!$BTC $ETH #BTC重返8万

repost-content-media
BTC-0.65%
ETH-1.23%
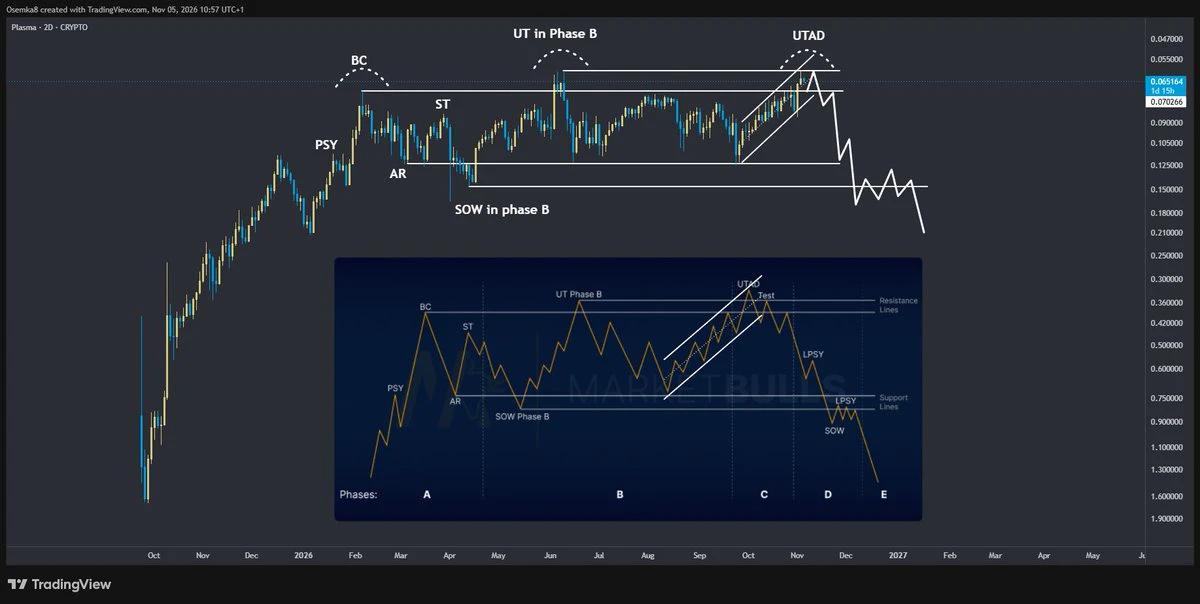
Someone asked me why I'm focusing on $XPL cause there are better opportunities elsewhere and I honestly had to check the chart again if I'm perhaps a moron.
But you can't get a better R:R than this. You just can't. I'm inversing the chart cause everyone has a bearish brain atm to show you that you cannot find a more textbook distributive range than this (e.g. accumulation on the regular scale).
Look at all the phases. Look at the corrective leg up to UTAD. This is a pretty easy 100-150% to reach range lows IMHO.
post-image
XPL-0.60%
Apple Intelligence has now arrived in mainland China
The three-year wait came to an end in late autumn
You can now use features like real-time translation on AirPods and Apple Intelligence
From zero to Apple Intelligence, it took us Chinese people just 3 years
Things are getting more open; looking forward to even better things
post-image
$SNXX A 21.7% plunge in 24 hours, nearly cut in half; it's now at $5.16. It fell straight from $6.69 to $4.93 intraday, with $467 million in trading volume—this isn't a pullback; capital is rushing for the exits.
First, let's read the chart: a high-volume drop with no rebound structure. $4.93 is the only short-term support, and the $5 round-number level has turned into resistance. The 24-hour range is over 35%, typical of a liquidity-driven selloff, not a shakeout—a shakeout wouldn't come with $467 million in selling volume. On-chain data shows no sign of support wallets stepping in to absorb
SNXX-0.43%
  • 7
  • 1
I just found out my partner cheated on me, and I'm panicking!
🙈
@Plasma @0xBenniee
post-image
This is gold's weekly chart.
We can see that gold has experienced drops close to 50% before.
If the exact same price action repeats, then from 4600 we definitely have to make it to the 3100 range! $XAUUSD
XAUUSD+1.65%
#美股财报季 #Gate股票畅聊季 $13.4 billion in revenue sets a record: Three truths about AMD’s AI computing race
After the market closed on November 3, 2026, AMD delivered an almost flawless quarterly report: revenue of $13.38B, up 45% year over year and above the top end of its guidance; data center revenue nearly doubled, and the stock briefly surged 9% after hours.
The numbers are impressive, but more worth unpacking are three things behind them: AMD is undergoing a structural transformation, earnings quality is improving, and its 2027 outlook makes the company’s ultimate destination crystal clear.
01
AMD+0.88%
Damn, starting at spawn with cheats enabled.
post-image
Featured[Short to long? Use two charts to objectively identify the trend turning point]
BTC
Chart 1. Daily timeframe. Since August, 813 (±100 points) has been a clear support/resistance flip level.
Chart 2. 4-hour timeframe. Since the move down from 87, rebound highs have kept getting lower. The previous high was 82.
Based on these two objective factors, the conclusion is that a daily close below 813 is bearish. As long as the 4-hour high stays below 82, the downtrend is still continuing.
So the trading advice is simple: factor in liquidity. Short after a sweep above 82 and a move back below. A stop-l
HeyElwin
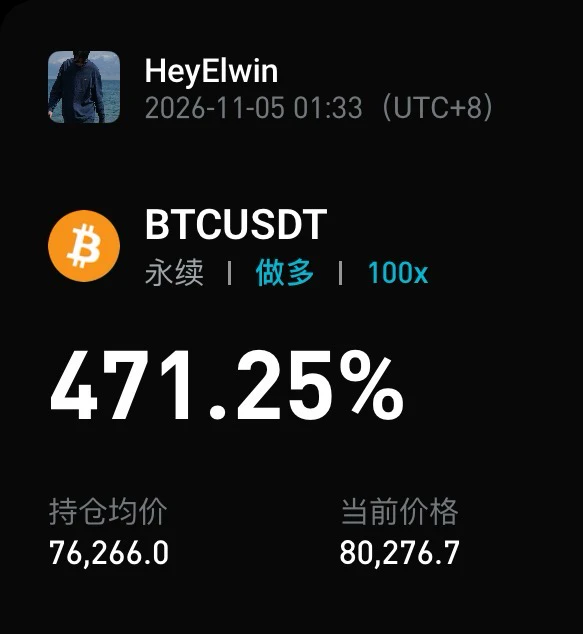
First, congratulations to everyone who followed along and went long. The long position on the break below 762 and reclaim. No matter how you scaled out for profit, overall you should have made 2,000+ points in profit~ Nice!
Honestly, I didn’t expect this rally to be so swift. To be honest, I had a few short orders placed on the left side at 794, and they got stopped out instantly. Then I was left with only a mini core position in longs.
So what’s the outlook now?
As shown by the futures data in Figure 1, the rise was driven more by shorts closing than by longs entering. And after longs entered, the rally didn’t continue.$BTC
My personal view remains bearish. This rally has already gained 4,000 points. At the current levels, longs are taking profits. If you want to chase longs, wait until tomorrow’s daily candle closes above 812 before considering it. Likewise, if it closes above 812, I recommend closing any short positions first~
For shorts, be patient and wait for the price to fall back to 794 before entering~
repost-content-media
BTC-0.65%
  • 6
  • 2
Grant Thornton Switzerland attested the Cardano Foundation's 2025 financial statements on Cardano, with the sign-off recorded on the public ledger.
Its global network has $8.5B in yearly revenue and ~80,000 people.
@Cardano
ADA-1.48%
Load More

Join 40 M users in our growing community

⚡️ Join 40 M users in the crypto craze discussion

💬 Engage with your favorite top creators

👍 See what interests you

Trending Topics

GateLaunchesPoSECProofOfSecurity

930 Views468 Discussing

Beyond Proof of Reserves, Gate has introduced PoSEC, a new Proof of Security framework focused on how user assets are stored and protected. By disclosing the distribution of assets across cold storage and hot wallets, users can directly understand Gate’s storage structure and risk coverage under extreme scenarios. Gate’s latest cold storage coverage ratio stands at 104.58%, meaning cold-storage assets alone are sufficient to cover all user assets. PoR verifies whether reserves are sufficient, while PoSEC shows how assets are stored and how risks are covered — together forming a more complete asset security framework. Share your results and experience! [👉 Learn more](https://gate.com/proof-of-security)

BTCBackAbove80K

58.53k Views41.32k Discussing

DemocratsWinBothChambers

21.04k Views467 Discussing

View More