




Square
Following
Hot
News
Notifications
Profile
Share your thoughts
placeholder
Article
$AIN A perfect, extremely reliable signal—as I warned all of you long ago. 👇
post-image
AIN+3.85%
2026.11.6 BTC/ETH/XAU/SNDK Analysis
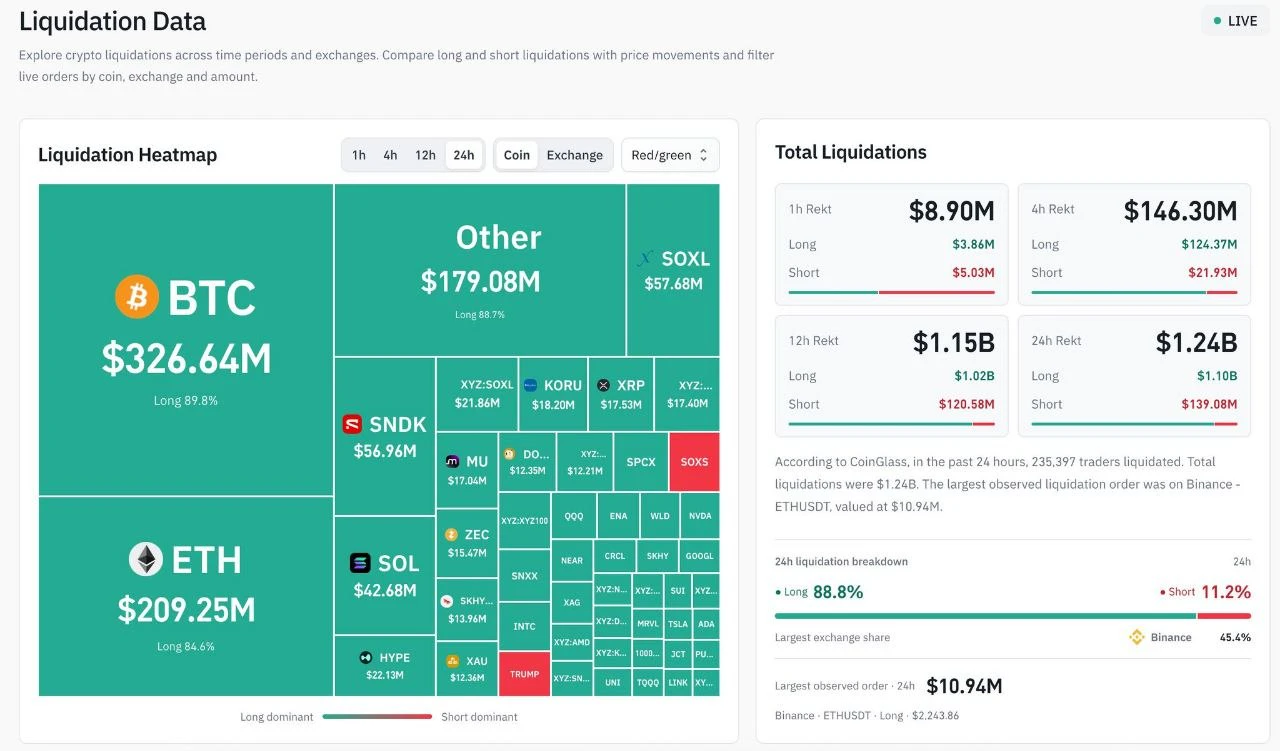
The market took another beating overnight, wiping out $1.25 billion and liquidating 235,346 traders; hope you weren't among them!
For bulls, in this recent market, even playing it safe makes it impossible not to lose money. In my view, losses capped at 30% in this downturn are barely acceptable. If your losses exceed 30%, rethink whether your position sizing is reasonable. As for those who got liquidated, there's not much more to say—they had no trading discipline and became pure liquidity for the market!
BTC
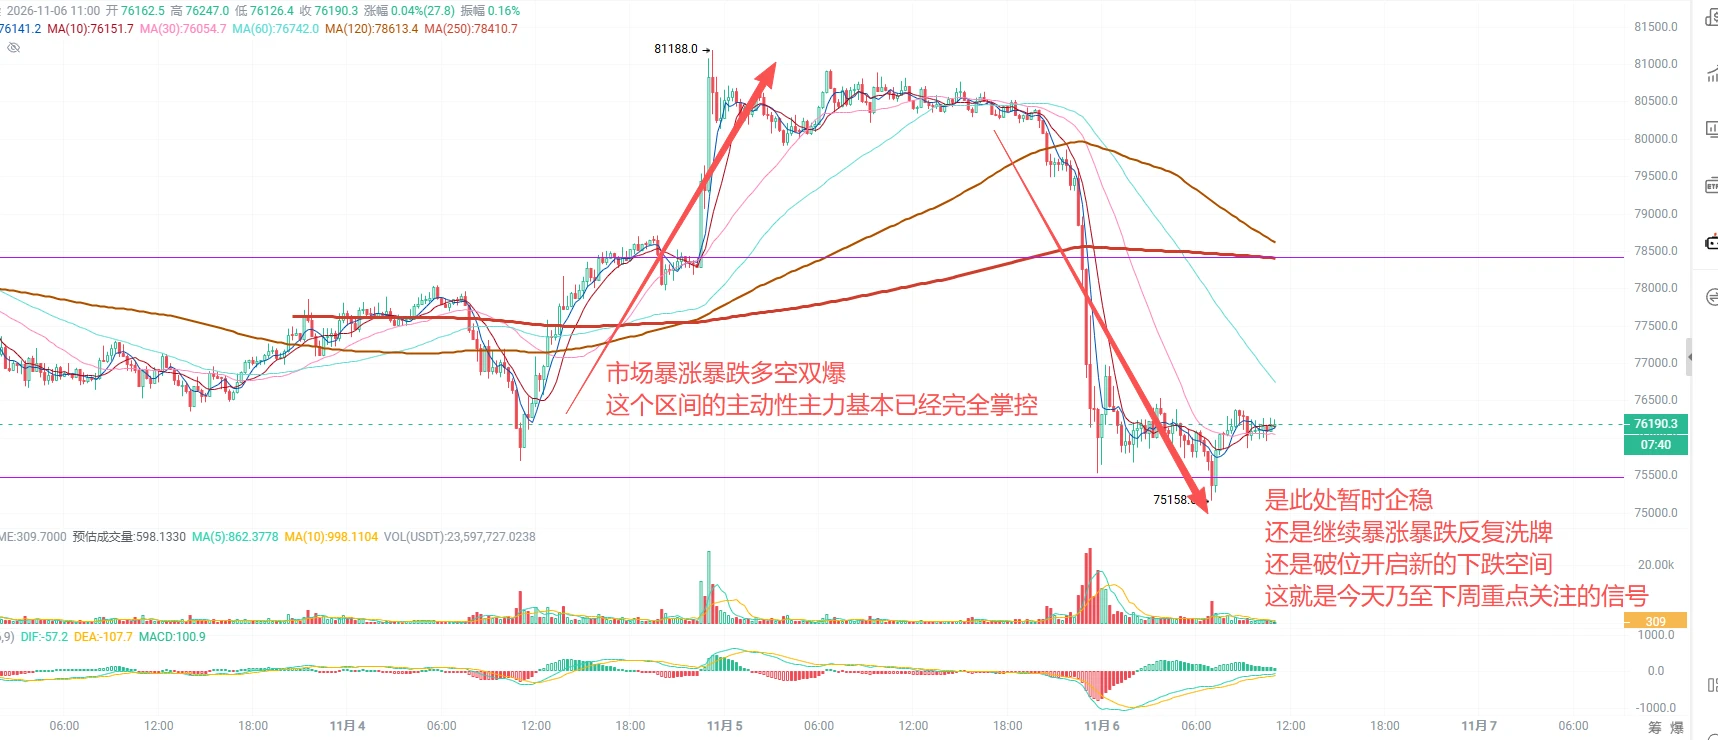
Market sentiment is completely in control right n
post-image
ETH-1.26%
XAU+0.38%
SNDK-22.24%
BTC-0.67%
  • 10
  • 2
Trenches
fxUSD
f
bade
b
fxUSD
0x08...d8f6
Market Cap
$.
Change
.
24h Vol
$.
Holders
.
ZIG
Z
bade
b
ZIG
0x8c...1145
Market Cap
$.
Change
.
24h Vol
$.
Holders
.
BTC
B
bade
b
BTC
C5xp...pump
Market Cap
$.
Change
.
24h Vol
$.
Holders
.
CORLA
C
bade
b
CORLA
0xba...7777
Market Cap
$.
Change
.
24h Vol
$.
Holders
.
STONK
S
bade
b
STONK
6GmA...UNgx
Market Cap
$.
Change
.
24h Vol
$.
Holders
.
Over the past 24 hours, 235,397 traders were liquidated for a total of $1.24B!
post-image
🔐 Blacklists, whitelists, transfer pauses, and transaction limits: What exactly is the difference?

In the previous two articles, we discussed why digital assets may be restricted, and how to investigate using blockchain explorers, transaction records, contract source code, and permission settings.

Today, we’ll take a closer look.

Suppose you open a token contract and find features such as address management, transfer pausing, or transaction limits. What do these features actually mean? How might they affect ordinary users? And how should we assess their actual risks?

First, it is importan
post-image
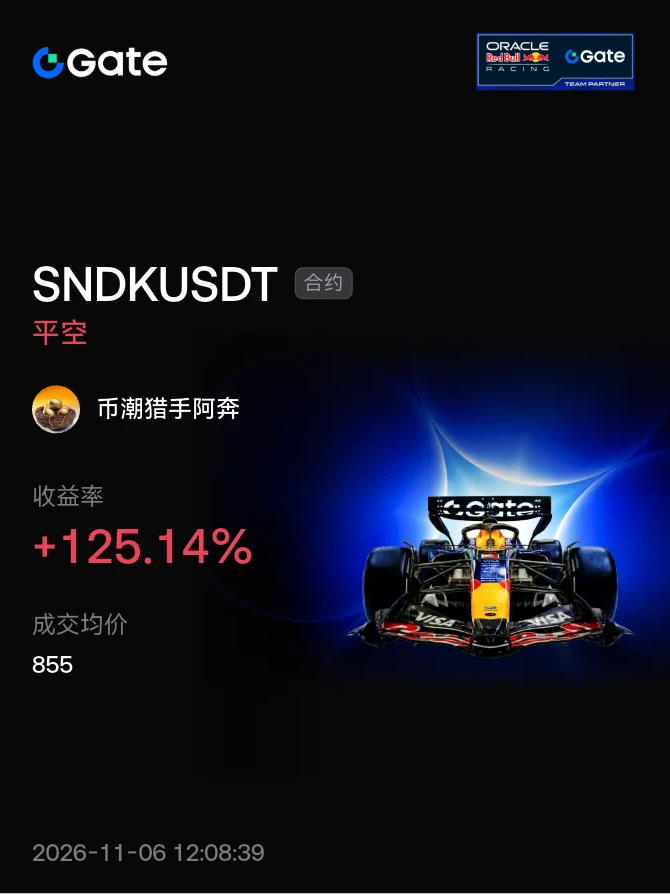
#晒出我的合约收益 Took a small profit on the short, went long on the pullback, watching to see if 885 can break; otherwise, it'll keep chopping back and forth
post-image
🚀 Gate Live November New Streamer Welcome Rewards Are Now Live!

🎁 Upgraded rewards for new streamers—multiple prizes await!
🔹 Earn up to 100 USDT in cash for quality livestreams
🔹 Invite a friend to join, and you’ll each get 10 USDT
🔹 Meet the streaming requirements to claim VIP5 trial benefits
🔹 Fan giveaways + red packet rain support

📈 Growth support is also available—start streaming earlier for more opportunities!
⏰ Event period: November 1 – November 30
🔗 Start streaming now: https://www.gate.com/live
🔗 Event details: https://www.gate.com/announcements/article/102538
‍#GateLive
GateLiveChinese
🚀 Gate Live November New Streamer Welcome Rewards Are Now Live!

🎁 Upgraded rewards for new streamers—multiple prizes await!
🔹 Earn up to 100 USDT in cash for quality livestreams
🔹 Invite a friend to join, and you’ll each get 10 USDT
🔹 Meet the streaming requirements to claim VIP5 trial benefits
🔹 Fan giveaways + red packet rain support

📈 Growth support is also available—start streaming earlier for more opportunities!
⏰ Event period: November 1 – November 30
🔗 Start streaming now: https://www.gate.com/live
🔗 Event details: https://www.gate.com/announcements/article/102538
‍#GateLive #新人开播 #Streamer Recruitment
repost-content-media
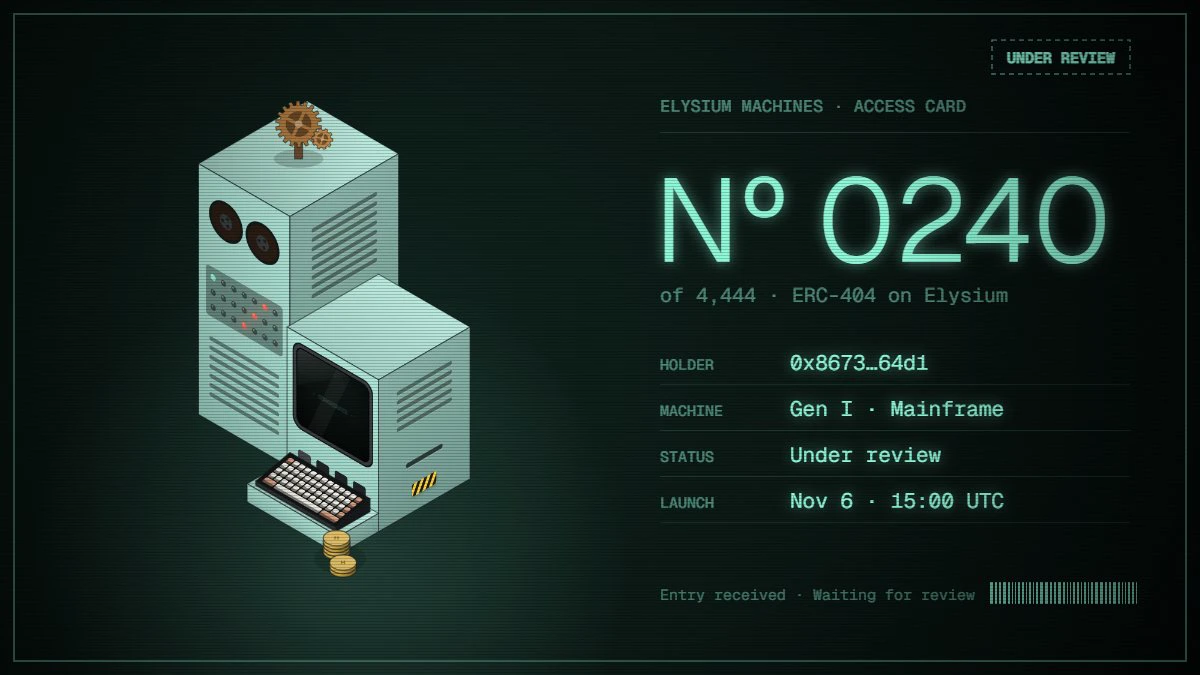
4,444 machines have been waiting in the dark for Elysium. On Friday, Nov 6 · 15:00 UTC they wake up.
Machine Nº 0240 is the one I am waiting for.
@elysium_machine
post-image
No, this means another big drop is still coming.
post-image
🔍 Real-World Case Analysis: How Can We Assess the Actual Impact of On-Chain Restriction Mechanisms on Users?

In the past few articles, we have discussed why digital assets may be restricted, learned how to verify contract information using blockchain explorers, and examined common mechanisms such as blacklists, whitelists, paused transfers, transaction limits, and upgradeable contracts.

But understanding technical terms does not mean truly understanding the risks.

The truly important questions are:

When these mechanisms appear in real smart contracts, what exactly do they mean for users?
post-image
$WLD firmly absorbed all the sell-off tokens at 0.58, completely wiping out the selling pressure.

The bulls aren’t giving an inch, making their stance clear—they’re determined to force a breakout upward.
By contrast, $SUI is hunkered down below the 0.93 resistance, afraid to move, and has already lost some momentum.
Every bullish candle that rallies is a trap the bears have laid for retail traders chasing shorts.
Even $DOGE knows to gradually build a higher base around 0.074.

In a market where existing funds are battling one another, the order book makes it crystal clear who’s really hold
post-image
SUI-1.05%
U.S. Stocks Plunge After the Midterm Elections,
live-cover
LIVE1,502
Compute is no longer a moat; politics is starting to put the brakes on AI.

Democrats’ AI regulations have moved from slogans to rules: energy use, compute procurement, and model audits are all being tightened. Microsoft giving up its right to expand capacity, put simply, means handing the spending risk over to policy. It would rather build less than bet wrong.

IPO valuation logic is changing too: from “discounting future compute” back to “pricing current cash flow.” As the bubble deflates, companies with customers and gross margins will be seen again.

The deciding factor in the next round o
post-image
MSFT-3.65%
  • 3
Do you remember when you joined X? I do! #MyXAnniversary
post-image
🔹Why Did U.S. Stocks Suddenly Plunge at the Open? Sell Orders Flood In While Buyers Struggle to Kee
live-cover
LIVE2,776
Where Should You Set Your Stop-Loss? Find a Reasonable Level Step by Step—from Market Structure and Volatility to Position Risk

In the previous article, we discussed a question that confuses many traders: Why can the actual execution price still be worse than expected after a stop-loss is triggered?

But there is an even more fundamental question:

Where exactly should you set your stop-loss?

Some people habitually exit after a fixed 1% loss, some like to place their stop-loss below the most recent low, and others worry about getting stopped out by the market, so they keep widening the stop-
post-image
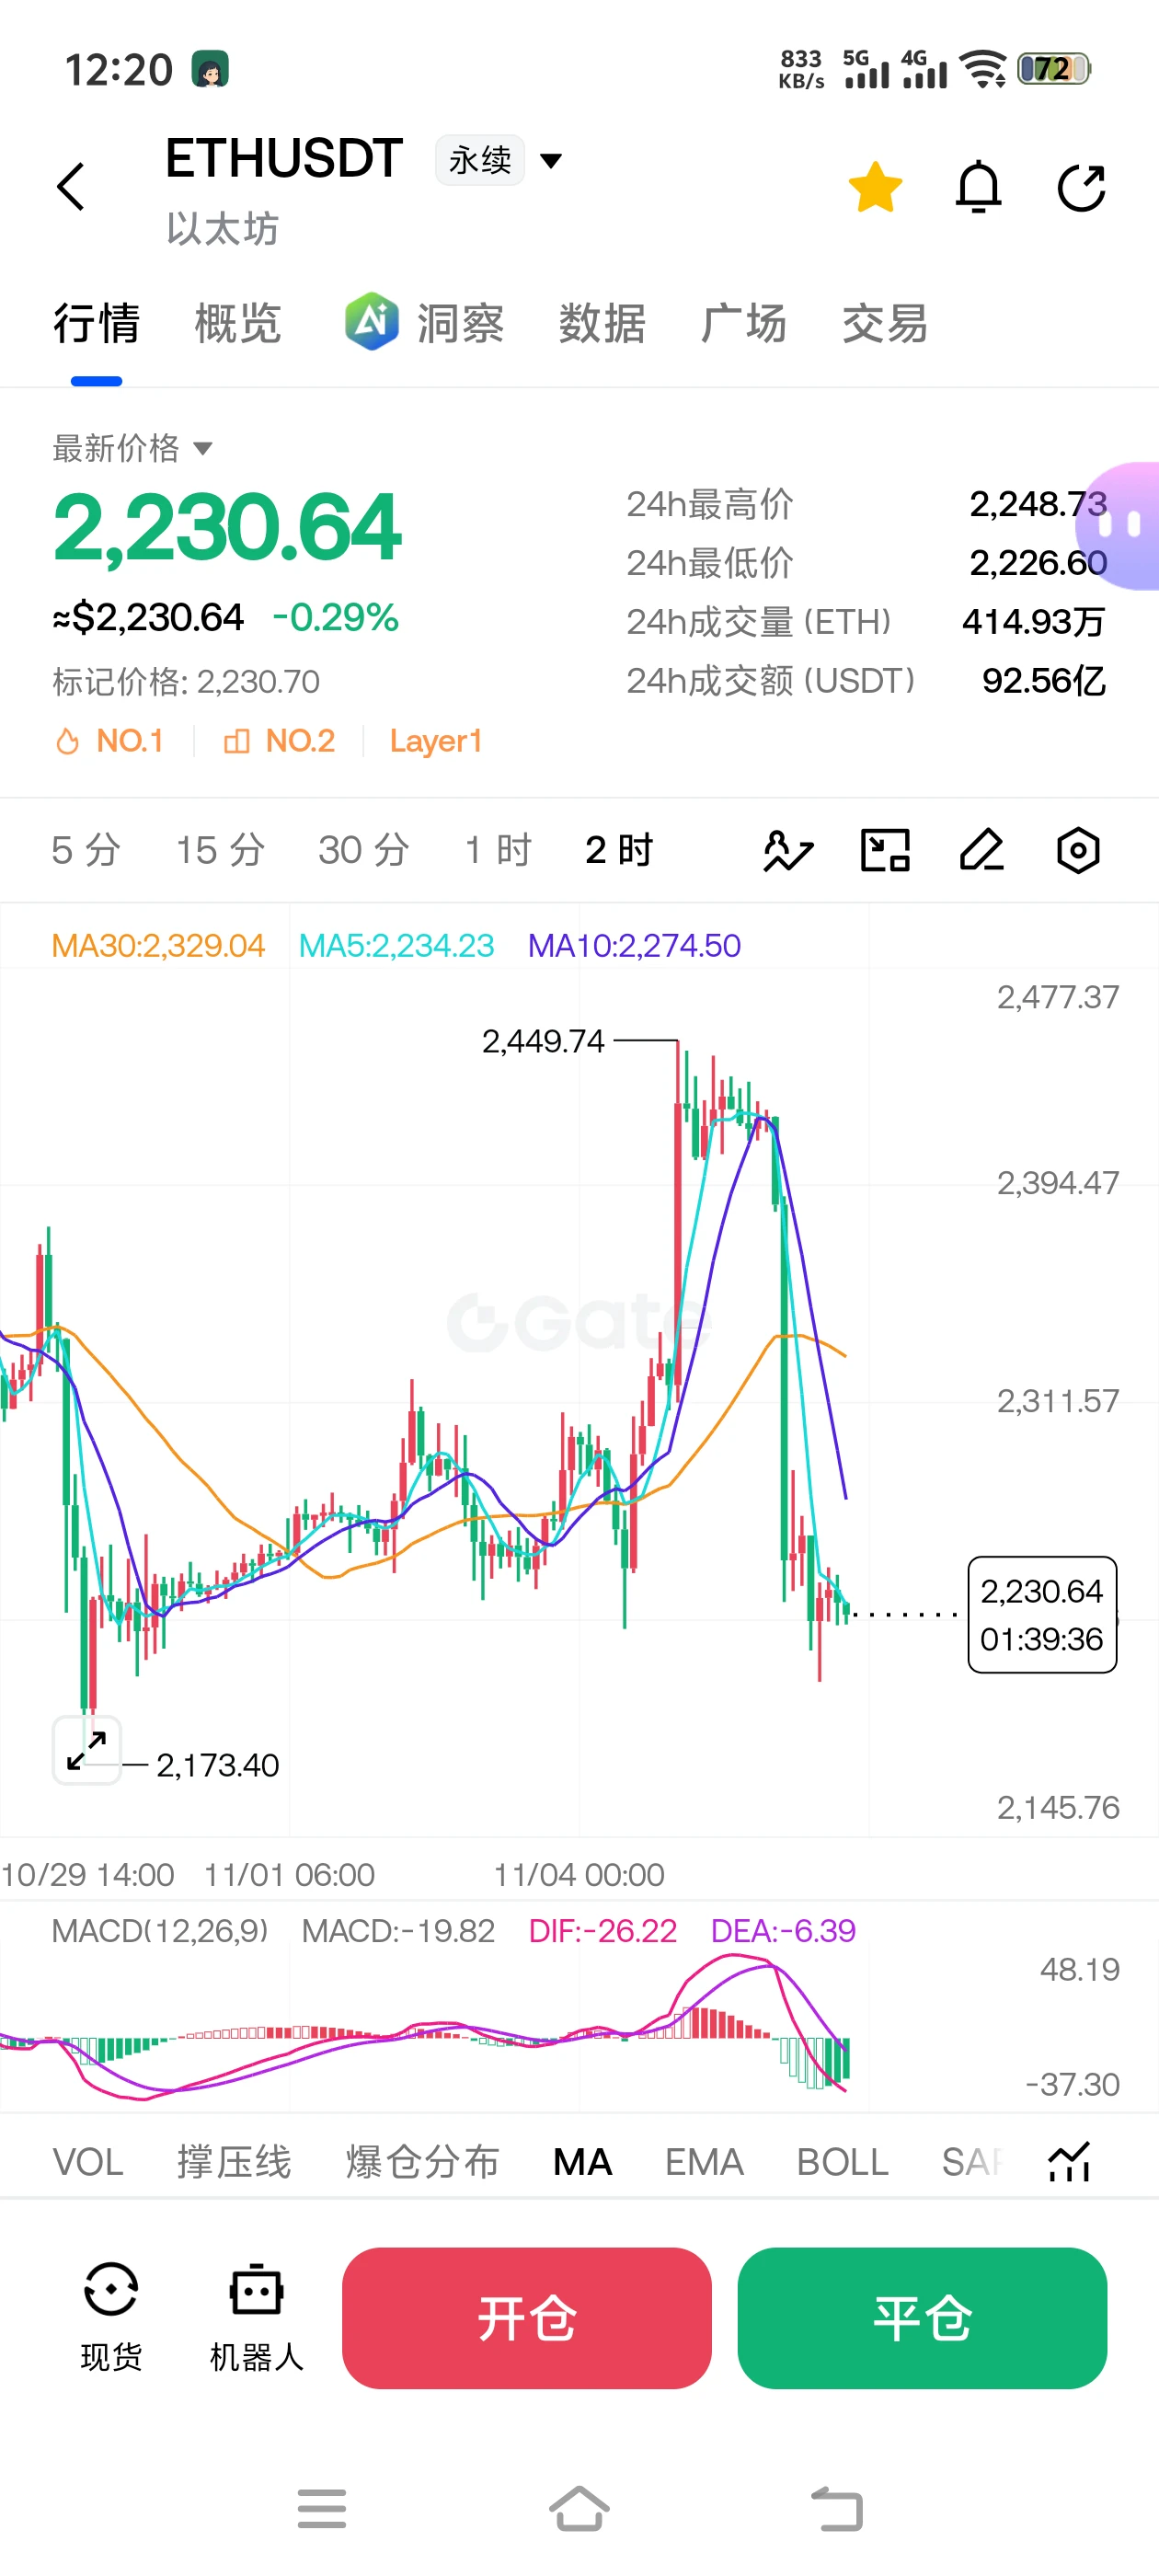
At the current level, there’s still no sign that a move higher is likely if you go long; the market remains bearish, and the short entry isn’t ideal either, so it’s better to wait and see. If you really want to trade, you might as well stay short, as it’s unlikely to make another direct V-shaped move higher. If the price rises to around 2260-2270 and clearly meets resistance, you could open another small short position. On the daily chart, some further consolidation and even a new low would be perfectly normal. It has also returned to a downtrend channel on the daily chart, and a large engulfi
post-image
🌈 Gate Live Streaming Inspiration - Nov.6

Today's Topic Recommendations:
🔹U.S. Stocks Plunge After the Midterm Elections, Led by AI Stocks, Dragging BTC Down Too! When Will This Sell-Off Finally Hit Bottom?
🔹Did Hedge Fund Liquidations Trigger the U.S. Stock Market Crash? Several Funds Are Suspected of Forced Selling. Is the Chain Reaction of Sell-Offs Finally Over?
🔹South Korea's KOSPI Plunges 8%, Triggering a Trading Halt! Losses Narrow After Trading Resumes. Are Dip Buyers Stepping In, or Is This Just a Temporary Breather?
🔹Japanese Stocks Tumble Nearly 7% as SoftBank Crashes 14%! Are
post-image
BTC-0.65%
NDAQ-2.63%
  • 7
  • 6
First, I'll get fresh data on #PEPE, because the previous report is based on data roughly a day old.

**Short summary:** For the next few days, the base case for PEPE is sideways trading in a range of approximately **$0.00000463–$0.00000509**. A breakout above the upper boundary with a daily close would open the way to $0.00000531, while a close below $0.00000463 would bring the price back to $0.00000451 and lower. This is a technical forecast based on current levels, not a guarantee of price movement.

**Current data** (Gate spot market, daily candle, data as of around 03:00 UTC on 2026-11-0
PEPE+0.97%
When BTC Shows Bearish Divergence, Does It Mean a Drop Is Coming?

In BTC technical analysis, bearish divergence is often seen as an early warning that an uptrend may be weakening. But many traders rush to short as soon as they spot bearish divergence, only to see the price keep rising instead of falling and ultimately get caught on the wrong side of the move.

So how should you interpret bearish divergence?

First, understand the basic principle. When the BTC price keeps making new highs, but the highs on the RSI or MACD indicators gradually decline, bearish divergence may be forming. This me
post-image
BTC-0.67%
Load More

Join 40 M users in our growing community

⚡️ Join 40 M users in the crypto craze discussion

💬 Engage with your favorite top creators

👍 See what interests you

Trending Topics

USStocksFaceHistoricSelloff

987 Views3.48k Discussing

U.S. stocks suffered a sharp selloff on Thursday, with the Nasdaq closing down more than 5% and the Philadelphia Semiconductor Index falling over 12%. AI and chip stocks including $NVDA and $AMD were hit especially hard. Markets are reassessing AI valuations, data-center spending and future returns. Is this just short-term deleveraging, or the start of a deeper correction in the AI trade? Which sectors are you watching next?

GateLaunchesPoSECProofOfSecurity

12.01k Views568 Discussing

USNonfarmPayrolls

9.34k Views3.99k Discussing

View More