Square
Following
Hot
News
Profile
Share your thoughts
placeholder
Article
$3ULL BULLISH ON 3ULL and bigger Listing in October mid.⏰🔛🚀 ‌
post-image
3ULL+1.80%
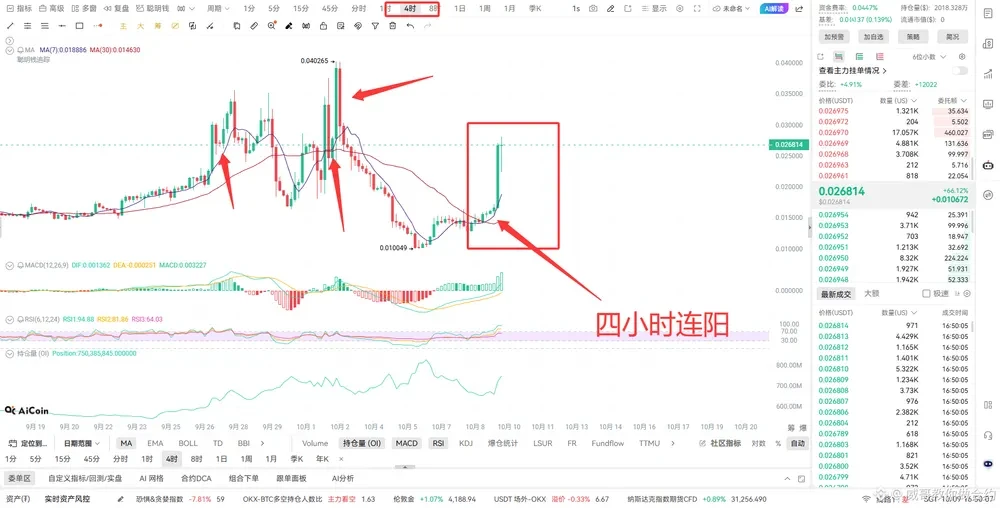
$US After looking at the four-hour chart, I noticed that the four-hour candles have basically been bullish for the past two days. Looking at the previous candlesticks, it can also be seen that this market maker’s operations are not particularly extreme: most of the time, a long bullish candle is closely followed by a bearish candle, let alone a long bullish candle after such a consecutive bullish run. Therefore, Wei Ge recommends decisively entering a short position around 0.027 now, with a target near 0.02.
post-image
US+85.50%
When you vagueposted this week’s top runner, which is now quantum-resistant, but nobody knows what you were talking about so you get zero clout for it.
(At least my entry is better than everyone else’s, so it’s fine.)
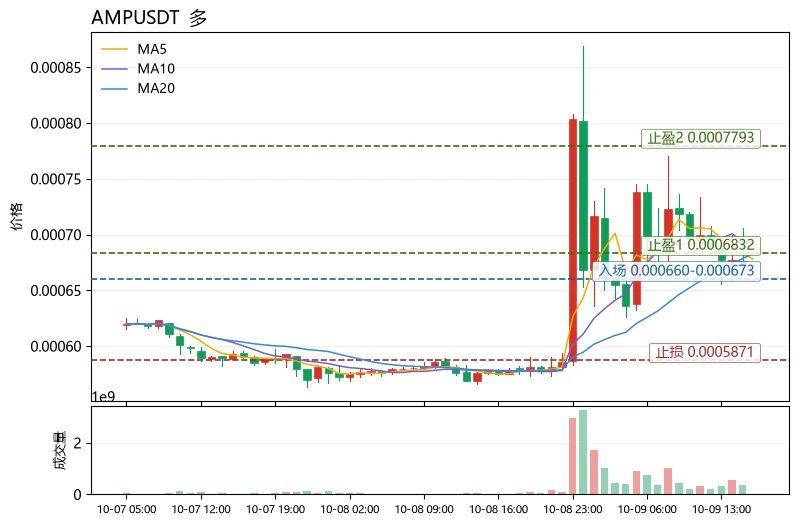
$AMP Current price: 0.000673. The first resistance above is at 0.0006832 (MA20), while support below is at 0.0005871 (lower Bollinger Band). It surged 16.64% over 24 hours, but the price remains below MA20, and MA5 is also slightly below MA20. The moving averages are in the early stages of repairing a bearish alignment, which is the most fundamental difference between it and the other coins showing unusual moves in the same group.
Compared horizontally with $APT and $ATOM over the same period: both have MA5 above MA20, with RSI as high as 71.4 and 75.8 respectively, and both MACD histograms
post-image
AMP+15.74%
APT+5.49%
ATOM+9.29%
#CEX与DEX资金费率集体转空 When CEX and DEX funding rates collectively turn negative, it means that a short-dominated pattern has formed in the derivatives market. Negative funding rates indicate that shorts need to pay fees to longs, reflecting contract prices below spot prices and strong overall bearish sentiment. However, if the sentiment index is in the “Greed” zone at this time, this divergence often reveals a disconnect between market sentiment and capital behavior.
As a contrarian sentiment indicator, persistently negative funding rates show that traders are more inclined to short in the futures
post-image
  • 2
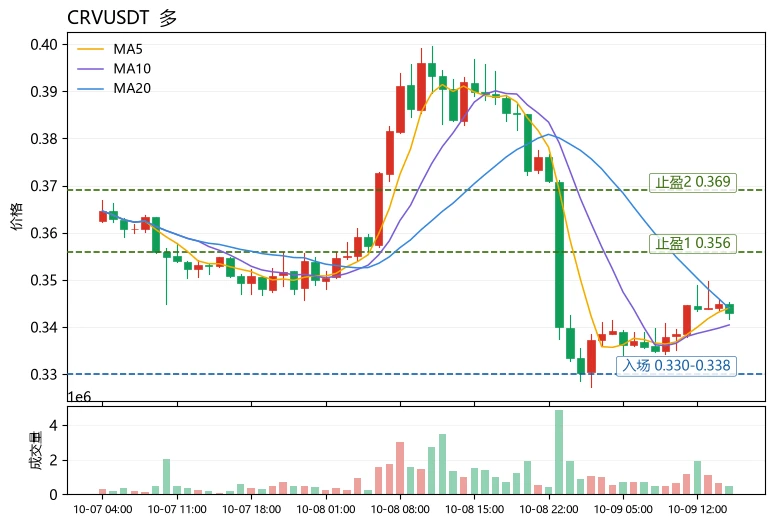
$CRV Down 13%—which side is the money really on?
The answer is: the long side, but with a lot of hesitation. CRVUSDT is currently at 0.343, down 13.12% over 24h, yet the funding rate is -0.0034%—a negative funding rate means shorts are paying longs, so short sellers are actually paying to maintain their positions. Falling price and negative funding indicate that this sell-off was driven by spot selling pressure or forced liquidations, not by shorts actively adding positions. Technically, MA5=0.34404 remains slightly above MA20=0.343945, so the moving averages have not formed a death cross; RSI
post-image
CRV-14.35%
CTSI+11.81%
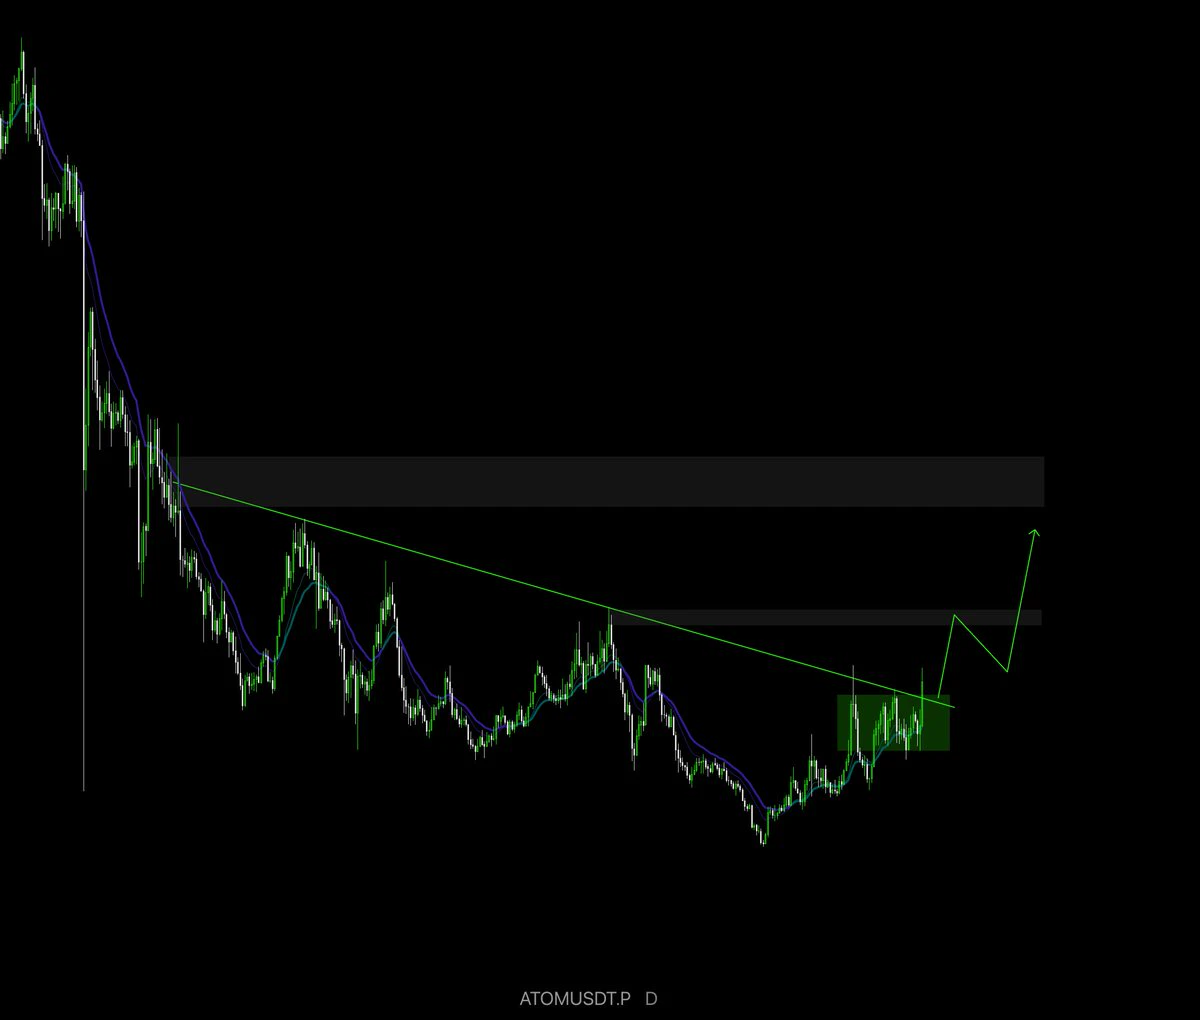
cosmos:native 1D
Daily timeframe breakout
Expected rebound
Potential upside of 30-50%
post-image
ATOM+9.29%
#NewProfilePic (new personal data photo)
post-image
Short $WLFI
. Entry range: 0.05474 - 0.05501Target 1: 0.05220Target 2: 0.05006Invalidation level: 0.05666WLFI is attempting to rebound, but the macro trend indicates that the price will fall back to the lows. Short during the volatility! If you like this trade setup, you can trade here. Closely watching $JCT and $ZEC .
post-image
ZEC-1.38%
A bombshell! Trump is betting $6 billion on AI, while smart money is dumping tech giants—will the crypto market be turned upside down?
As the national team begins heavily investing in the future, smart money is quietly exiting—which side do you think has seen through the game? Guys, big news! The Trump administration has just played its trump card—the “Genesis Mission,” with a total scale exceeding $6 billion, joining forces with 11 tech giants including NVIDIA and OpenAI to lavish $2.4 billion on AI and quantum computing. This is no small move—it is setting the tone for the entire technology
post-image
SKHYNIX-1.08%
NVDA-0.69%
SNDK-2.11%
Crypto Market Updates
live-cover
LIVE1,984
10.9BTC
Last night, I chose to bet on a rebound at the four-hour support level, but it didn’t work out—price continued to plunge and hit the stop-loss.
Although BTC did not fall below 800, the overall market is currently weak.
The move back to 825 is itself a corrective rebound after being oversold, so for now I’m not treating it as a reversal.
Today, I’ll first watch whether this level on the daily chart can hold, and keep an eye on 830$BTC $GT $ETH #Gate亮相TOKEN2049 #BTC回调触及81000美元 #美股AI概念股普跌ALAB跌超9% .
BTC-0.57%
GT-1.32%
ETH-2.48%
Afternoon Market Update
live-cover
LIVE1,680
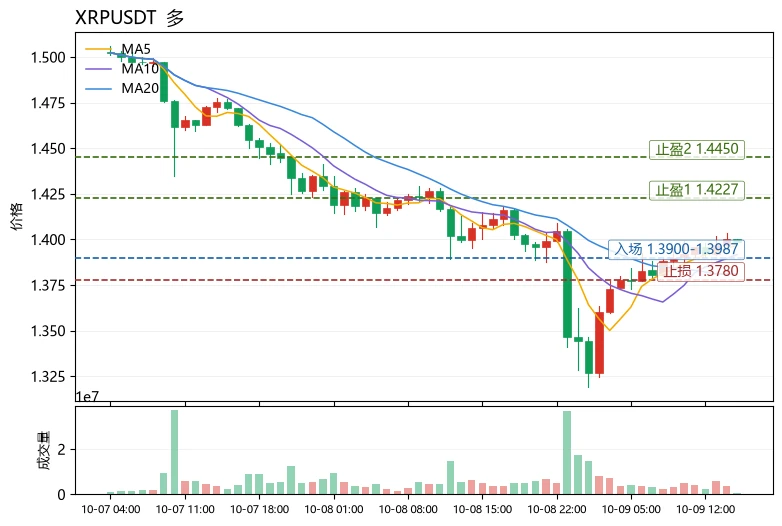
$XRP Current price 1.3987, down just 0.58% over 24h, with a trading volume of 227.5M USDT; over the same period, $SUI
fell 6.05%, while $AUDIO rose 12.29% but had a trading volume of only 5.4M, placing them on completely different scales. Compared horizontally within the same sector, XRP clearly has superior downside resilience and liquidity depth, which is a reason to keep it on watch.
Technical outlook: MA5=1.39666 has crossed above and held above MA20=1.38109, with the short-term moving averages in a bullish alignment; the MACD histogram at +0.00505 remains bullish, RSI=52.6 is in a neut
post-image
AUDIO+8.90%
I have joined #WCTCS9,点击链接加入我的团队,与我一起瓜分 3, with a total prize pool of 200,000 USDT—fight for honor!
K-lines rise and fall, much like the ups and downs of life, reflecting the joys and sorrows of every trader.
Looking back at the market during this period, BTC has weathered several ups and downs, while ETH has also staged a notable rebound. Yet a rising market does not mean everyone gets a share of the gains. Some miss the rally, while others remain deeply trapped in losing positions. As prices climb, their accounts show little improvement. The hardest part has never been a temporary loss, but being in the market and still unable to seize the opportunities meant for them.
“Mountains beyond mo
post-image
BTC-0.57%
Let's keep it going tonight! $BTC $ETH $SNDK
post-image
BTC-0.57%
ETH-2.48%
SNDK-2.11%
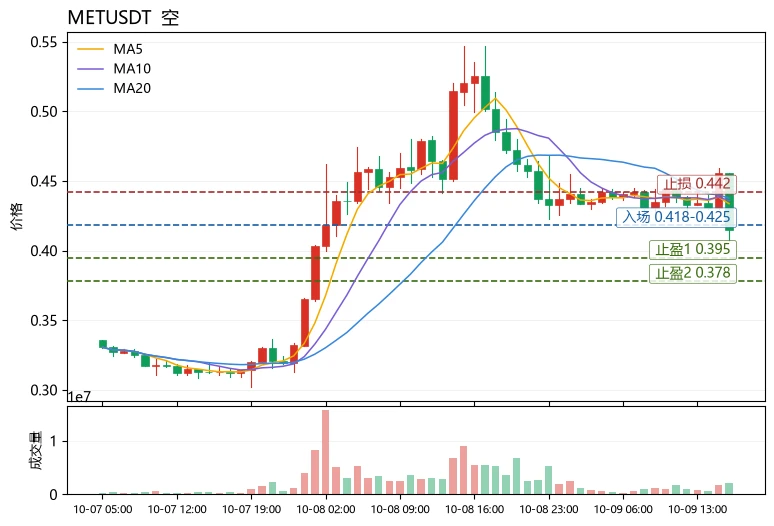
Many people directly equate “falling a lot” with “having fallen enough”—this is the most expensive lesson in a bear market. $MET 24 hours fell 18.78%, the current price is 0.414, and the amplitude across 30 K-lines reached as high as 33.69%. This is not a pullback, but a volatility expansion phase. The biggest taboo at this point is using a fixed position size to take on floating risk.
Technically, MA5=0.43358 has fallen below MA20=0.4376, the MACD histogram at -0.003089 remains bearish, and although RSI=42.1 is not oversold, there are no signs of divergence at all. The lower Bollinger Band at
post-image
MET-20.61%
PYTH+14.09%
GM ☀️
Lets make this day a great one
post-image
$BTC This round of decline may appear to be under pressure, but the market has actually shown greater resilience than expected.
U.S. Treasury yields have remained elevated, shifting rate-hike expectations have repeatedly unsettled the market, and rising oil prices have further intensified inflation concerns. The macro environment is far from friendly, making market sentiment increasingly cautious, but in terms of actual price action, BTC’s pullback remains relatively limited.
What is truly worth considering has never been how much negative news there is, but rather how price has performed amid
post-image
BTC-0.57%
ETH-2.48%
Load More

Join 40 M users in our growing community

⚡️ Join 40 M users in the crypto craze discussion

💬 Engage with your favorite top creators

👍 See what interests you

Trending Topics

GateAtTOKEN2049

36.56k Views20.91k Discussing

Gate brought a series of major events to TOKEN2049 Singapore! From the official launch of Gate Money to the F1 Red Bull driver meet-and-greet and the Gate Gala, we witnessed a new chapter of "One Gate, Borderless Finance." Which moment from TOKEN2049 stood out most to you?

GateWCTCS9GlobalTradingCompetition

32.18k Views3.45k Discussing

BTC Pulls Back to 81000

25.82k Views35.79k Discussing

View More