
Square
Following
Hot
News
Notifications
Profile
Share your thoughts
placeholder
Article
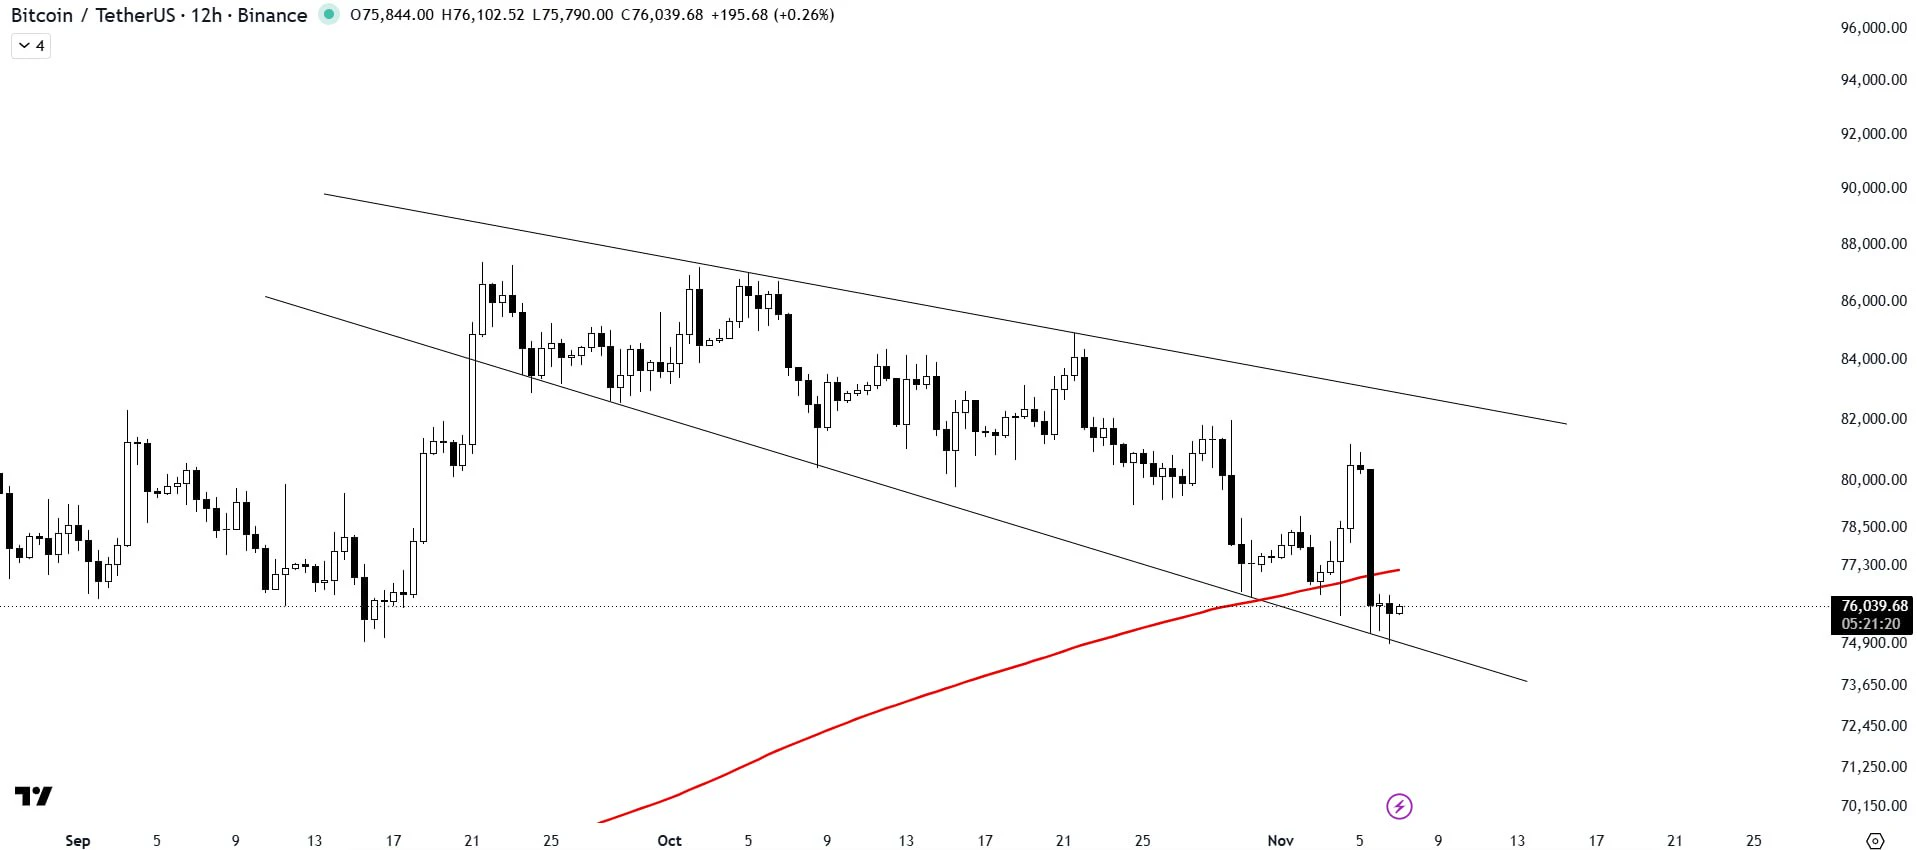
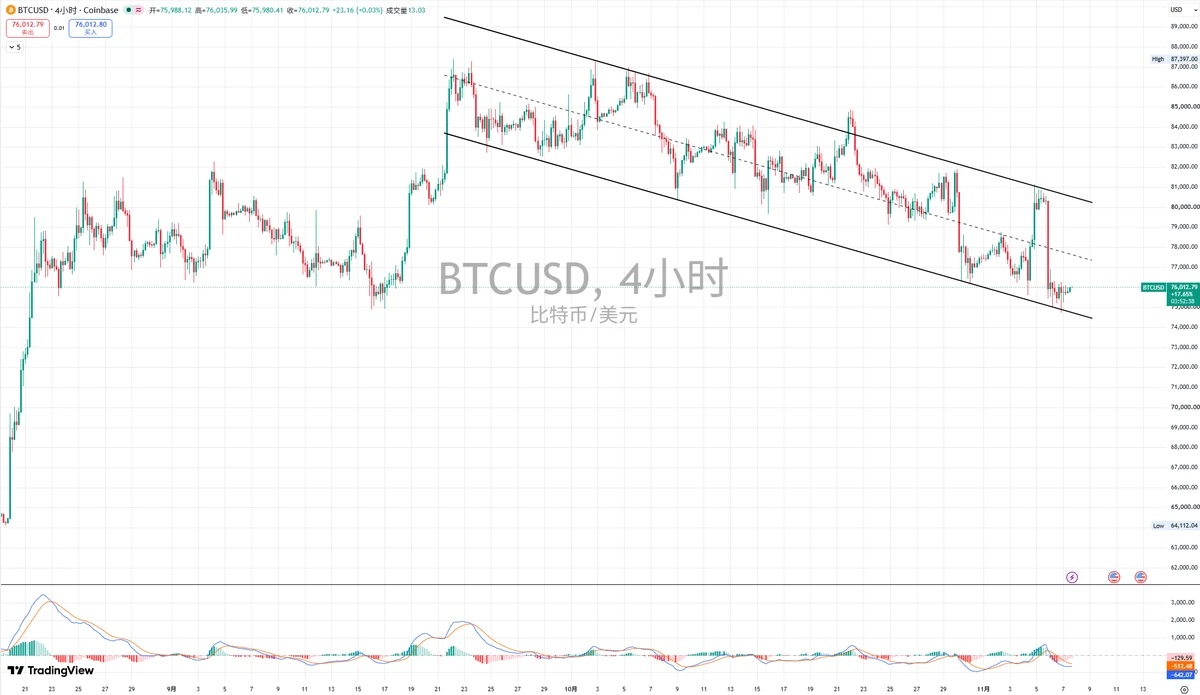
$BTC just bounced off the lower trendline of this descending broadening wedge.

Price is sitting near $76K after holding the $75K zone, so buyers are clearly still showing up at support. But I wouldn't call it a reversal yet, because the 200MA around $77K is right above and acting as a real ceiling.

Here's what I'm looking at:

→ $75K holds = bounce stays alive
→ 12H close above the 200MA = momentum can shift bullish
→ Upside zone after that = $80K–$82K
→ Trendline breaks down = idea is off, stay careful

No need to rush into anything here. I'd rather wait for the chart to confirm than guess
post-image
BTC-0.67%
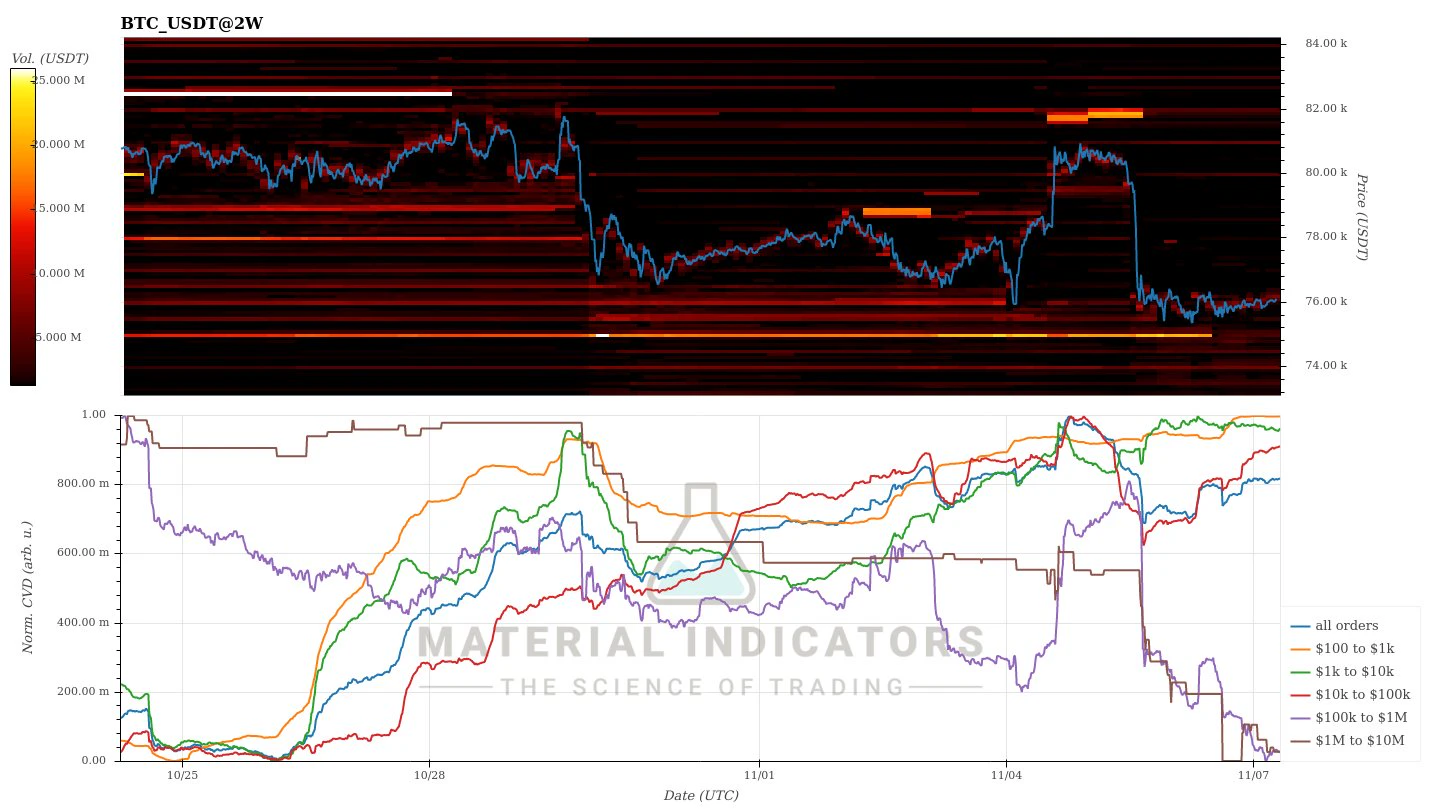
The $BTC CVD indicator shows a quiet state.

As become an weekend, market activity has dropped significantly. There is any other movement.

In addition, there are any other buy or sell walls.
post-image
BTC-0.65%
Trenches
ZIG
Z
bade
b
ZIG
0x8c...1145
Market Cap
$.
Change
.
24h Vol
$.
Holders
.
BTC
B
bade
b
BTC
C5xp...pump
Market Cap
$.
Change
.
24h Vol
$.
Holders
.
Diamond
D
bade
b
Diamond
5VCE...pump
Market Cap
$.
Change
.
24h Vol
$.
Holders
.
STONK
S
bade
b
STONK
6GmA...UNgx
Market Cap
$.
Change
.
24h Vol
$.
Holders
.
DOGE
D
bade
b
DOGE
DoGE...fm7R
Market Cap
$.
Change
.
24h Vol
$.
Holders
.
“I Only Do Three Things a Day, and My Account Became More Stable”) I used to watch the market for twelve hours a day, and my account kept shrinking. Later, I turned trading into a “clock-in, clock-out” routine, and my account became more stable. 06:30 Wake up. Don’t look at prices yet; just check where the daily candle closed and whether the 4H direction has changed. Is it up or down? Is volume higher or lower than yesterday? A quick glance tells you. If the direction is unclear, I don’t trade that day. This takes five minutes and can save me from a whole day of impulsive trades. 12:00 Take on
post-image
BTC-0.65%
ETH-1.23%
Damn! My idol, The Rock
How did he end up looking like this?
How did The Rock turn into a pebble?
$ESPORTS It wasn't long before it hit TP2 🔥🔥🔥 Whoa! 🤤🤤🤤🤤🤤🤤🤤🤤🤤🤤🤤🤤🤤🤤🤤🤤🤤🤤🤤🤤🤤PandaTraders has pulled off another perfect trade. Who caught this dump? Comment your profits below, and don't forget to move your stop loss into profit. ESPOPTSUSDT JobsReportRaisesHikeOdds CPITestsDecemberRateOutlook WillUS-IranTensionsBoostSafe-HavenDemand?
post-image
ESPORTS-5.30%
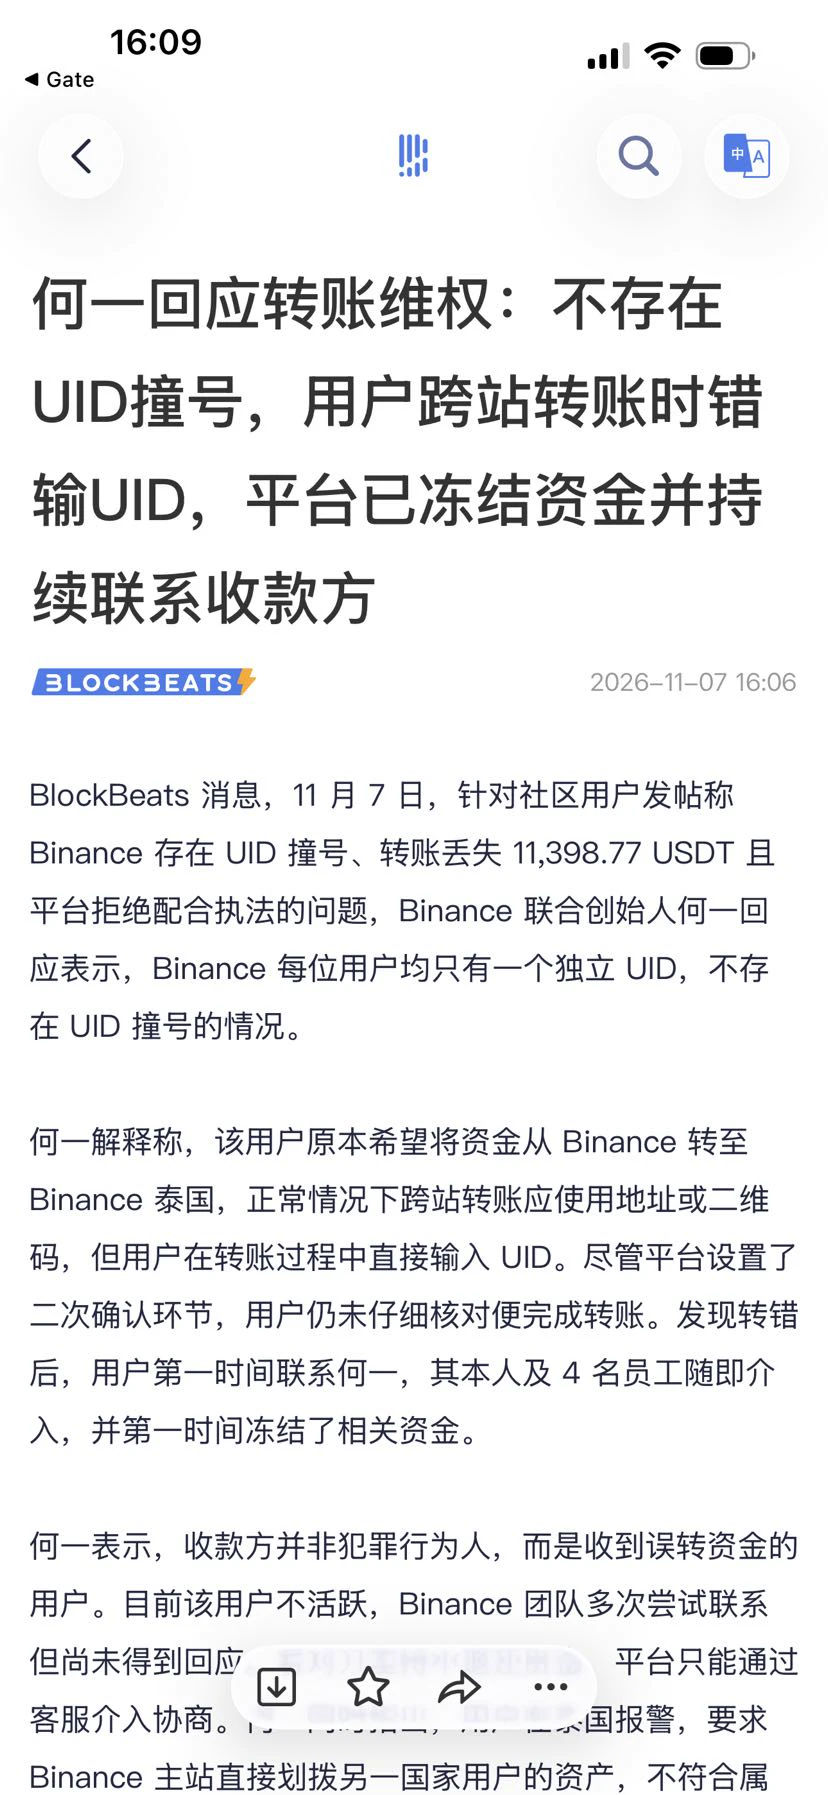
He Yi Responds to Transfer Dispute: No UID Collision Occurred; User Entered the Wrong UID When Transferring Across Platforms, and the Platform Has Frozen the Funds and Is Continuing to Contact the Recipient
post-image
88.26% and 104.58%—these two figures are not the same thing. Don’t mix them up.

Gate’s PoSEC report contains two figures that are easy to confuse: 88.26% and 104.58%. At first glance, an 88% cold storage ratio may seem lower than the “99% offline” claimed by some exchanges. But these figures measure fundamentally different things.

88.26% is the share of the platform’s total assets held in cold storage. It answers the question: How much of your assets are kept in an offline environment? This is a structural metric.

104.58% is the coverage of total user funds by cold storage. It answers the q
MU+4.71%
  • 1
Honestly, the 12% upfront fee made me wince too at first glance.

But think about it—when Circle went public, its stock doubled right out of the gate. Did you get in? If not, you probably ended up chasing it at a higher price. That’s what really costs you.

I’ve been trading for years, and the most expensive thing has never been the “fees”—it’s “not getting the allocation.” The VIP round is basically paying for a guaranteed spot. Top-tier channels have historically had allocation rates of 40%–80%. If you put in 100,000, you’ll most likely get an allocation worth 40,000–80,000.

The public roun
post-image
CRCL-2.30%
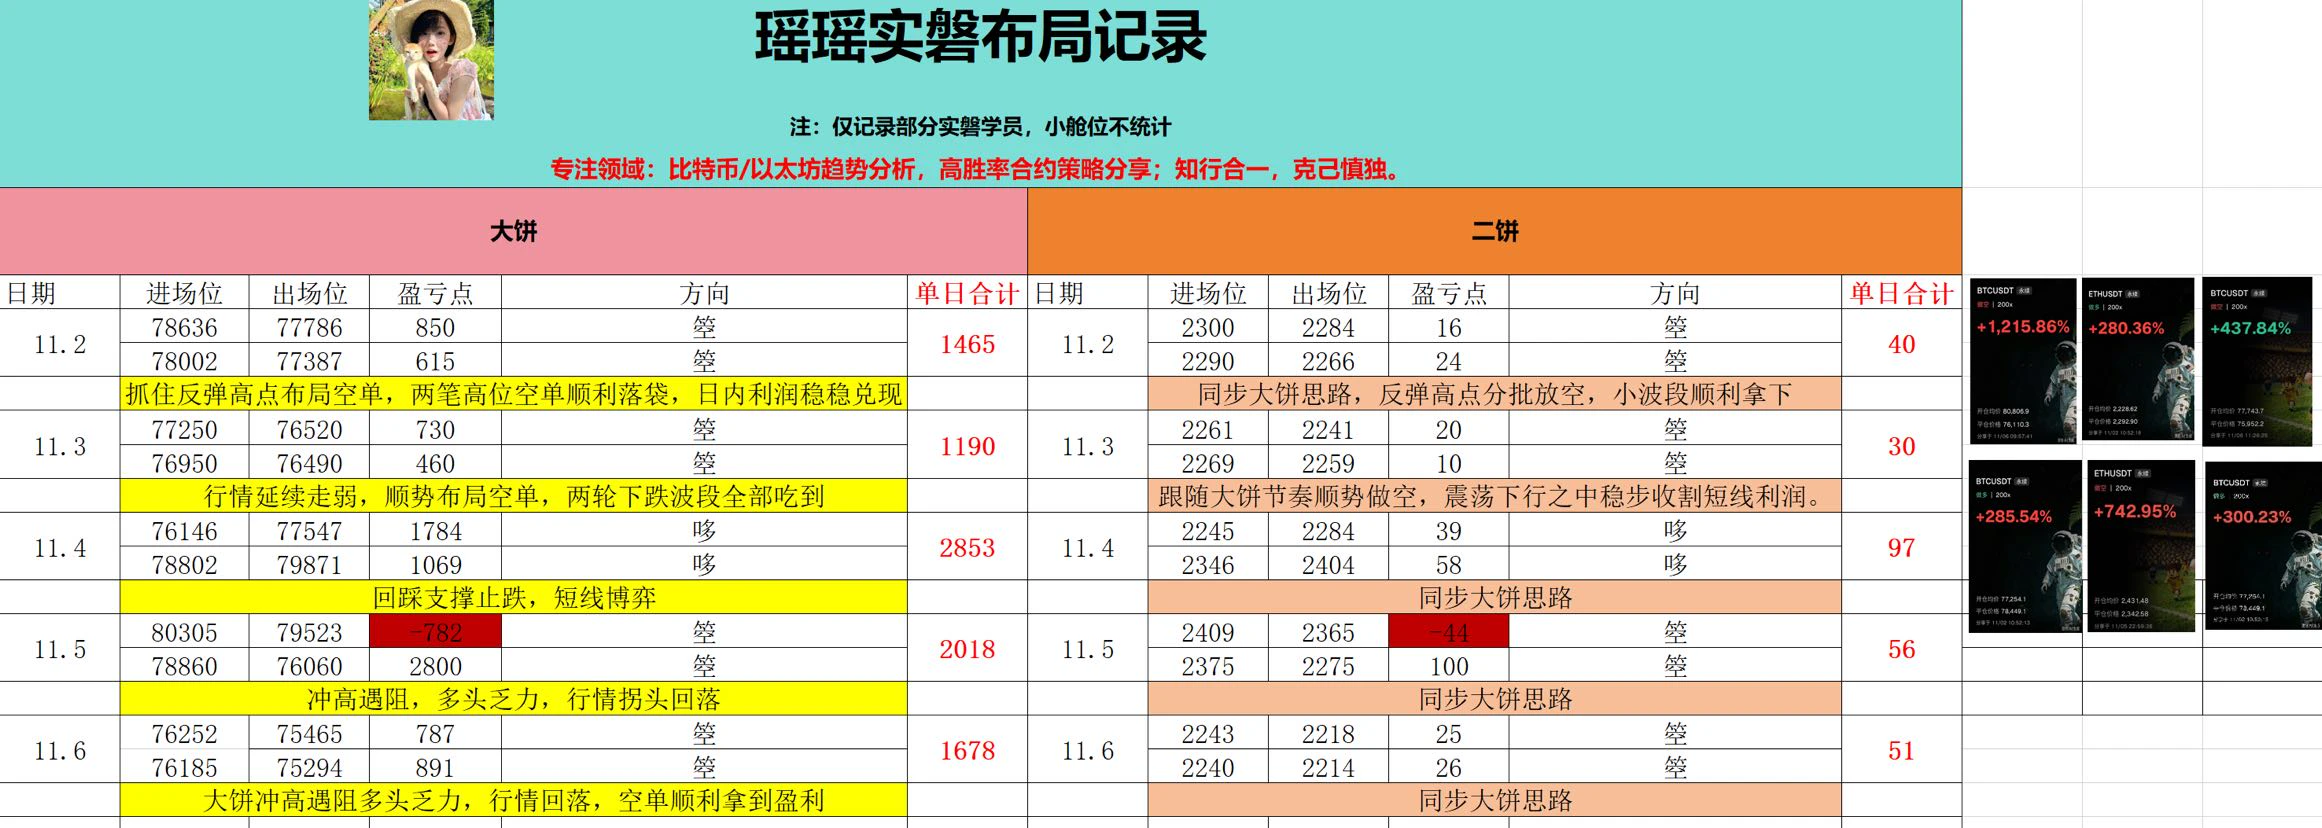
Yaoyao | Weekly Strategy Review $BTC $ETH
BTC traded back and forth in a range this week. Main strategy: short at resistance and take short-term long positions at support.
The market weakened in the first half of the week, so we shorted rebounds at their highs and captured the downward swing. When prices retested support, held, and turned stronger, we quickly switched to longs to catch the rebound. After the rally lost steam and met resistance, we switched back to a strategy of shorting at higher levels.
ETH followed the same strategy as BTC throughout, staying in sync with the main trend and
post-image
BTC-0.65%
ETH-1.23%
Review and Learning Notes
Today is the final day for the 5-day moving average, and it currently looks set to close with a long bearish candle.
The larger trend remains bearish. There are two key zones: 2290–300 and 2350–2380, both facing significant resistance. You can open a starter position in the first zone; a break above the second resistance level would invalidate this bullish setup.
Conversely, if the price retests lower levels, BTC below 80k remains in a bearish trend. Only a breakout and sustained hold above that level would signal a potential reversal.
Note: This is just my personal f
post-image
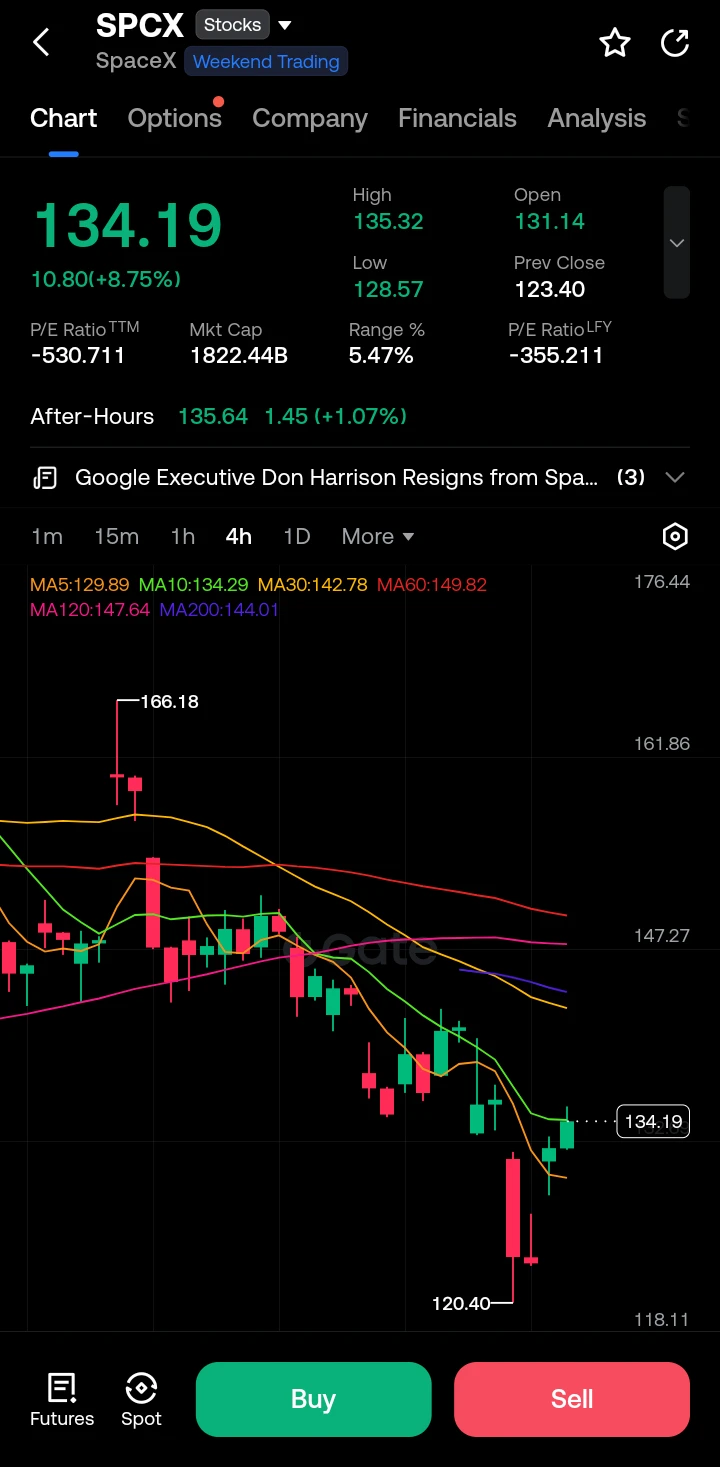
$SPCX ‌
SPCX is trading at 134.19, up +8.75% on the session after a sharp recovery from the 120.40 low. Price has reclaimed the MA5 (129.89) and is testing the MA10 (134.29). Broader structure remains bearish with price still below the MA30/60/120/200 cluster (142–149 zone). After-hours is holding the bounce at 135.64.

Resistance: 135.30–136.50 (session high + after-hours), 142–144 (MA30 + MA200), 147–150 (MA120/MA60)
Support: 129.80–130.50 (MA5 + recent base), 128.50, 123.40 (prev close), 120.40 (swing low)

Strong impulsive red candle into 120.40 showed panic selling / stop-run.
Immediate
post-image
SPCX+8.74%
  • 2
The U.S. added 165,000 nonfarm payroll jobs in October, far exceeding expectations.
live-cover
LIVE3,344
$LYN Up 19% in a day, but what’s really alarming is the trading volume.
From 0.0182 to 0.0313, a 56% intraday range. This isn’t a pump; it’s a meat grinder that’s already spun around twice. Look at the price now: 0.0269, already down 14% from the high, but still up nearly 50% from the low. So who was buying around 0.018? Probably not retail traders—panic sellers were dumping everything at that level.
Trading volume is 97.6M. For a coin with this kind of market cap, the turnover is already huge. The money flow is clear: large buy orders supported the price at the lows, then started selling in b
$TSLA ‌
TSLA closed the session near 358.16 (+4.26%), recovering from a sharp drop to 338.15. Price remains well below major moving averages (MA10/30/60 clustered 376–385). Short-term bounce is underway, but the broader structure stays bearish after the recent sell-off. After-hours holds slightly higher at ~359.40.

- Support: 349–347 (recent low zone / S1), 340–338 (session low & strong support)
- Resistance: 363–365 (day high / R1), 376–380 (MA cluster), 385–390

A large bearish candle drove price from the 380s down to 338.15, showing strong selling pressure and a clear breakdown. The s
TSLA+4.26%
  • 6
BTC PREDICTION MARKET UPDATE
live-cover
LIVE2,127
$BTC
BTC Update:
After forming a small-timeframe door pattern, price has started a choppy recovery. Overall, it’s still trading within a parallel channel. Last night’s low was near 74.8k, and it has now returned to around 76k and is consolidating.
There’s no liquidity over the weekend, so just keep watching. The liquidity zone below is still around 72k.
post-image
BTC-0.67%
Share Token Info $PAYDAY to the moon
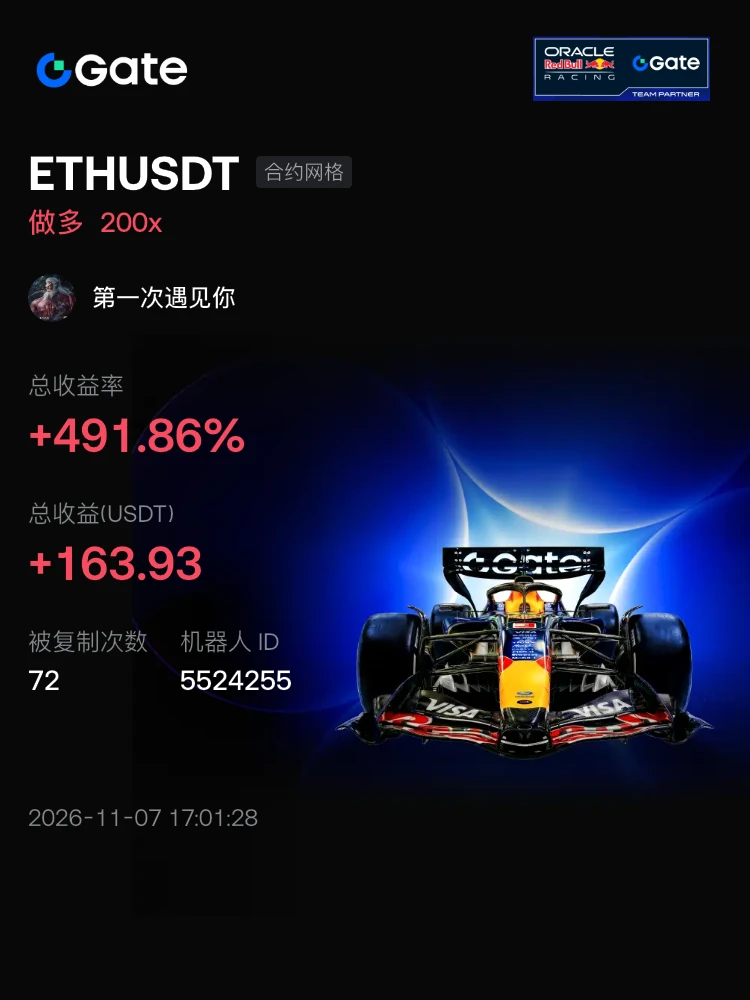
#交易机器人 I'm using the ETHUSDT futures grid bot on Gate, come copy my trades
post-image
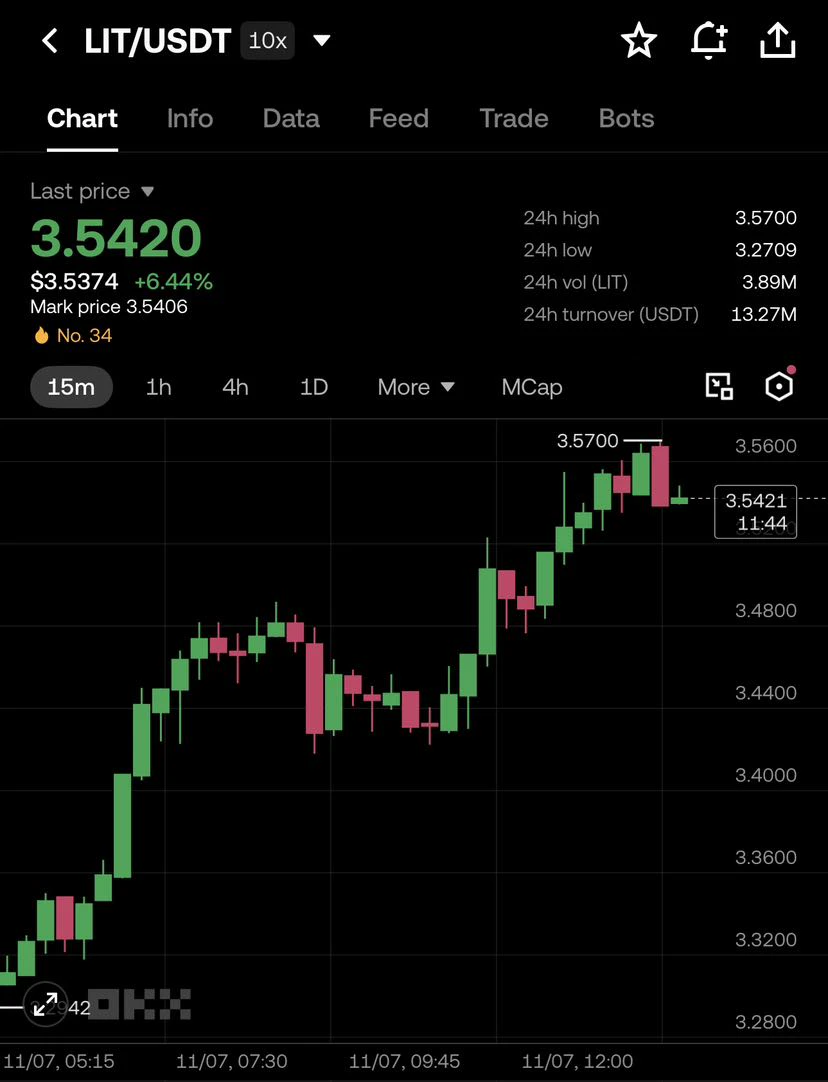
$LIT is showing strong bullish momentum trading at $3.5420 up 6.44%.

Buyers are pushing toward the $3.5700 resistance.

A breakout could open the door for further upside while $3.4800 remains an important support to watch.

Watching for breakout confirmation!#USAIStocksHitHard #BTCETFOutflowsContinue
post-image
LIT-4.56%
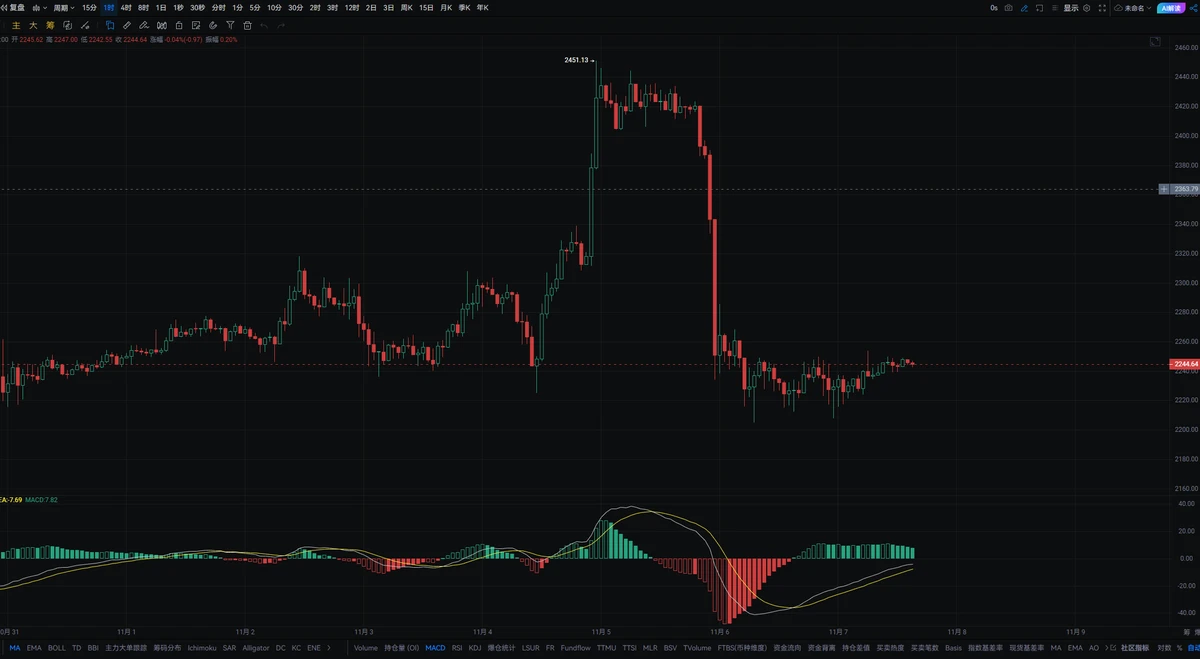
#ETH At the current price of 2245, ETH remains highly correlated with BTC’s movements and is unlikely to make an independent move. Its volatility is also likely to be greater than Bitcoin’s. The first short-term resistance is near 2310, with a major resistance zone at 2360–2400. ETH will only have a chance to see a surge in volume and test this resistance if BTC holds above 78000. On the downside, short-term support is at 2200. If BTC breaks further below a key support level, ETH will likely follow and weaken faster, testing the support zone around 2150.

From a chart-structure perspective, th
post-image
ETH-1.26%
BTC-0.67%
Load More

Join 40 M users in our growing community

⚡️ Join 40 M users in the crypto craze discussion

💬 Engage with your favorite top creators

👍 See what interests you

Trending Topics

USAIStocksHitHard

16.92k Views3.65k Discussing

U.S. stocks sold off sharply on Thursday, November 5 (UTC). The Nasdaq closed down around 5.5%, entering correction territory, while the Philadelphia Semiconductor Index plunged roughly 12%, with chip stocks including $NVDA and $AMD posting steep losses. Beyond profit-taking, investors are growing concerned about the pace of AI data center construction, capital spending, and future returns on investment. The key question now is whether the AI sector’s lofty growth expectations need to be repriced. Where do you think the next opportunities will emerge: chip stocks, tech giants, or other sectors?

USNonfarmPayrolls

25.21k Views4.27k Discussing

StakeOnLaunchpoolToShare450KVLX

3.76k Views782 Discussing

View More