
Square
Following
Hot
News
Notifications
Profile
Share your thoughts
placeholder
Article
$CELR is showing signs of a bullish rebound‼️ I'm considering going long after a confirmed breakout. Entry: 0.001900 – 0.001920 Take profit: 0.002000 Stop loss: 0.001870
post-image
CELR-3.47%
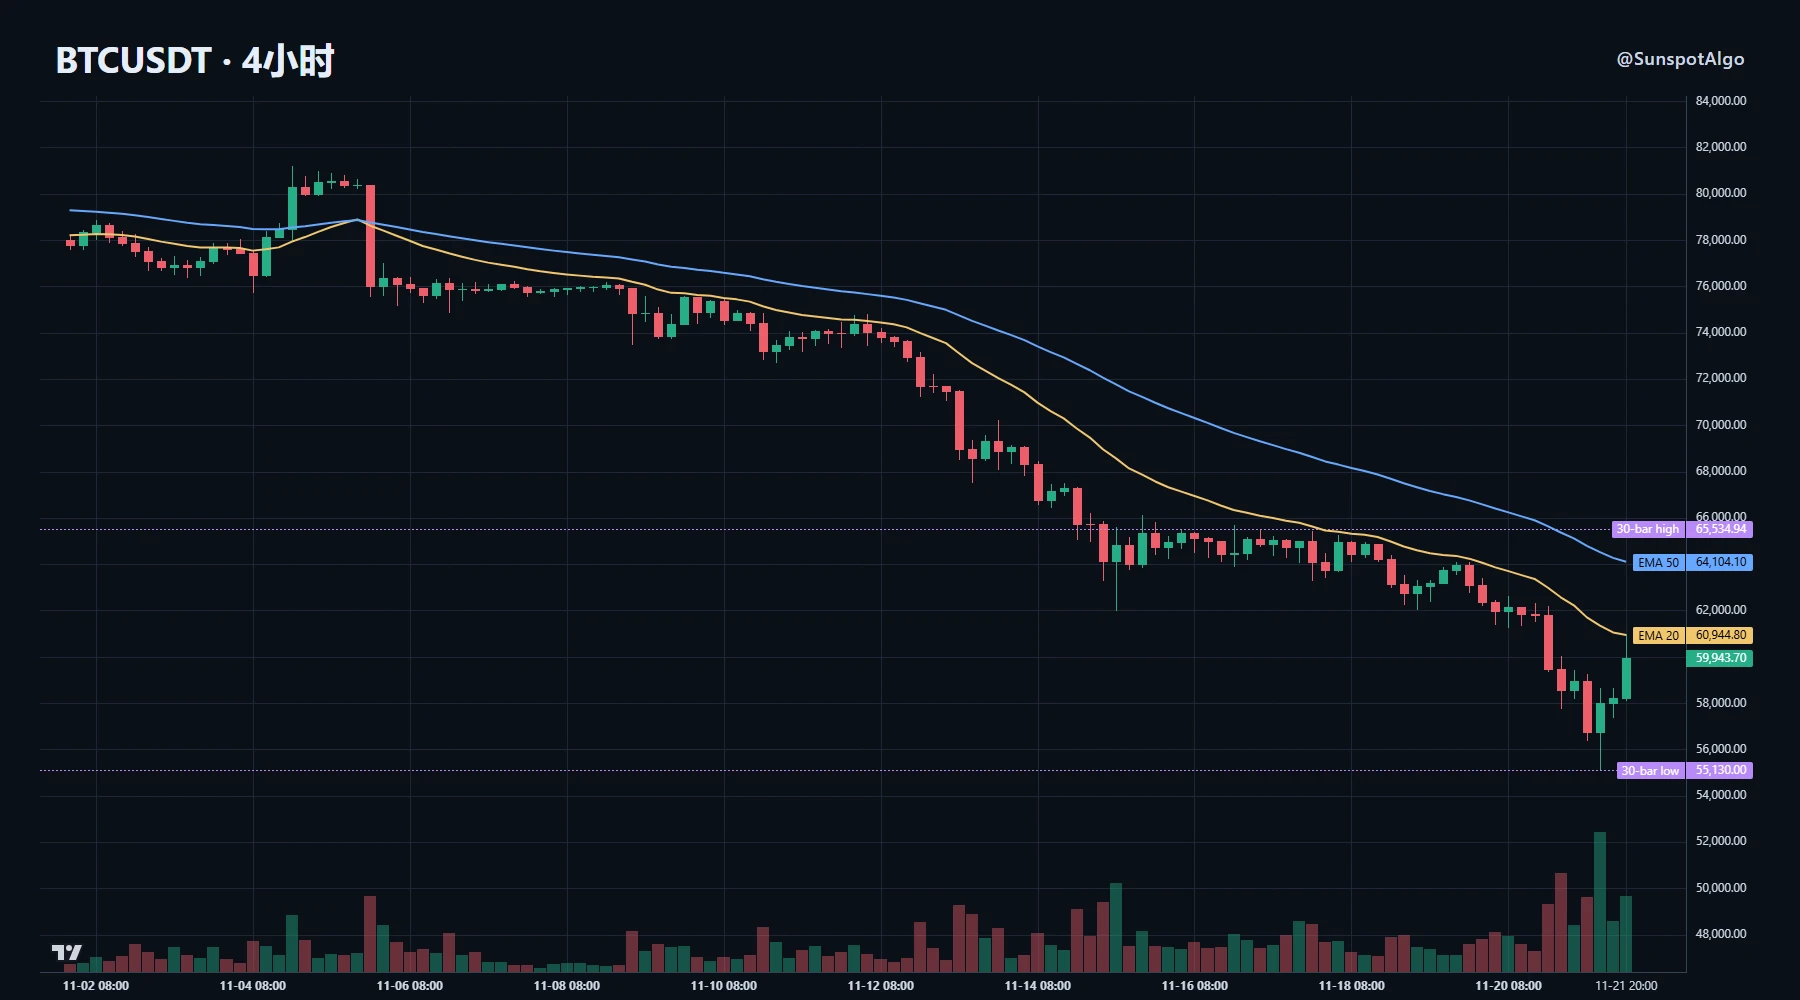
The past two days have been a classic chart trap: the daily chart is still in a bearish alignment, and the 4H chart keeps printing long wicks, making it look like a bottom.

First, the rhythm. After falling nearly 9.8% in 5 days, the price reached the 4.4th percentile of its 30-day range. The daily chart is capped by 69,500 and 74,500. The 4H candle closed at 59,900, with the short-term moving average at 60,900 overhead.

Open interest makes the rhythm clear. Open interest fell 4.3% over 24 hours, while the price staged a slight recovery; the funding rate was -0.0009%, near zero. Price up, ope
post-image
NAS100-4.60%
SPX+0.33%
VOLX+0.40%
XAUUSD-2.40%
Trenches
IDOL
I
bade
b
IDOL
0x3b...ab07
Market Cap
$.
Change
.
24h Vol
$.
Holders
.
PIEVERSE
P
bade
b
PIEVERSE
0x0e...25a9
Market Cap
$.
Change
.
24h Vol
$.
Holders
.
FIONA
F
bade
b
FIONA
B34n...pump
Market Cap
$.
Change
.
24h Vol
$.
Holders
.
Singularity
S
bade
b
Singularity
7R4M...pump
Market Cap
$.
Change
.
24h Vol
$.
Holders
.
CLAUDIA
C
bade
b
CLAUDIA
2j5S...W2ZM
Market Cap
$.
Change
.
24h Vol
$.
Holders
.
$EVAA Almost 7x now, keep holding and wait for 10x
EVAA-0.49%
NEAR
live-cover
LIVE1,143
NEAR+1.17%
$BR has already met all my expectations for this setup. That's it for today. Taking profits. Looking at $VVV and $XRP .
post-image
BR+6.00%
VVV+0.37%
XRP-1.15%
#ShareWeekly #NvidiaDropsNearly14Percent
### Nvidia Drops Nearly 14% Amid Massive Stock Market Sell-Off

Nvidia (NVDA) shares plunged nearly 14% on November 20, 2026, closing at approximately $125.53 as investors rushed to sell technology stocks. The sharp decline wiped out nearly $500 billion in market value in a single trading session.

One major concern was a reported US Securities and Exchange Commission (SEC) examination of Nvidia's accounting practices. The regulatory uncertainty added pressure to the stock, which was already struggling amid concerns about expensive AI valuations and sl
NVDA-13.84%
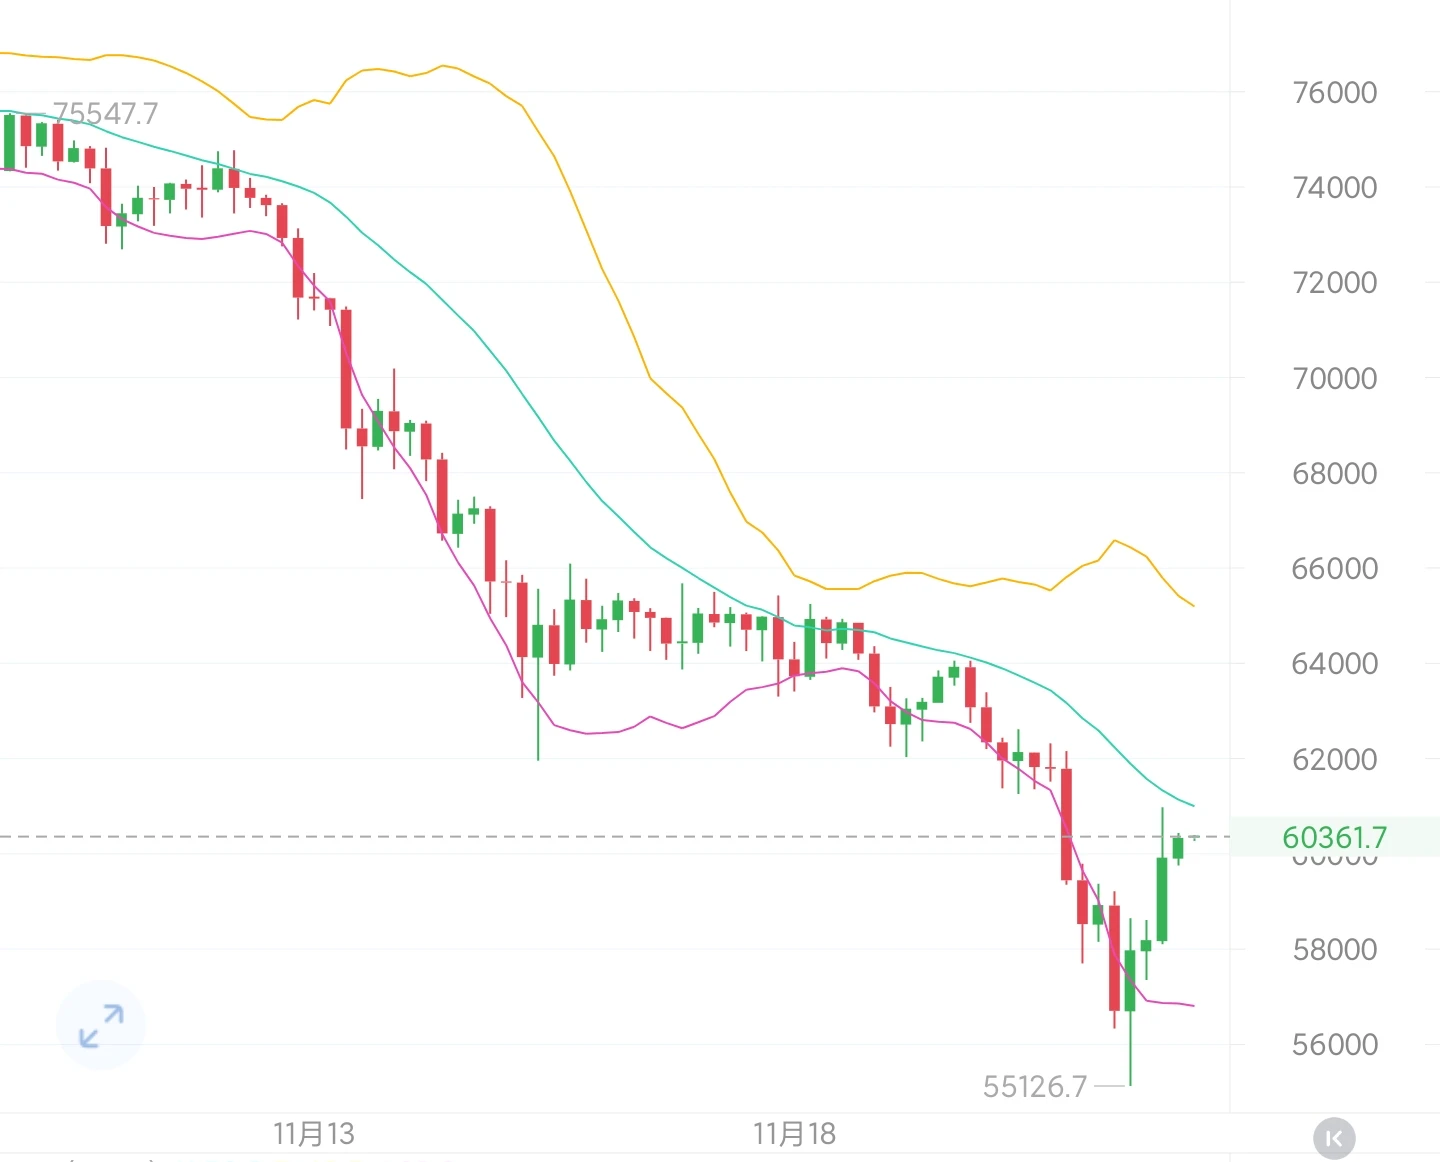
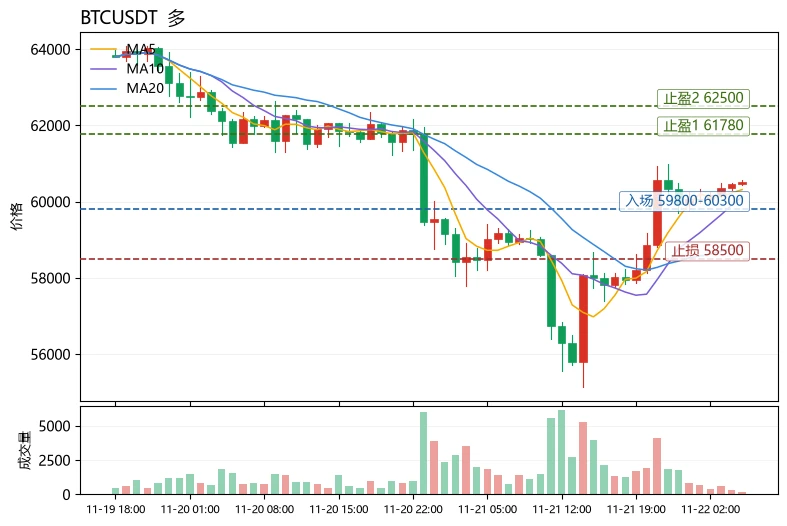
BTC is currently around 60,300, up 1.48% in a modest 24-hour rebound, ending several days of steep declines and bringing a short-term technical recovery. The daily chart remains in a weak, choppy trend, with losses exceeding 6% so far this week; overall, the market is in a bearish correction structure. Selling pressure is evident on the 4-hour chart, with price staying below the 50- and 200-period moving averages for an extended period, indicating a weak medium-term trend.

The short-term chart has completed an oversold rebound, but trading volume has not meaningfully increased, and the reboun
post-image
BTC-0.65%
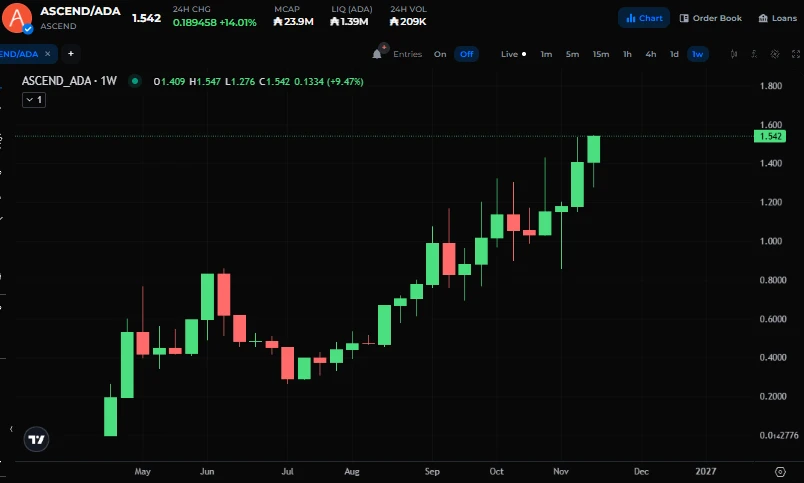
Midnight's perpetuals platform $ASCEND hits a new ATH🚀
post-image
NIGHT-3.07%
#ZEC
ZEC (Zcash): The Future of Privacy-Focused Cryptocurrency
Zcash (ZEC) is one of the most recognized privacy-focused cryptocurrencies in the digital asset market. Its primary mission is to provide users with greater financial privacy while maintaining the benefits of blockchain technology.
Unlike traditional transparent blockchains, Zcash offers optional shielded transactions through advanced zero-knowledge proof technology called zk-SNARKs. This technology allows transactions to be verified without publicly revealing sensitive transaction details.
ZEC's long-term potential depends on gro
post-image
ZEC+1.16%
BTC-0.67%
  • 1
$VELVET bought in again, and it's pumping
VELVET-3.58%
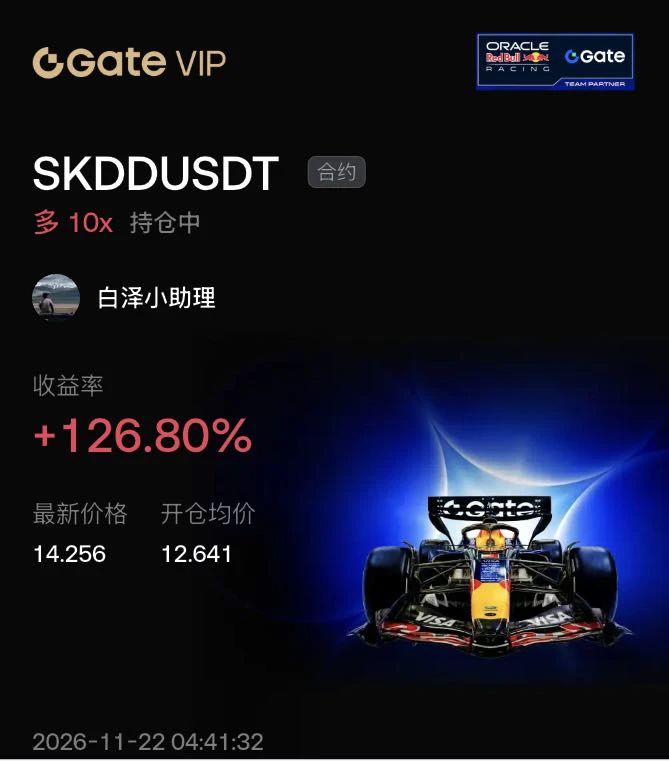
This is the most important thing right now: after the 11/20 close, SK Hynix returned to 106.3 to 106.5, up 2.6% to 2.8%; $SKDD meanwhile fell from 15.56 to 14.56 to 14.80, down 5% to 6.4%.

Whenever the other side bounces, it gives back its gains. The leverage is still 2x, and the same applies in the opposite direction.

Then look at its fundamentals: assets total only $6 million to $8 million, the annual management fee is 2.2%, and average daily trading volume is 4.45 million shares. It’s a very small fund, so gaps and severe slippage are common.

During the early morning hours, the underlyi
post-image
SKDD-1.02%
BTC-0.65%
  • 1
🚀 BUILDING MY NEXT BULL RUN WATCHLIST! 💎
Hunting for promising gems with serious upside potential. 👀🔥
Here's what's on my radar:
$CKOM $RET $BETA $VRA $ALCX $PEPE $BONK $HOLD $POND
#Dogecoin #Pepe2 $WEB $HOT $GEO $WSM $WTC $DEXO $CAT
👇 WHAT AM I MISSING?
Drop ONE project you believe deserves a spot on this watchlist and tell us why!
Let's discover some hidden gems together. 🔥
#Crypto #Altcoins #Memecoins #BullRun
post-image
ALCX+0.13%
PEPE+0.97%
BONK-2.29%
HOLD+0.00%
POND-3.32%
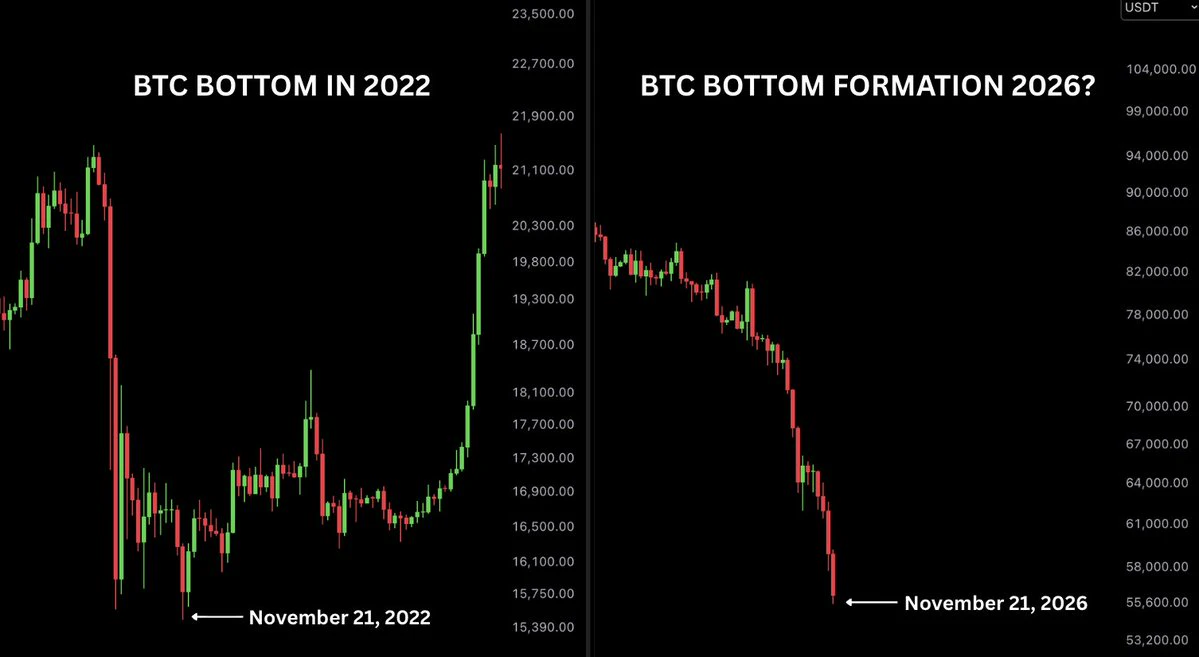
🚨 HISTORY IS GETTING INTERESTING! 👀
Exactly 4 years ago today, Bitcoin formed its cycle bottom.
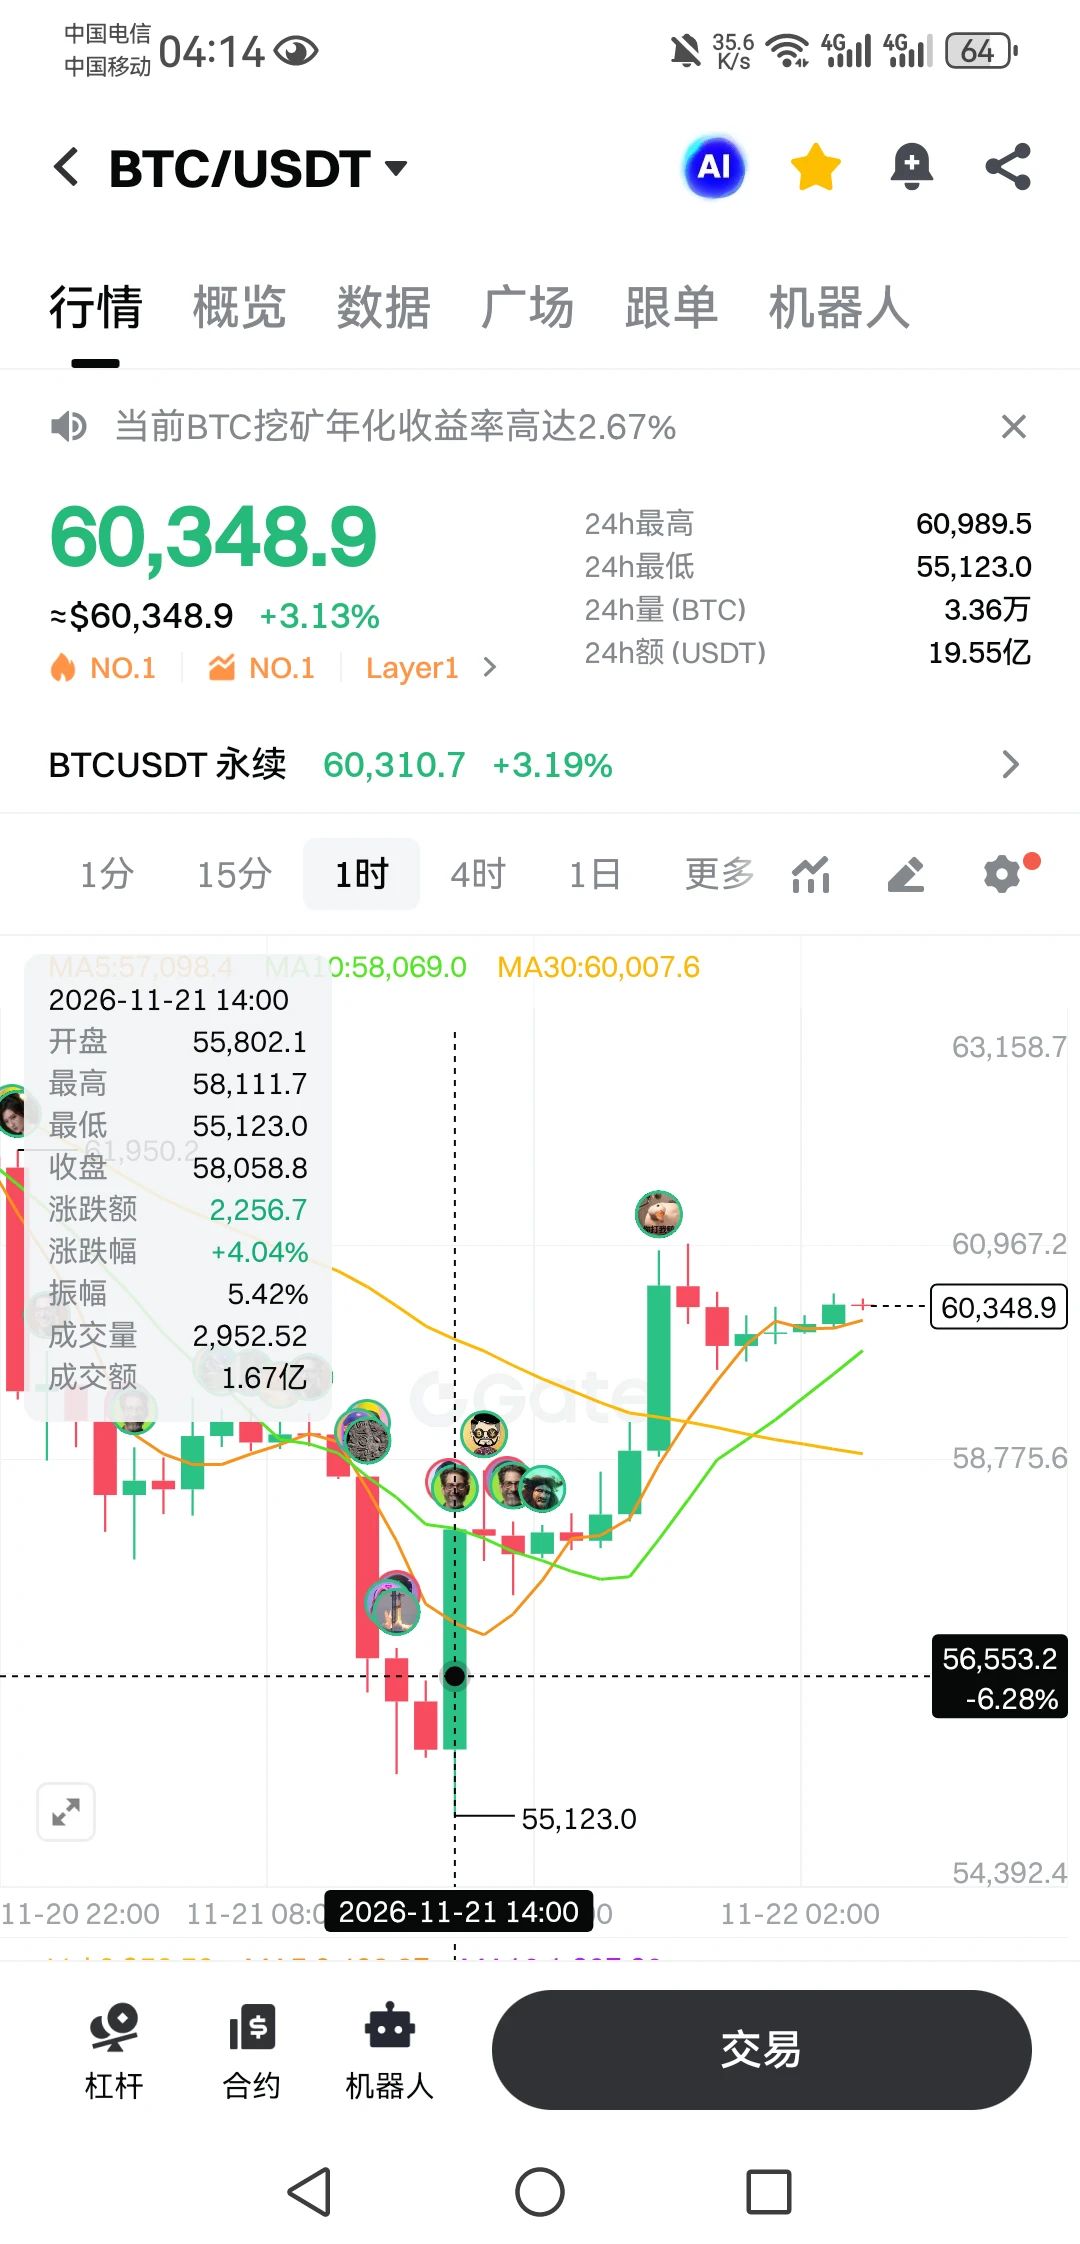
Fast forward to today, and $BTC has dropped to a new cycle low of $55,150.
Could this be another major turning point for Bitcoin?
What if the bottom is already in and nobody believes it yet? 🚀📈
**Are we witnessing the beginning of the next bull run?** 🔥
post-image
BTC-0.67%
The most unusual detail in today’s market is that $BTC rose 3.60% against the trend while the Fear & Greed Index was just 12 (Extreme Fear), yet the funding rate was -0.0048%—shorts are paying to hold positions, while the price has climbed above MA5 (60316.5) and MA20 (58840.4). This is a classic short-squeeze structure, not a healthy trend. In terms of volatility, the range across 30 candlesticks is about 9.69%, and the upper Bollinger Band at 61786.8 is close at hand, so the risk/reward of chasing higher has already deteriorated. My rule is to go long only after a confirmed pullback, not to
post-image
MMT-2.35%
Fear Grips Global Markets as Wall Street Approaches a Critical Point
live-cover
LIVE832
BTC-0.67%
ETH-1.26%
SOL-0.77%
EVAA-0.49%
ZEC+1.16%
🎮 GAME TIME! 🚀🔥
If you could pick JUST ONE crypto with the potential to pull a 100x, what would it be? 👀
No second choices. No switching later!
👇 DROP YOUR $TICKER AND TELL US WHY YOU BELIEVE IN IT! 💎
#Crypto #Altcoins #Memecoins #100x
post-image
$SPCX My hand was steady when I hit the button. Now just looking at this number makes my palms sweat.

I got in at 127.98, up 2.27%, with 100x leverage—more than double on paper. But my eyes are glued to another line: the liquidation price is 1% from the current price. This coin was down 7.69% on yesterday’s daily candle. In other words, if I’d opened this position twelve hours later yesterday, this record wouldn’t exist.

I’ll own the entry: that night after the spot market finished dropping, 90% of the liquidation orders were longs, one by one getting carried out. I waited until they were al
SPCX+0.20%
BTC-0.65%
ETH-1.23%
  • 2
55123
Yesterday at 2 p.m.
post-image
$ZEC Surged 5.2% over the past 24 hours, with futures trading volume reaching 2.40 billion USDT. The current price is 793.300, just 1.8% below the intraday high of 808.000. For bulls to open up more upside, they must first break through the 808.000 resistance; 679.280 remains a key support level. On the 1-hour chart, the price is holding above the 21 EMA, while the RSI is hovering around 57. No clear entry signal has emerged yet, so it’s advisable to wait for candle-pattern confirmation before acting. Can buyers push the price to new highs?$ZEC $AKE $PIEVERSE

Risk warning: The above is for
post-image
ZEC+1.16%
AKE+6.07%
PIEVERSE+0.58%
The Fear & Greed Index plunged to 12, with extreme fear prevailing for eight straight days, yet BTC climbed back from $55,134. Given the current setup, should we turn greedy or keep waiting for lower entry prices? The late-night market action doesn’t lie; the answer is all written in the direction of the candlesticks.
$BTC Today traced a deep V within the $55,134–$62,181 range. $60,000 is the dividing line between bulls and bears—hold it, and the next target is around $62,000; lose it and fall back, and we’ll need to keep a close eye on the $55,134 low again. If it breaks below the previous l
post-image
BTC-0.67%
DOGE-0.22%
NEAR+1.17%
Load More

Join 40 M users in our growing community

⚡️ Join 40 M users in the crypto craze discussion

💬 Engage with your favorite top creators

👍 See what interests you

Trending Topics

BTCBreaksBelow60K

2.1M Views30K Discussing

BTC fell below $60,000 on November 20 for the first time since July, alongside a tech stock selloff and broader pressure on risk assets. Will $60K become resistance, or can BTC quickly reclaim it? What price or volume signals would convince you that selling pressure is easing?

GateDirectIPOPhase3ANTAllocates92100Shares

791.6K Views4.9K Discussing

NvidiaDropsNearly14Percent

331.6K Views7.6K Discussing

View More