Share your thoughts
placeholder
Article
$ADA Signal】Long + 1H buying support/critical turning point
$ADA 1H buying pressure share surged to 0.61, with order book imbalance of 4.91% favoring buyers, while the price moved sideways along the EMA20. 4H MACD bullish momentum is weakening, but the histogram has not turned green. The 1H Bollinger Bands narrowed to 0.2173-0.2223, indicating the turning-point window is approaching. The funding rate is 0.01%, OI is stable, and long-short fees are balanced. The current risk-reward ratio is 1.5, with a stop-loss distance of approximately 1%, keeping the cost of testing the trade controllable.
post-image
ADA+3.75%
#USELESSSurgesAnother67%
USELESS +67%: Why Insider Distribution Matters More Than Influencer Conviction for Sustainable Edge
USELESS hit $213M MC (+67%) after Bonk Guy’s call, with his position up $1.68M. But influencer conviction is often a cover for insider exit liquidity. The real edge lies in validating whether this surge is driven by organic retail absorption or merely coordinated distribution from early wallets. Here’s my validation framework. 👇
🔍 Why Distribution Topology Determines True Value
• Wallet Concentration vs. Holder Count Divergence: If market cap rises but unique holder
USELESS-6.57%
BONK+1.04%
An established privacy coin is surging, with ZEC continuing to hit new highs!
ZEC's price action in this move has been very impressive, starting from around 751 and rising sharply on heavy volume to a high of 1223, with the current price at 1183.
On the 4-hour timeframe, the Bollinger Bands have fully opened upward, with the price running along the upper band. The EMA7 and EMA30 are in a bullish alignment, making the bullish trend structure very clear.
The SKDJ indicator is currently in the high range. Although it has not yet formed a clear death cross, its readings are already in the overboug
post-image
ZEC+16.28%
$COTI
UPDATE
#COTI is getting a good bounce here. We can see 80%+ gain here ✍🏻
#COTIUSDT #COTIBTC #BTC #Bitcoin #NFTs
post-image
COTI+18.71%
BTC+0.42%
This wave was purely driven by good market sentiment—I casually tossed out some coins, and one just happened to land on my head. When I opened the chart this morning, I saw $HYPE still grinding around 83.212. Support had held, and volume had not deteriorated. I judged this to be the entry point and called for a long position.

And the result? The current price has already reached 87.632, and my account directly spit out a juicy +375.11% gain. The brothers on board should have woken up laughing. It was truly sluggish at first, but the breakout feels just as good.

The market is won by waitin
post-image
HYPE+4.77%
SOL+4.10%
DOGE+4.47%
SUSHI went from 0.2003 to 0.2828 in just one day, with a 21% range. But note that the volume on the dump from the high was more than twice the volume at the start of the rally. There is only one explanation for this order book: pushing the price up to rotate positions, with the cost basis around 0.23 and trapped holders all the way above. Look at the $150 million trading volume—retail traders don't have that kind of appetite; it's all wash trading to make you buy in.
Don't panic. There is weekly support at 0.2475 now. If you're aggressive, enter with a small position, set a stop-loss at 0.2310
SUSHI+24.24%
#Gate用户突破6000万,来 My Gate Journey
60 Million Users — And My Gate Journey
Reaching 60 million users worldwide is not just a number; it represents millions of individual journeys, first trades, mistakes, lessons, excitement, and unforgettable moments.
My own journey with Gate has been full of learning and experiences. I still remember the feeling of making my first trade—watching the chart move up and down, checking the price again and again, and wondering whether I had made the right decision.
Of course, not every trade went according to plan. There were moments when the market surprised me,
With this trend, I don't even need to think—the account is dancing on its own.

A few days ago, I already felt that $DGAI was acting strangely before going to bed. The rebound was weak, but the pullback wasn't deep either—a typical situation where both bulls and bears were waiting for direction. When it kept oscillating intraday, I said that when a position is compressed to the extreme, either nothing happens or, once it breaks, it makes a big move. I entered directly at 0.6959 and waited for the wind.

When I checked this morning, wow—it had surged straight to 0.7903, +267.29%. Those on boa
post-image
DGAI+0.96%
ZEC+16.28%
ADA+3.75%
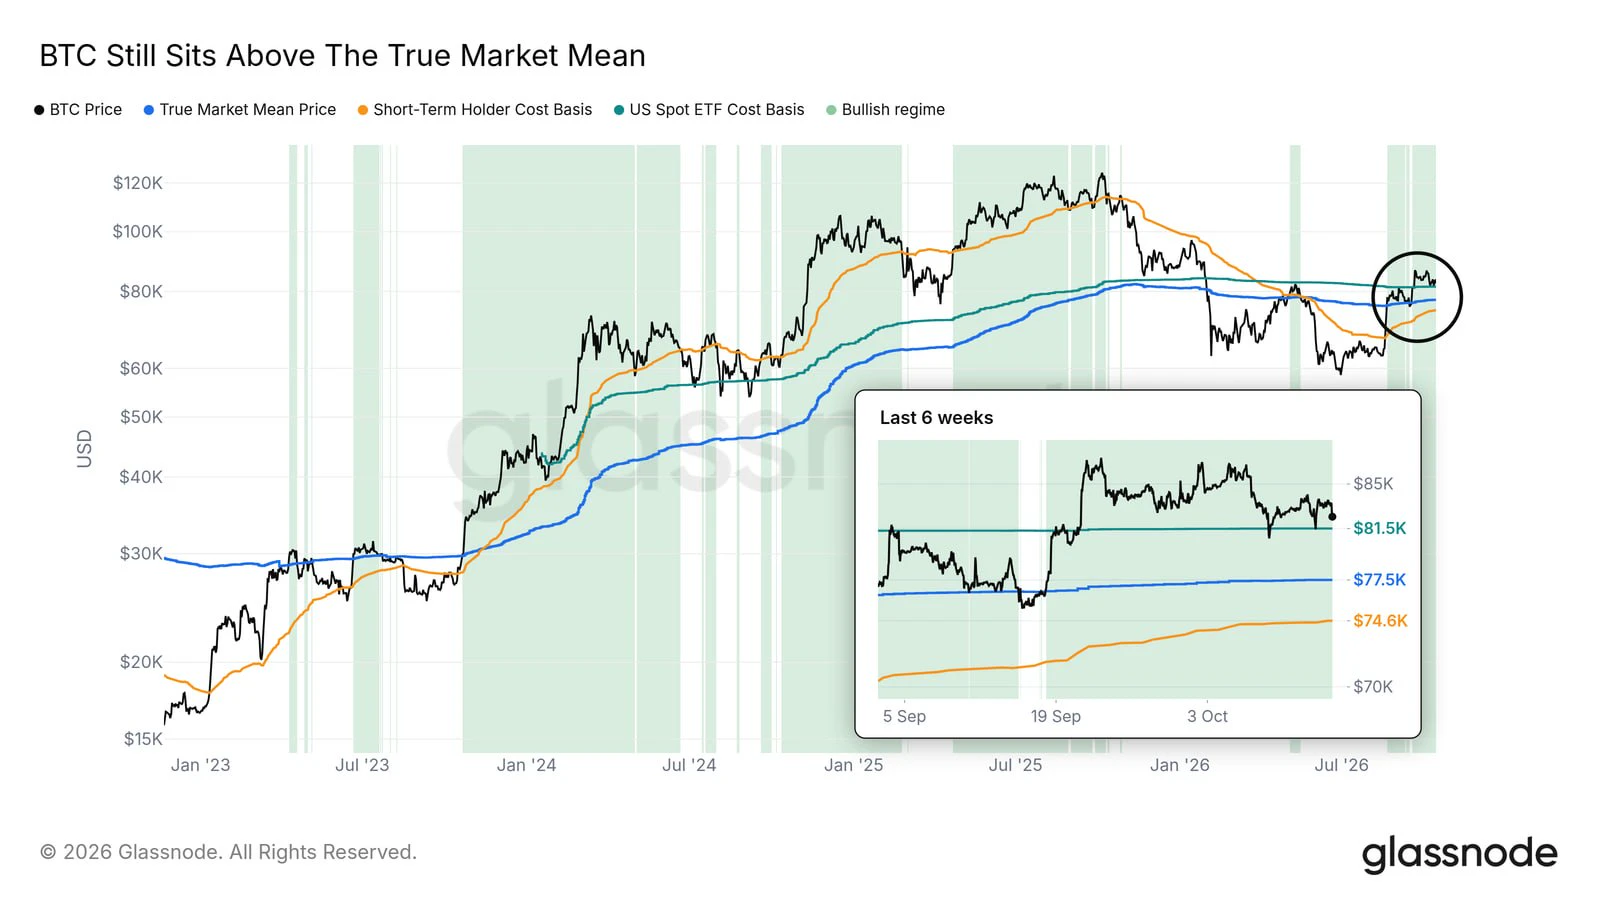
BITCOIN IS BACK AROUND $80,000
post-image
BTC+0.42%
$7 UNI: are you chasing the rally or sitting it out?
Look at the surface first: it has gone parabolic, but is starting to pull back.
From the $2.3-$3 lows in early June, UNI has produced a steep primary uptrend. It has risen 30-50% over the past week and more than 70% over the past month, touching an intraday high of $7.48 today before falling back to around $7. The weekly chart has just broken above and confirmed the upper boundary of the 4.90 mid-term range, and the mid-term target of 7.56 has already been reached. Daily RSI has surged to around 80, while MACD momentum is slowing—the trend i
post-image
BTC+0.42%
ETH+1.97%
UNI+13.04%
Everyone’s still calling ZEC bullish—but the 4H tape just whispered a secret nobody heard yet.

$ZEC /USDT - SHORT

Trade Plan:
Entry: 1164.47 – 1178.43
SL: 1258.51
TP1: 1106.15
TP2: 1062.62
TP3: 997.32

Why this setup?
Why now? Your 1D trend says "up," but that’s the trap. The 4H structure is flipping SHORT with 84% confidence while price stalls at 1171.45—right under that 1178.43 rejection zone. RSI on the 15m is cooling at 56.6, meaning buyers are losing steam, not gaining it. ATR of 27.9 on the 1H shows volatility is ripe for a snap. Targets aren’t dreams: TP1 at 1106.15, TP2 at 1062.62
ZEC+16.28%
Everyone’s waiting for SUI to break out—but the 4H chart is quietly setting a trap for late longs.

$SUI /USDT - SHORT

Trade Plan:
Entry: 0.7973 – 0.8021
SL: 0.8224
TP1: 0.7826
TP2: 0.7713
TP3: 0.7542

Why this setup?
Why now?
- 1D trend is *range*—no momentum to push higher.
- RSI on 15m is cooling at 55, losing upside steam.
- ATR (0.0095) shows tight, indecisive candles—breakouts are failing.
- Entry zone 0.797–0.802 is exactly where sellers stepped in last cycle.
- SHORT bias (55% conf) targets TP1 at 0.7826, then TP2 at 0.7713—a clean 3.5% drop from here.

Debate:
Is SUI fa
SUI+2.29%
Why is everyone watching $ETH /USDT at 2500 while the 4h chart whispers something they’re ignoring?

$ETH /USDT - SHORT

Trade Plan:
Entry: 2497.87 – 2503.81
SL: 2529.35
TP1: 2479.46
TP2: 2465.20
TP3: 2443.82

Why this setup?
- 1D is stuck in a range—no breakout fuel, so mean reversion is the game.
- 4h bias flips SHORT at 55 confidence, but 15m RSI at 54.3 says sellers haven’t taken control yet.
- ATR 1h at ~11.88 means tight risk: entry 2500.84, SL 2529.35 (only 1.1% away).
- The “why now” is the rejection zone—price is stalling under 2503.81, and TP1 at 2479.46 is a magnet if momen
ETH+1.97%
I was just about to head to the forum and rant, but then I saw my balance and thought better of it—the market is always right. When the whole screen was glowing green, our short positions not only didn’t panic, they actually gave us a big chunk of meat.

The structure was crystal clear at the time: a weak rebound, mounting selling pressure, and after grinding around for ages, it still couldn’t even touch the key level. This kind of move usually ends with a breakdown. So I simply went with the momentum and opened a short at 1.4798. It has now dropped straight to 1.4203, with unrealized gains o
post-image
ADA+3.75%
LAB-1.79%
This house attracts romantic luck—where is it located?
post-image
Everyone’s watching $BTC /USDT pump—but the 4h tape just whispered a secret that most retail will ignore.

$BTC /USDT - SHORT

Trade Plan:
Entry: 79886.1 – 79995.7
SL: 80467.4
TP1: 79546.0
TP2: 79282.8
TP3: 78888.0

Why this setup?
- Price is stuck at **79,940** with a hard ceiling overhead.
- 1D is *range*, not breakout—so this isn’t momentum; it’s a trap zone.
- RSI (15m) at 57 shows weak bounce fuel, while ATR (1h) = 219 means volatility is compressing before a snap.
- Short setup targets **79,546 → 79,282** before the real air pocket at **78,888**.
- Why now? The clock is tickin
BTC+0.42%
Protocol 27: Pi Network’s “Infrastructure Completion Day”
On August 11, 2026, the Protocol 26 mainnet upgrade was completed.
This upgrade was not optional—nodes that failed to update by the deadline would be disconnected. Officially, for most people, the update would take only a few minutes. After it was completed, the team advanced the testnet to Protocol 27 and gave a clear target date: September 15, 2026.
The team also said something crucial: Protocol 27 is the last planned protocol upgrade in the current roadmap.
This is not “just another small patch.” It is the conclusion of this upgrade
post-image
PI+0.17%
XLM+2.01%
RWA+0.35%
ONDO+2.77%
Pons delivers 150x returns
live-cover
LIVE1,908
Load More

Join 40 M users in our growing community

⚡️ Join 40 M users in the crypto craze discussion

💬 Engage with your favorite top creators

👍 See what interests you

View More