Square
Following
Hot
News
Notifications
Profile
Share your thoughts
placeholder
Article
#USCPIDataIncoming

US CPI Data Incoming: One Inflation Report Could Shift Bitcoin, Stocks and Gold

The Waiting Game

Imagine waking up on Tuesday morning, checking the financial markets, and seeing Bitcoin moving sharply while gold and U.S. stocks react in different directions. Nothing unusual may have happened overnight. The reason could be one important economic report: U.S. Consumer Price Index (CPI).

Investors are preparing for the October CPI report, scheduled for November 10, 2026, at 8:30 a.m. Eastern Time. This release matters because inflation influences interest rate decisions, b
post-image
BTC-0.67%
$AKE This spike to 0.0066 couldn’t hold, and the price has started to pull back. It has now fallen below the 7-day moving average and is also under pressure below the 25-day moving average. Overhead selling pressure is heavy, buying is not keeping up, and trading volume has shrunk. Bulls are running out of steam, and the price is likely to keep falling. Go short! ⬇️⬇️
post-image
AKE+6.07%
Trenches
ZIG
Z
bade
b
ZIG
0x8c...1145
Market Cap
$.
Change
.
24h Vol
$.
Holders
.
STONK
S
bade
b
STONK
6GmA...UNgx
Market Cap
$.
Change
.
24h Vol
$.
Holders
.
IDOL
I
bade
b
IDOL
0x3b...ab07
Market Cap
$.
Change
.
24h Vol
$.
Holders
.
BTC
B
bade
b
BTC
C5xp...pump
Market Cap
$.
Change
.
24h Vol
$.
Holders
.
FLOAT
F
bade
b
FLOAT
Bv1a...BMmr
Market Cap
$.
Change
.
24h Vol
$.
Holders
.
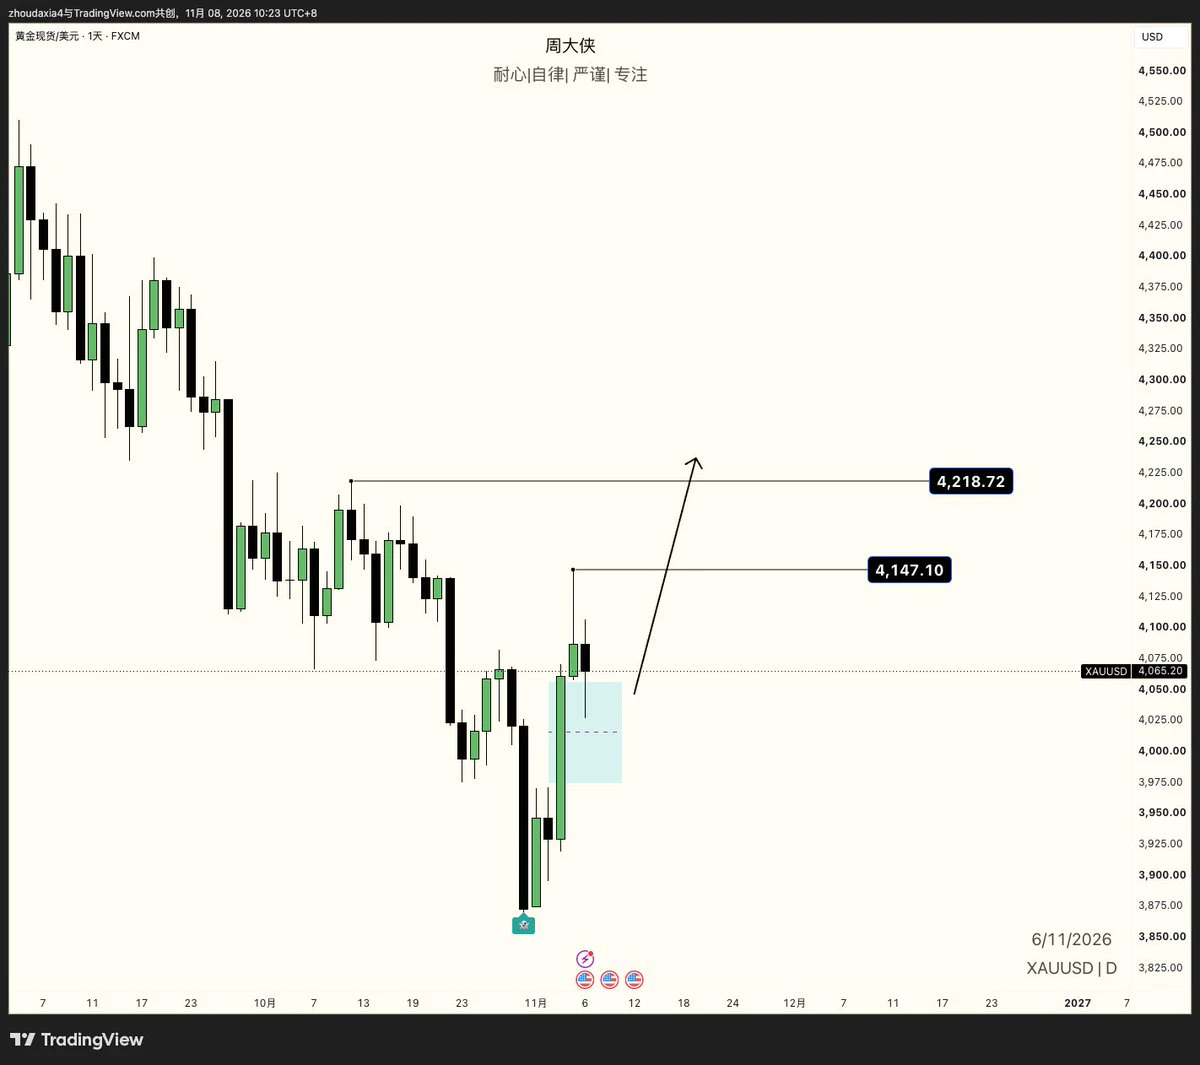
Gold daily chart bullish bias vs. weekly chart bearish bias. #XAU
post-image
GLDX-0.40%
PAXG+0.37%
XAU+0.38%
  • 1
$AIN saw an $8.03K long liquidation near $0.1401, highlighting downside pressure as leveraged buyers were forced out. This could represent a liquidity sweep, but buyers need to defend demand and reclaim the previous breakdown area. Until then, the short-term structure remains cautious.
Support: $0.1370 – $0.1340
Resistance: $0.1430 – $0.1470
Next Target: $0.1520
Confirmation: A strong reclaim above $0.1430 could indicate buyers are returning. Losing $0.1340 would increase bearish continuation risk.
Let's go $AIN 🚀
post-image
AIN+3.85%
Support and resistance levels are among the most fundamental and practical concepts in technical analysis. Many traders study candlesticks and indicators every day, yet overlook an important question: at which price levels are buying and selling pressure likely to shift?
First, a support level is an area where buying pressure may increase as the price falls. When the price approaches this level, some buyers may start entering the market, slowing the decline. But a support level does not mean the price definitely won’t break below it.
Next, a resistance level is an area where selling pressure m
BTC-0.67%
morning market update
live-cover
LIVE1,046
$PI Cut your losses; the great waves wash away the sand and reveal gold too
post-image
PI-0.60%
  • 3
#Ahr999EntersBottomBuyingZone
The Ahr999 index has dropped back below 0.45.
As of November 7–8, 2026, the reading sits around **0.43**, placing Bitcoin firmly in the historical “bottom-fishing” or accumulation zone for the first time since late August. Bitcoin itself is trading near **$75,000–$76,000**, down sharply from recent levels amid broader risk-off pressure from the AI-stock selloff.

This is not a casual signal. For long-term Bitcoin accumulators, especially those who use dollar-cost averaging with a timing overlay, Ahr999 crossing back under 0.45 has historically marked periods of d
BTC-0.67%
  • 7
  • 1
$ENA is showing signs of selling pressure after a $10.27K long liquidation near $0.15359. This flush could create an opportunity for buyers if price stabilizes and reclaims short-term market structure. Watch for a bullish CHoCH, demand-zone reaction, and increasing buying volume before considering continuation.
Support: $0.1500 – $0.1470
Resistance: $0.1570 – $0.1620
Next Target: $0.1680
Confirmation: Reclaiming $0.1570 with strong volume could shift momentum toward higher liquidity. Failure to hold support may extend the downside.
Let's go $ENA 🚀
post-image
ENA+8.04%
How Much Should You Lose on a Single Trade? Scientifically Managing Risk Is Key to Long-Term, Consistent Profits!

In cryptocurrency futures trading, many people spend every day studying when BTC will rise or fall, yet rarely take the time to calculate one thing: if this trade goes against them, how much can they actually afford to lose?

In fact, in long-term trading, predicting direction is only part of the equation. Risk management is what determines whether an account can survive over time.

First, set your risk per trade in advance. You can use 1% of your account balance as the risk budge
post-image
BTC-0.65%
#USAIStocksHitHard #ShareWeekly
USAIStocksHitHard: AI Stocks Face a Sharp Market Correction
Introduction
The artificial intelligence sector has become one of the most influential drivers of the global stock market. From semiconductor manufacturers to cloud computing companies and AI software developers, investors have placed significant expectations on AI-driven growth. However, recent selling pressure has highlighted how quickly sentiment can change when valuations become stretched and uncertainty increases.
Why Are AI Stocks Facing Heavy Selling?
Several factors can contribute to a sharp de
post-image
Let's see how many fish have slipped through the cracks of nine-year compulsory education.
post-image
#Ahr999EntersBottomBuyingZone

AHR999 Drops Below 0.45: Bitcoin Enters a Historically Important Bottom-Buying Zone

The Market Has Reached an Important Point

Imagine watching Bitcoin trade around $80,000, then seeing its price move lower while a long-term valuation indicator enters a historically important zone. You might wonder whether the market is approaching a major turning point or simply experiencing another correction.

That is the situation surrounding the AHR999 indicator on November 8, 2026. Its latest reported reading is approximately 0.429, placing Bitcoin inside the historically
post-image
BTC-0.67%
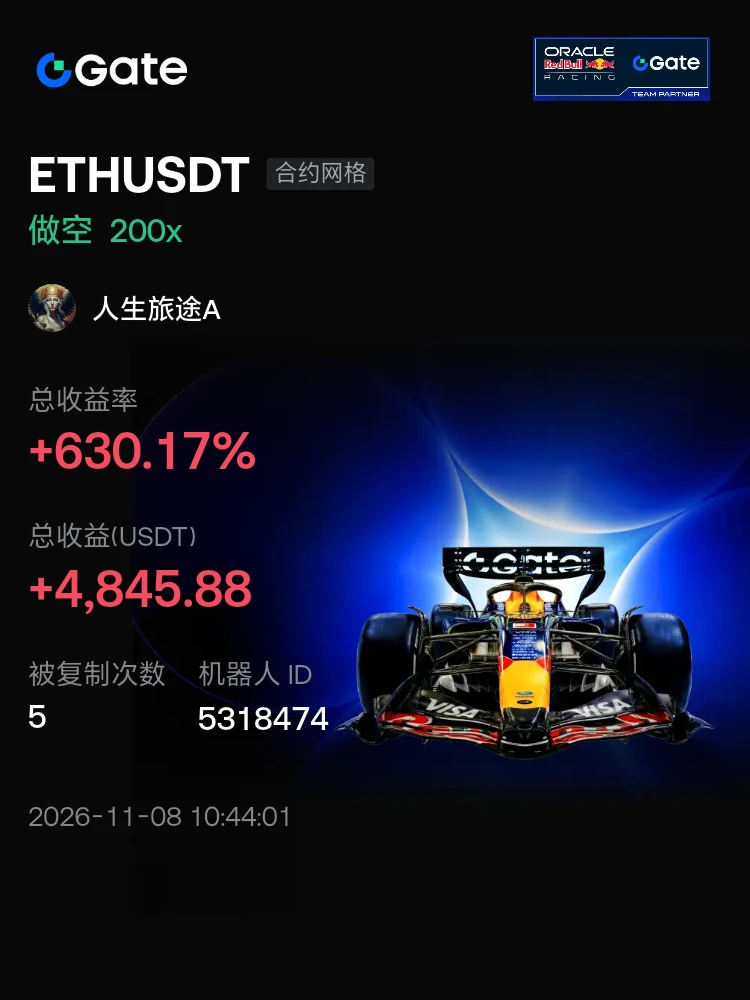
#交易机器人 I'm using the ETHUSDT contract grid bot on Gate—come copy my trades
post-image
🔹 Former FBI Agent Admits Stealing $2.47 Million in Cryptocurrency, Faces Up to 20 Years in Prison
live-cover
LIVE784
Couldn't sleep this morning, so I bought 5000u worth of $koma to play with
post-image
KOMA-3.91%
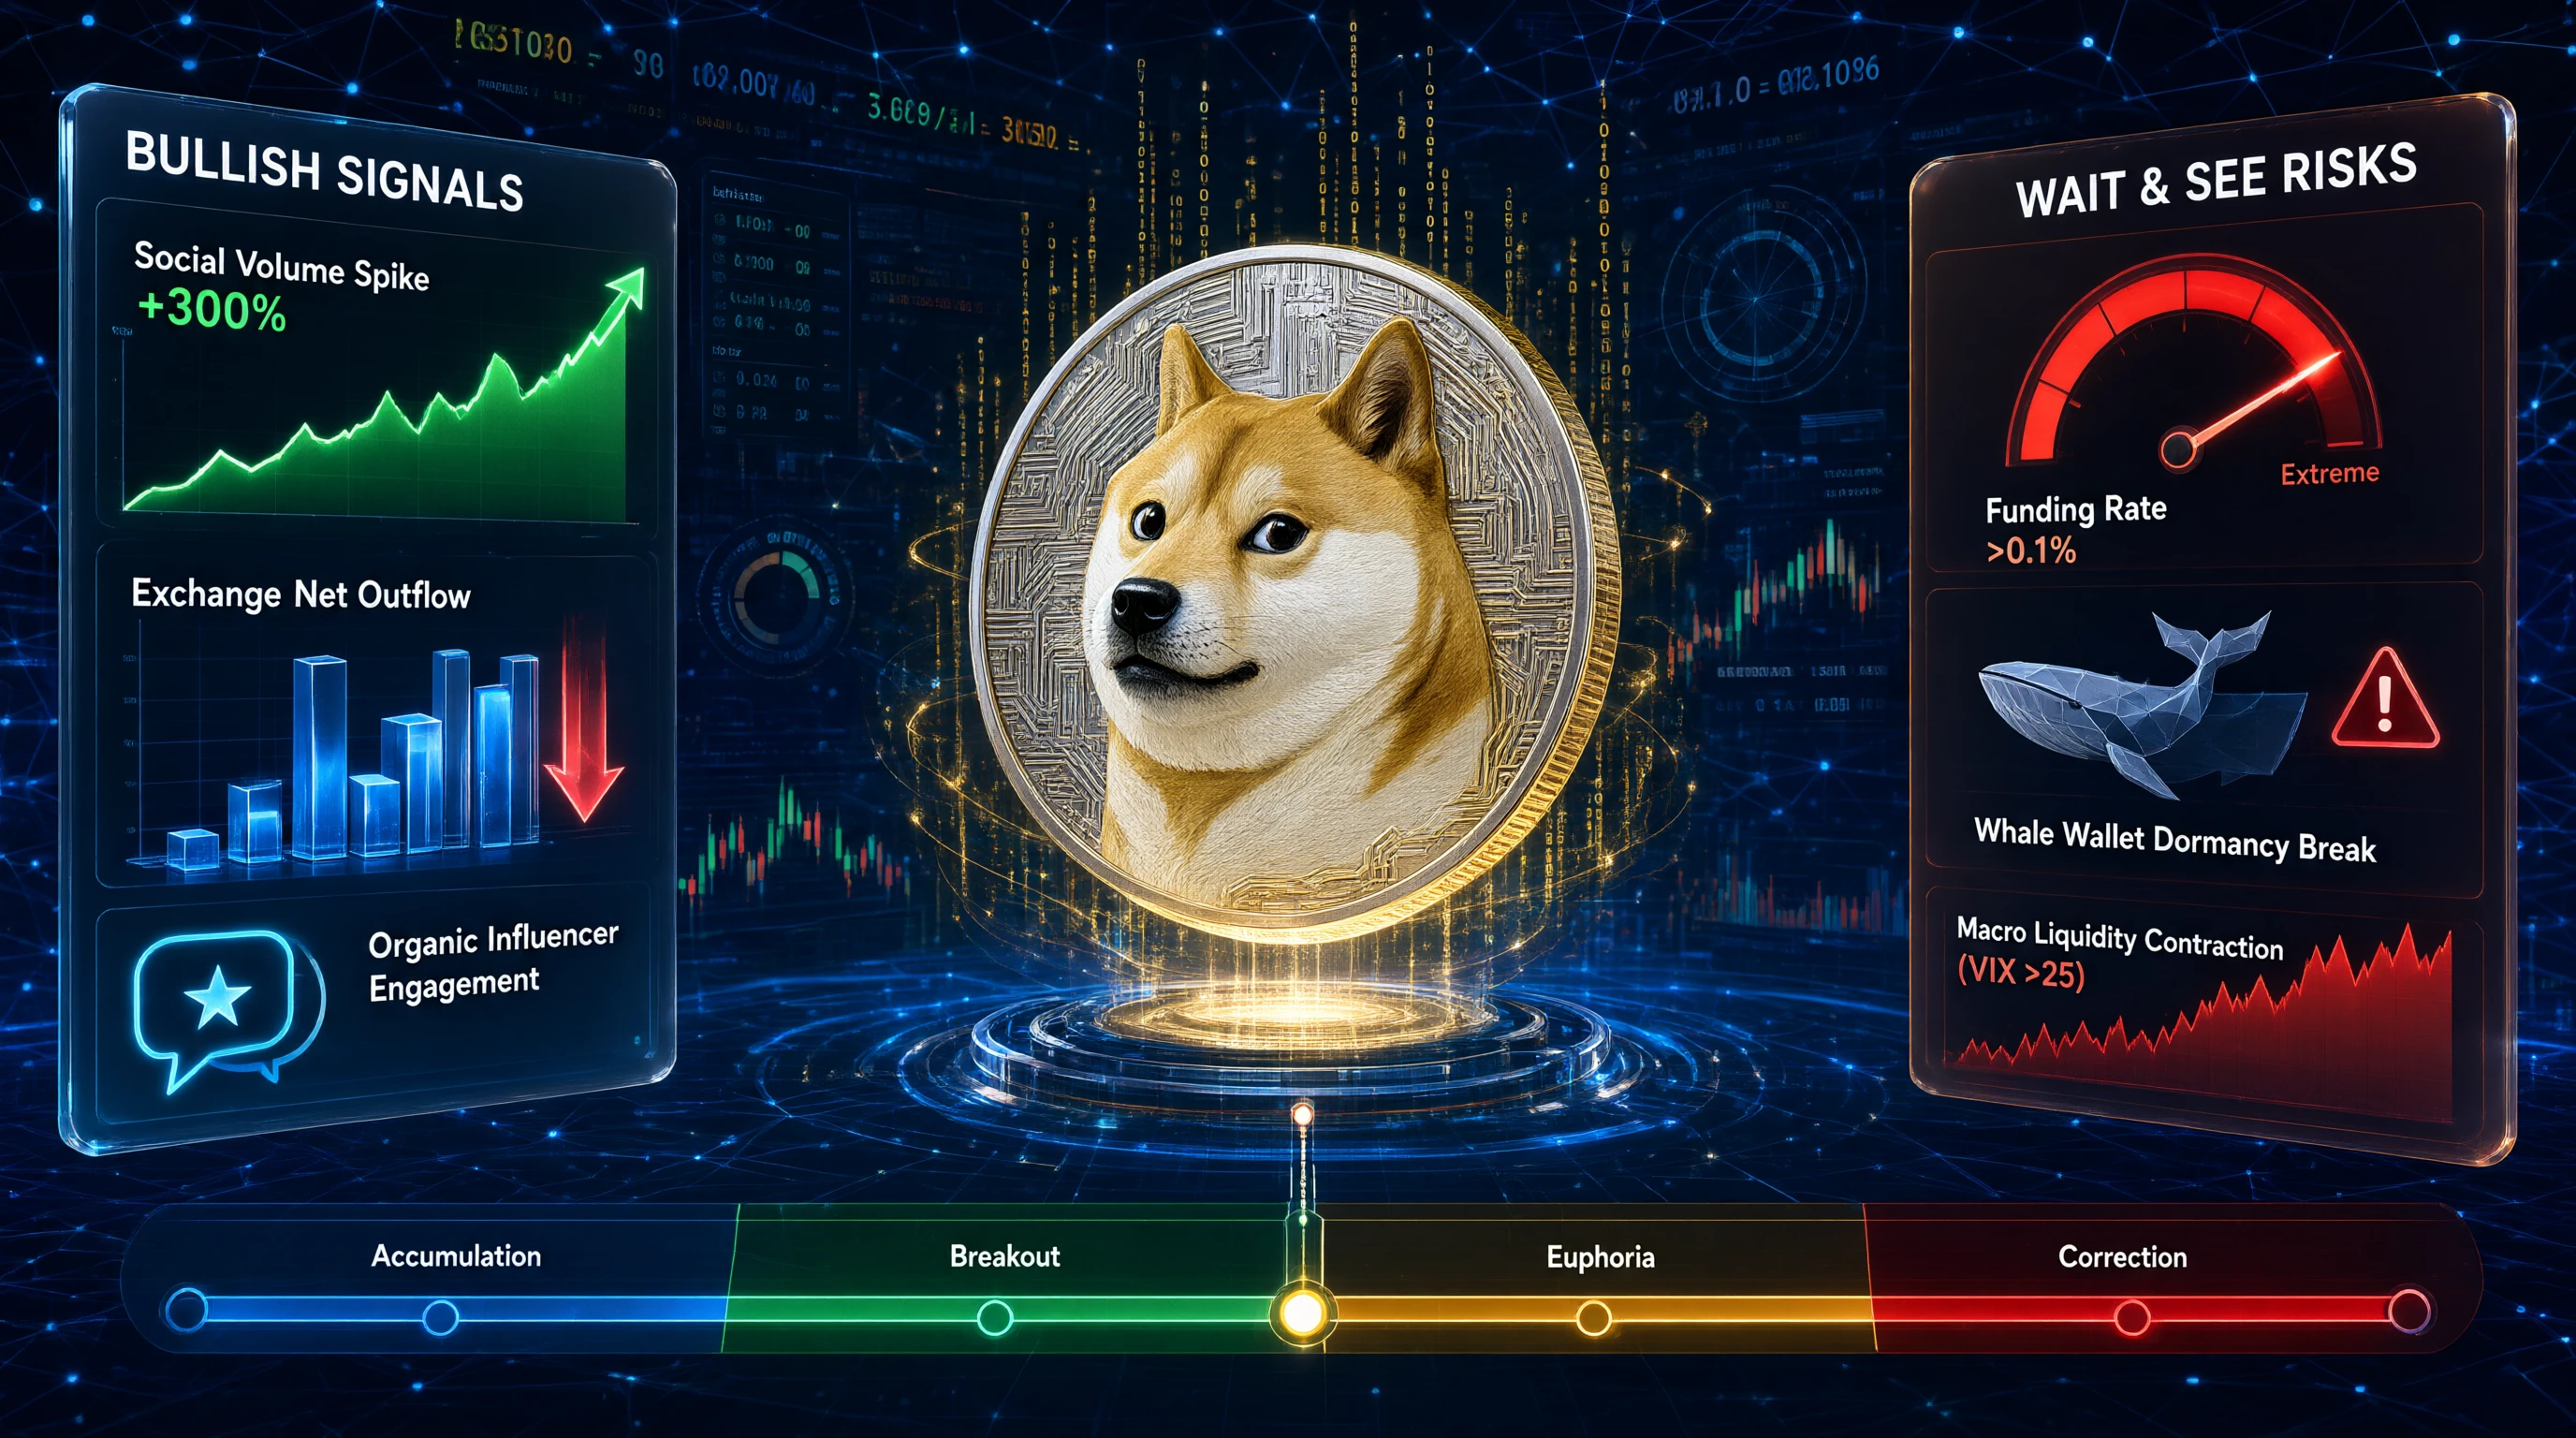
Applying traditional equity analysis to $DOGE is a category error; this asset operates on meme economics, not fundamental valuation.

The question of bullish signals for Dogecoin cannot be answered through discounted cash flow models or balance sheet scrutiny. $DOGE is the world’s most liquid meme asset, and its price discovery mechanism is driven entirely by social sentiment, celebrity influence, and speculative liquidity cycles. Treating it as a company fundamentally misaligns your analytical framework with market reality. Success requires evaluating cultural momentum, on-chain activity patt
post-image
DOGE-0.18%
  • 3
  • 2
Apparently, this is the fifth-generation housing currently being piloted in China.
Many traders expect a price pullback after BTC rises, hoping to get a better entry. But a retest is not always an opportunity; sometimes it can also signal that a downtrend is resuming. The key is to determine whether support is holding and whether the overall market trend remains healthy.
First, assess the strength of support. If a price area has repeatedly seen rebounds in the past, it may indicate strong buying demand there. When the price returns to this area, watch closely to see whether buyers step in again.
Second, watch for changes in trading volume. If volume gradually declines as the
BTC-0.67%
The first earthquake of magnitude 5 or higher in Aichi Prefecture, Japan, since 1997
We all know that tectonic plates drift and pressure in the Earth’s crust builds up slowly over many years; earthquakes generally don’t happen easily,
but when one does occur, it may be a precursor to an even larger earthquake.
Does this mean a major wave of earthquakes is coming,
including the Nankai Trough megathrust earthquake—the one Japanese people fear most, which has been forecast for over 30 years—
Is it finally coming?
post-image
Load More

Join 40 M users in our growing community

⚡️ Join 40 M users in the crypto craze discussion

💬 Engage with your favorite top creators

👍 See what interests you

Trending Topics

USCPIDataIncoming

1.04k Views1.47k Discussing

The U.S. October CPI report will be released on November 10 at 8:30 a.m. ET. September CPI came in at 3.7% year over year, and markets will be watching closely for signs that inflation is cooling, especially in core CPI. A softer-than-expected reading could strengthen rate-cut expectations, while hotter inflation may pressure risk assets through higher Treasury yields and a stronger dollar. How do you think this CPI print will move $BTC, U.S. stocks and gold?

USAIStocksHitHard

23.56k Views3.69k Discussing

USNonfarmPayrolls

40.34k Views4.38k Discussing

View More