
Square
Following
Hot
News
Profile
Share your thoughts
placeholder
Article
$CHZ CHZUSDT Reversal Potential Breakout & Fibonacci Retest
The price is moving within a descending channel on the 1-hour timeframe; it has reached the lower boundary and is poised for a rebound, suggesting a potential upward move upon retesting this level.
The Relative Strength Index (RSI) indicates a bearish trend, but an upward breakout is likely due to oversold conditions on the 1-hour chart.
An orange trend line supports the potential upward rebound.
There is initial support at 0.01396, acting as a primary support zone.
A key support zone (marked in green) exists at 0.01372; the price has
post-image
CHZ-3.80%
What should we do, lets know
live-cover
LIVE290
$NIL NIL/USD – Bounce From Local Lows, +52% Target
NIL/USD has been pulling back from its highs for several weeks, reaching a local bottom near ~0.0750. Price is now recovering and showing early signs of strength, with momentum building toward the upside.
A continuation of the current move targets the ~0.1350 resistance zone, representing a gain of approximately 52% from current levels.
post-image
NIL+21.69%
$ONDO ONDO: Sharp Pullback Tests the Bullish Breakout
ONDO has again failed to overcome the $0.62–$0.70 weekly resistance zone. Price briefly moved above the 0.786 Fibonacci level at $0.5979 before reversing sharply, highlighting strong overhead supply.
The earlier break above $0.44 marked a bullish change of character and improved the weekly structure. Price has now returned to this former resistance area, making the next reaction important for the recovery.
ONDO also broke above its 50-week EMA, which sits near $0.44. Price has tested support at this moving average, but buyers still need to
post-image
ONDO-4.27%
$XLM XLMUSDT: Trendline Bounce Setup, Next Leg Toward 0.2937
Stellar pulled back right into its rising trendline on the daily. Now we wait for the bounce to prove itself.
Fundamentals: Stellar is an open-source network for fast, low-cost transfers of value across currencies and assets. Market cap is $6.46B against a $9.20B FDV, with 70% of supply circulating. Chain TVL is up 3.6% over 30 days to $243.7M while price is down 3.5%, and perp funding is slightly negative at -0.0106% per 8h.
XLM technicals:
Right now price sits at 0.1839, on the rising trendline that has held every dip since the b
post-image
XLM-3.90%
#微策略两周回购3.69亿美元STRC
Strategy’s $369 Million STRC Repurchase in Two Weeks: A Major Development for Crypto Market Watchers?
The cryptocurrency market continues to evolve as Strategy, formerly known as MicroStrategy, draws attention for its reported $369 million repurchase of STRC over a two-week period. The development puts the spotlight on corporate financing, preferred-stock management, and the relationship between traditional capital markets and the Bitcoin ecosystem.
For crypto enthusiasts and market analysts, the key question is not simply how much was repurchased, but what this move coul
post-image
MSTR-5.89%
STRC-0.10%
BTC-1.76%
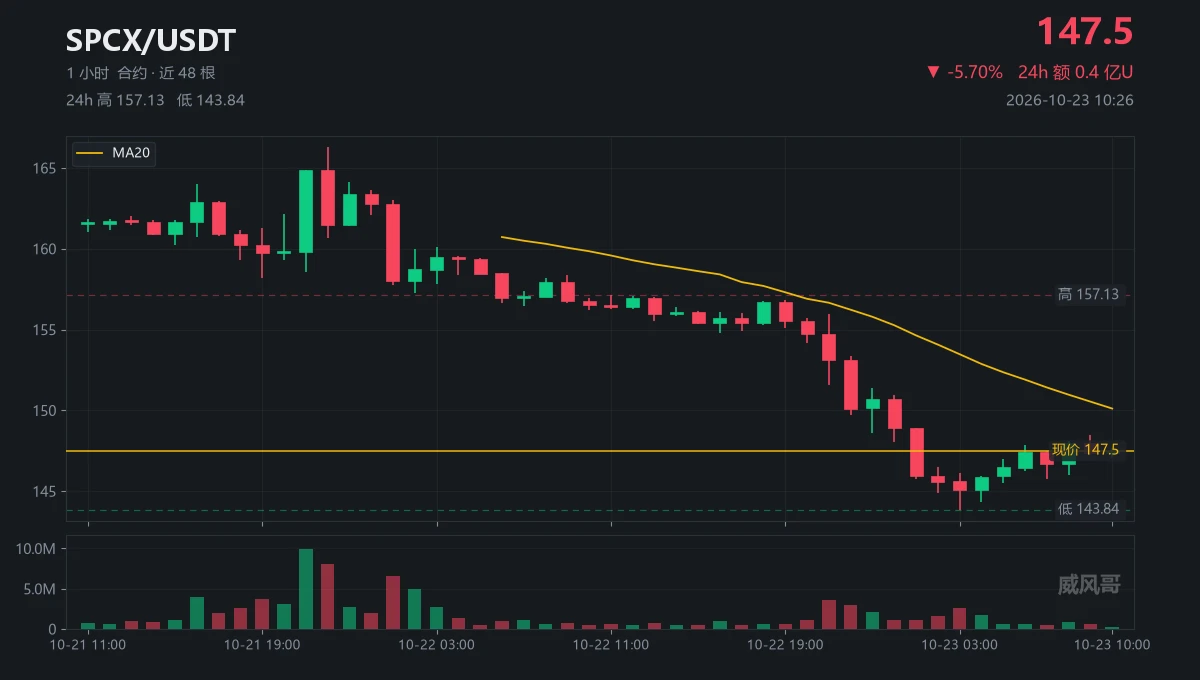
Nobody is talking about the quiet move forming in SKHY right now.

$SKHY /USDT - LONG

Trade Plan:
Entry: 147.22 – 148.14
SL: 141.95
TP1: 151.98
TP2: 154.84
TP3: 159.14

Why this setup?
Why now? The 1h price sits at 147.66 inside a tight entry zone between 147.22 and 148.14, giving us a precise risk-defined long. The 15m RSI at 37.18 shows room for upside before overbought, while the 1h ATR of 1.836923 tells us the current volatility is small enough to expect a sharp expansion toward the target. The daily trend being a range means this breakout attempt is the key event, with TP1 at 151.98 a
SKHY-7.35%
Boom first 2 days back from the challenge we’re sitting at 2k > 26k
Gonna run this up to 7 figs all public
Still 100% win rate
Been fun doing this gonna bless a follower there
post-image
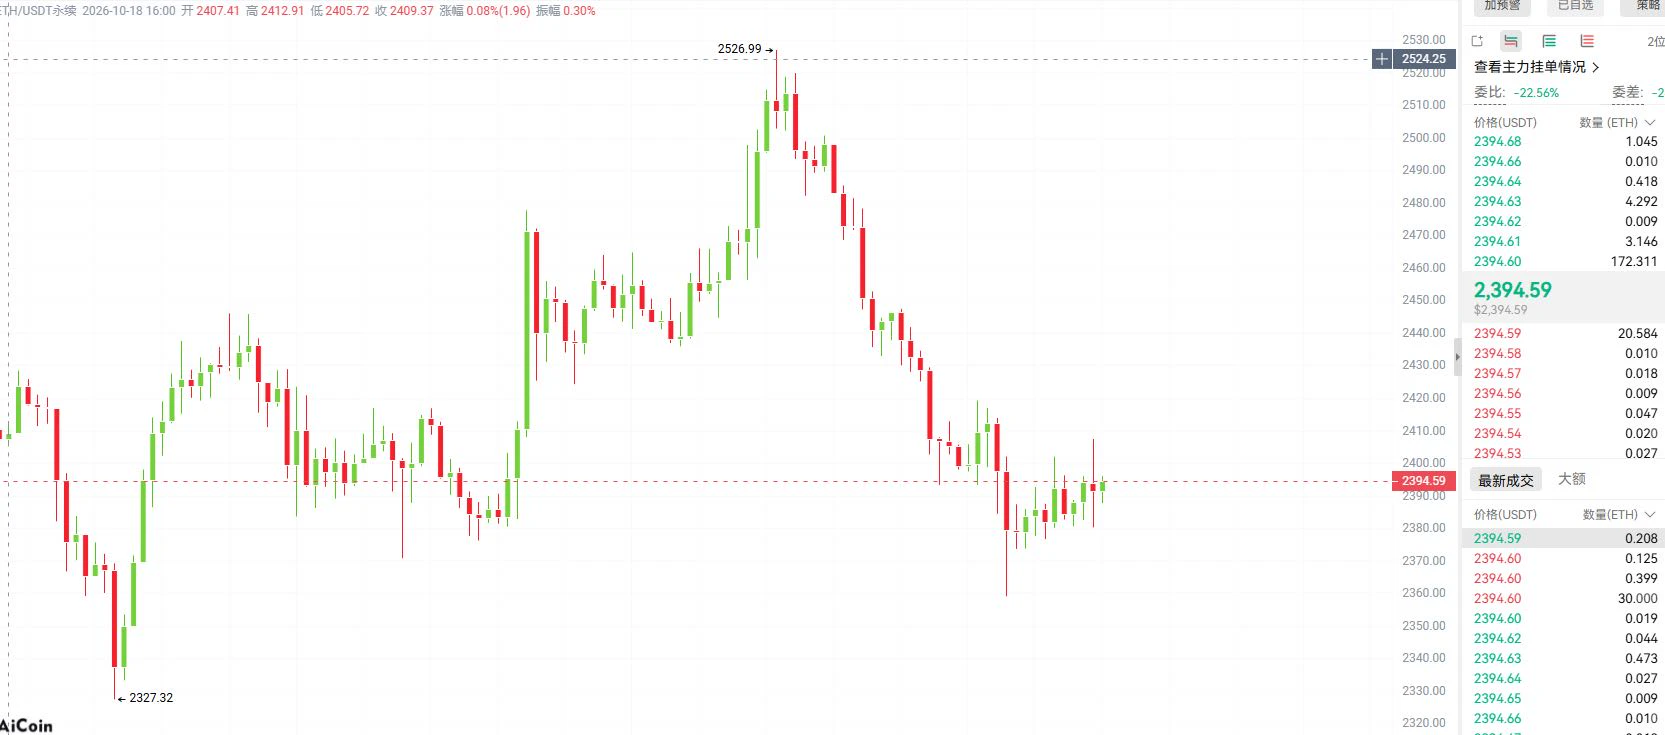
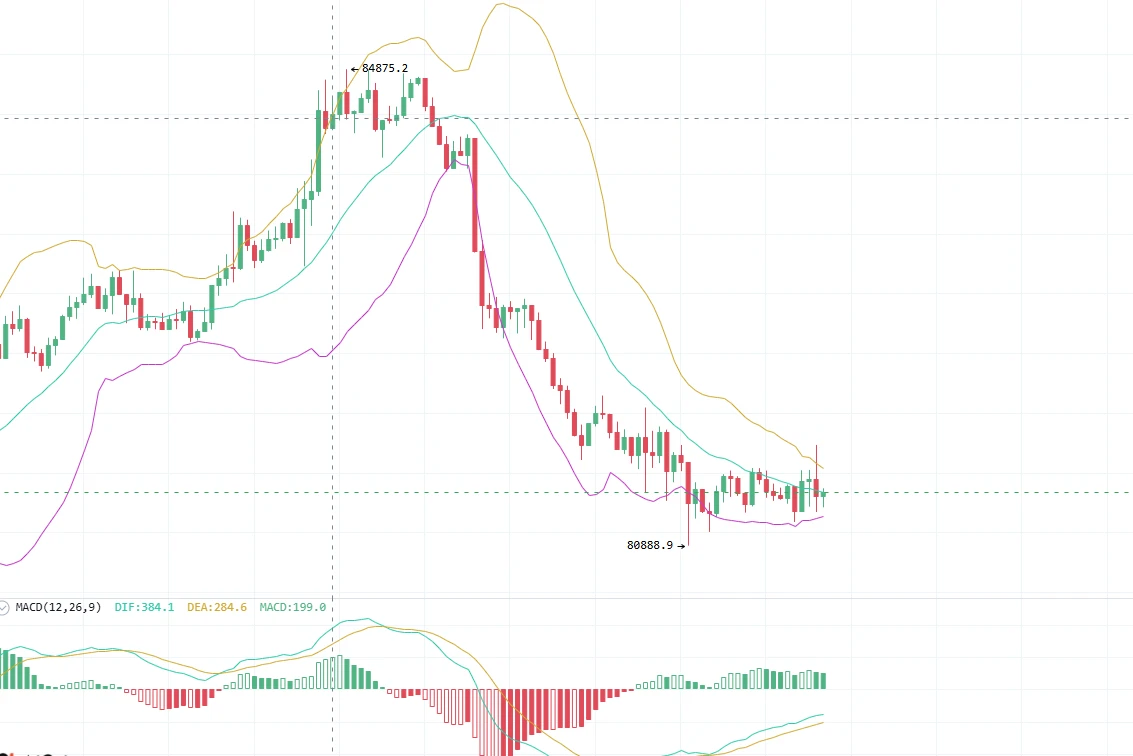
CPI wrapped up successfully, with profits fully realized across BTC, ETH, ZEC, and multiple other coins!
The pressure at 84000 for BTC was repeatedly highlighted. We seized the rebound opportunities for three consecutive shorts and secured three straight wins. The first position was opened when the rebound reached 84000, banking 15kU; before CPI was released, we continued to short from high levels on the second trade, and as the market quickly dipped after the data was released, we banked 16kU; after CPI was released and the rebound reached the 83000 resistance level, we followed the trend and
BTC-1.79%
$NIL Current price 0.08774, 24h +13.95%, trading volume 7.1M USDT, MA5=0.083038 crossed above MA20=0.079258, RSI=70.8, MACD histogram +0.00111, funding rate -0.0070%. During the same period, $ENA fell 7.65% and $SNXXB
fell 12.45%; against a backdrop of broad declines across the sector, NIL bucked the trend with rising volume and a higher close, showing clear relative strength—this is the key reason it deserves separate attention: the negative funding rate means shorts are still paying, while the price has risen above the upper Bollinger Band around 0.0858, indicating a short-squeeze structu
post-image
NIL+21.75%
ENA-7.15%
$S S Analysis (1W)
Trade active
Price dropped by more than 90%, then surged over 180% after hitting the green demand zone.
post-image
S-6.81%
GOLD FT BTC
live-cover
LIVE297
Spot the trillion dollar man @JoelKatz
post-image
#ndx Support for the 29 region is currently on the brink; if it blows, oh no, oh no
post-image
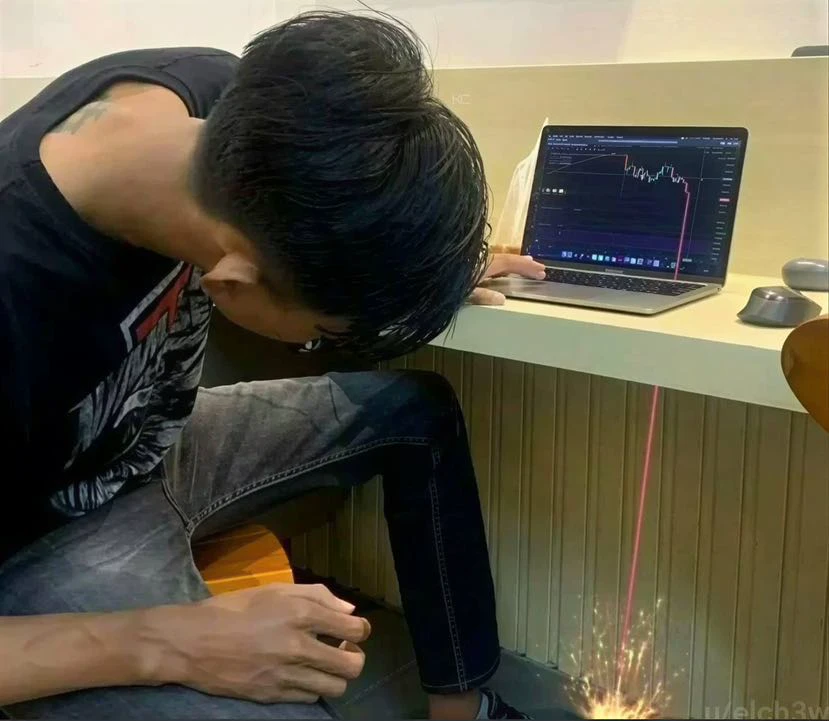
JUST IN: 🇺🇸 $1 trillion wiped out from the US stock market today.
post-image
$PUMP enters the oversold zone; a rebound and bottoming are two different things
$PUMP 24 hours -5.06%, current price 0.004766. The 1-hour and 4-hour RSI are 33 and 30, respectively. Oversold conditions create demand for a rebound, but a rebound only shows that the decline was sharp; bottoming still requires the price to stop breaking down the structure.
Let’s pull the camera back to the 24-hour range: low 0.004659, high 0.005138. Where does the current price of 0.004766 sit within this range? That will directly affect the meaning of the same signal. Near the high, strength must prove it is no
post-image
PUMP-5.39%
September CPI data came in above expectations, and markets are trying to digest this surprise. Headline inflation rose to 3.7% year-over-year, surpassing the 3.6% forecast. Core inflation also climbed to 2.6% year-over-year, exceeding the 2.5% estimate. On a monthly basis, core inflation rose by 0.3%, coming in higher than expected.
Following the data release, the probability of the Fed raising interest rates at its October meeting nearly doubled in a single day. According to the CME FedWatch tool, this probability rose to 43.7% after the announcement, up from 22% prior to the data. Although s
post-image
BTC-1.76%
ETH-3.28%
IBIT-1.91%
US500-1.14%
NAS100-2.08%
  • 1
Load More

Join 40 M users in our growing community

⚡️ Join 40 M users in the crypto craze discussion

💬 Engage with your favorite top creators

👍 See what interests you

Trending Topics

USSeptemberCPITopsEstimates

35.73k Views2.27k Discussing

US September CPI rose 3.7% YoY, above the 3.6% estimate; core CPI rose 2.6%, also above the 2.5% estimate. With inflation topping forecasts across the board, how will rate hike expectations shift? How will BTC react? Share your view.

DrLinHanSpeaksAtOxfordUnion

135.1k Views1.85k Discussing

GateWCTCS9GlobalTradingCompetition

37.42k Views6.12k Discussing

View More