Square
Following
Hot
News
Notifications
Profile
Share your thoughts
placeholder
Article
🔹 BNB Surpasses 540 USDT with a Narrowed 4.43 Decrease in 24 Hours
live-cover
LIVE2,390
BTC-0.67%
ETH-1.26%
ZEC+1.16%
SOL-0.77%
USDC+0.01%
11.22
Manual market monitoring has its limits; quantitative trading never tires.
Alpha Quant Alpha Quant
AI-powered algorithms + multidimensional risk management
Automatically capture global market opportunities 24 hours a day
Eliminate subjective emotions and human greed and fear
Replace human judgment with professional computing power
Give every trade a basis in data, strategy support, and risk management safeguards
Steady compounding, systematic arbitrage, and sustainable long-term returns!
post-image
Trenches
IDOL
I
bade
b
IDOL
0x3b...ab07
Market Cap
$.
Change
.
24h Vol
$.
Holders
.
JAGENT
J
bade
b
JAGENT
0x8e...ae15
Market Cap
$.
Change
.
24h Vol
$.
Holders
.
PIEVERSE
P
bade
b
PIEVERSE
0x0e...25a9
Market Cap
$.
Change
.
24h Vol
$.
Holders
.
CLAUDIA
C
bade
b
CLAUDIA
2j5S...W2ZM
Market Cap
$.
Change
.
24h Vol
$.
Holders
.
mihao
m
bade
b
mihao
4Cxj...pump
Market Cap
$.
Change
.
24h Vol
$.
Holders
.
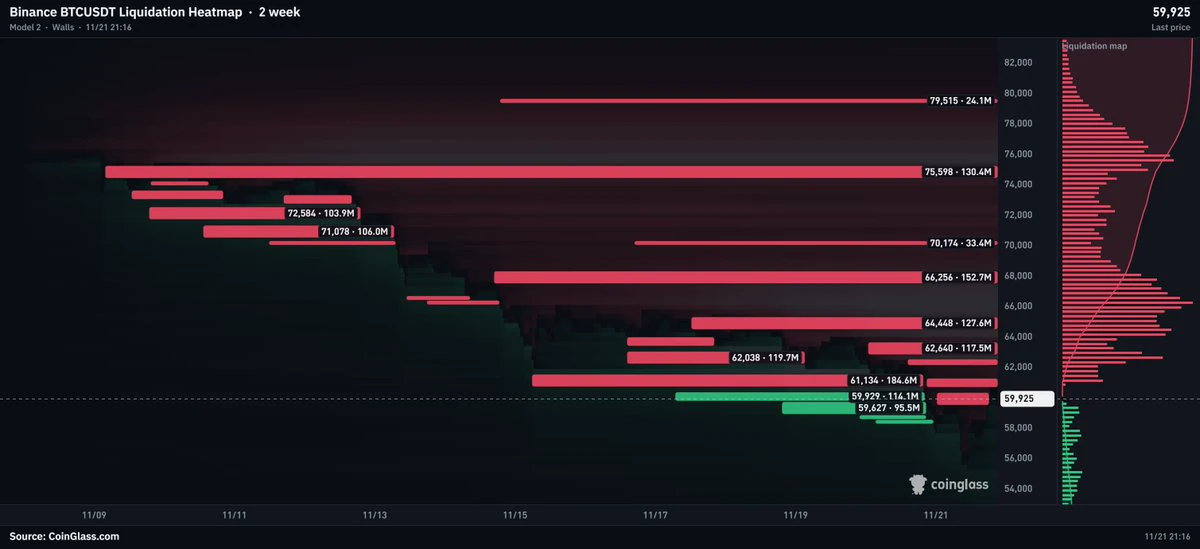
Another pleasant weekend is about to end. Just thinking about the market opening again tomorrow instantly takes away half the relaxation. Open this latest liquidation heatmap: before the market opens tomorrow, the big players’ playbook is already laid out in plain sight. Don’t charge in foolishly!

$BTC The current price is 59750, stuck awkwardly in the middle. Looking up, the green glow around 61000 is glaring—short positions are lined up there. But look further down: between 58500 and 59000, long positions are piled up as thick as a fortress wall. What does that mean? The big players have pl
BTC-0.65%
ETH-1.23%
SOL-0.74%
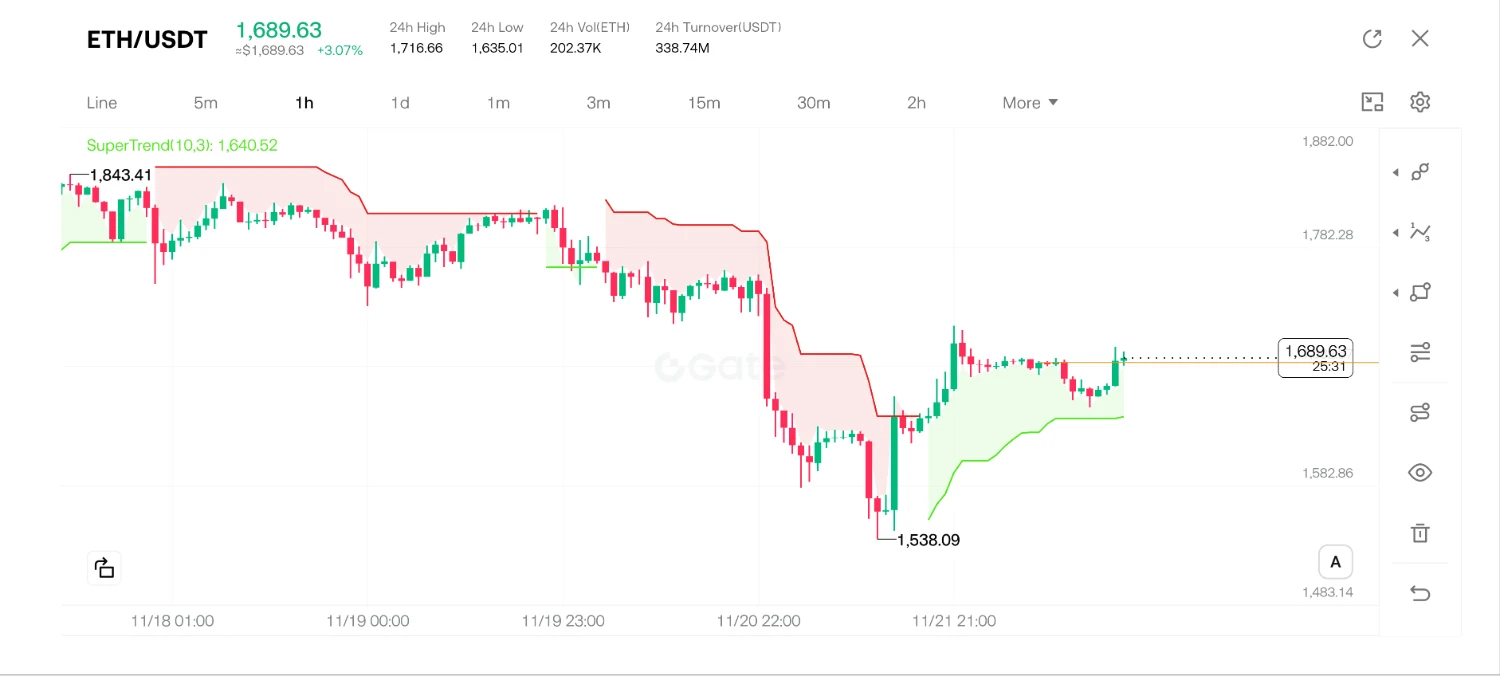
$ETH This rebound is actually worth discussing

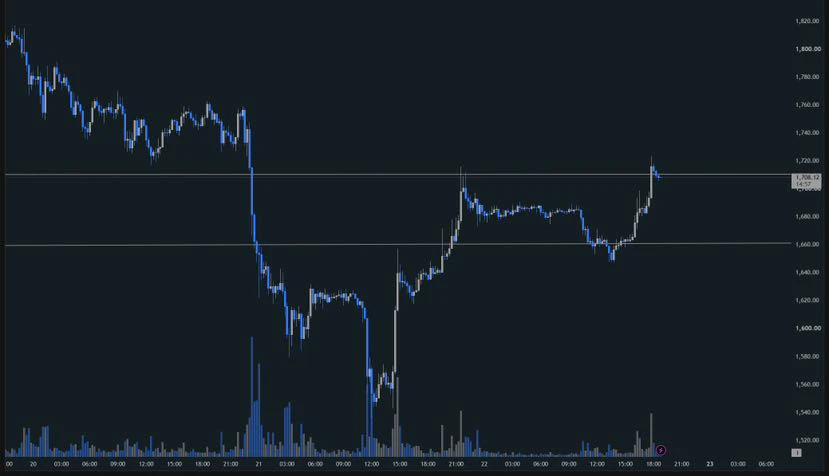
The price bottomed at 1536 over the weekend, then rebounded steadily and climbed back above 1700. On price action alone, it looks pretty good

But I’m more focused on the E/B exchange rate:

It’s still hovering around 0.028. While it hasn’t continued to break below key levels along with the broader market, it also hasn’t made any particularly clear independent move higher;

Meanwhile, ETH contract open interest is still significantly lower than it was a few days ago

That’s interesting: the price has recovered quickly, but leveraged funds haven’t
post-image
ETH-1.26%
  • 1
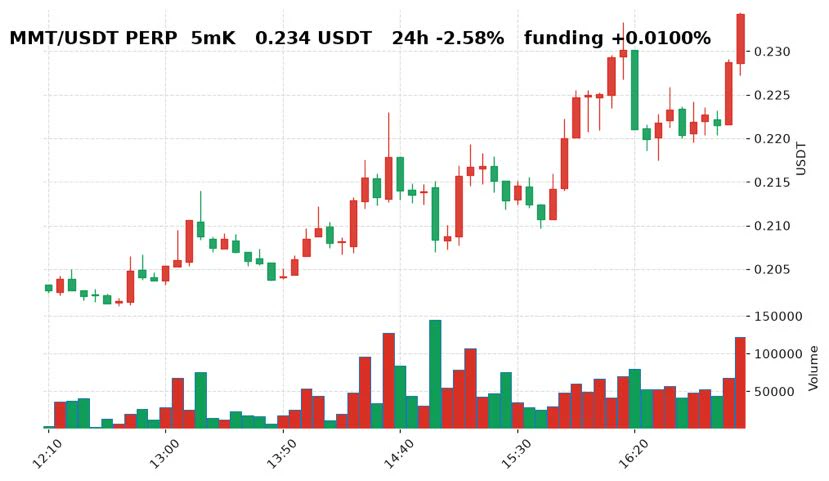
Sneaking a peek while slacking off at work, $MMT ‌ up 6.0% in 5 minutes, current price 0.234. I’m working on my tendency to get carried away, so today I’ll just note it and not act~ Contract funding rate +0.0100%; I’m staying away from leverage. Are you watching tomorrow? A: Watch, B: Sleep. With my small position, I’m going to sleep first #摸鱼看盘
post-image
MMT-3.20%
  • 2
$ETH ‌ will close above 1685.68 today.
post-image
ETH-1.26%
BTC Fall below 60k
live-cover
LIVE1,894
BTC-0.67%
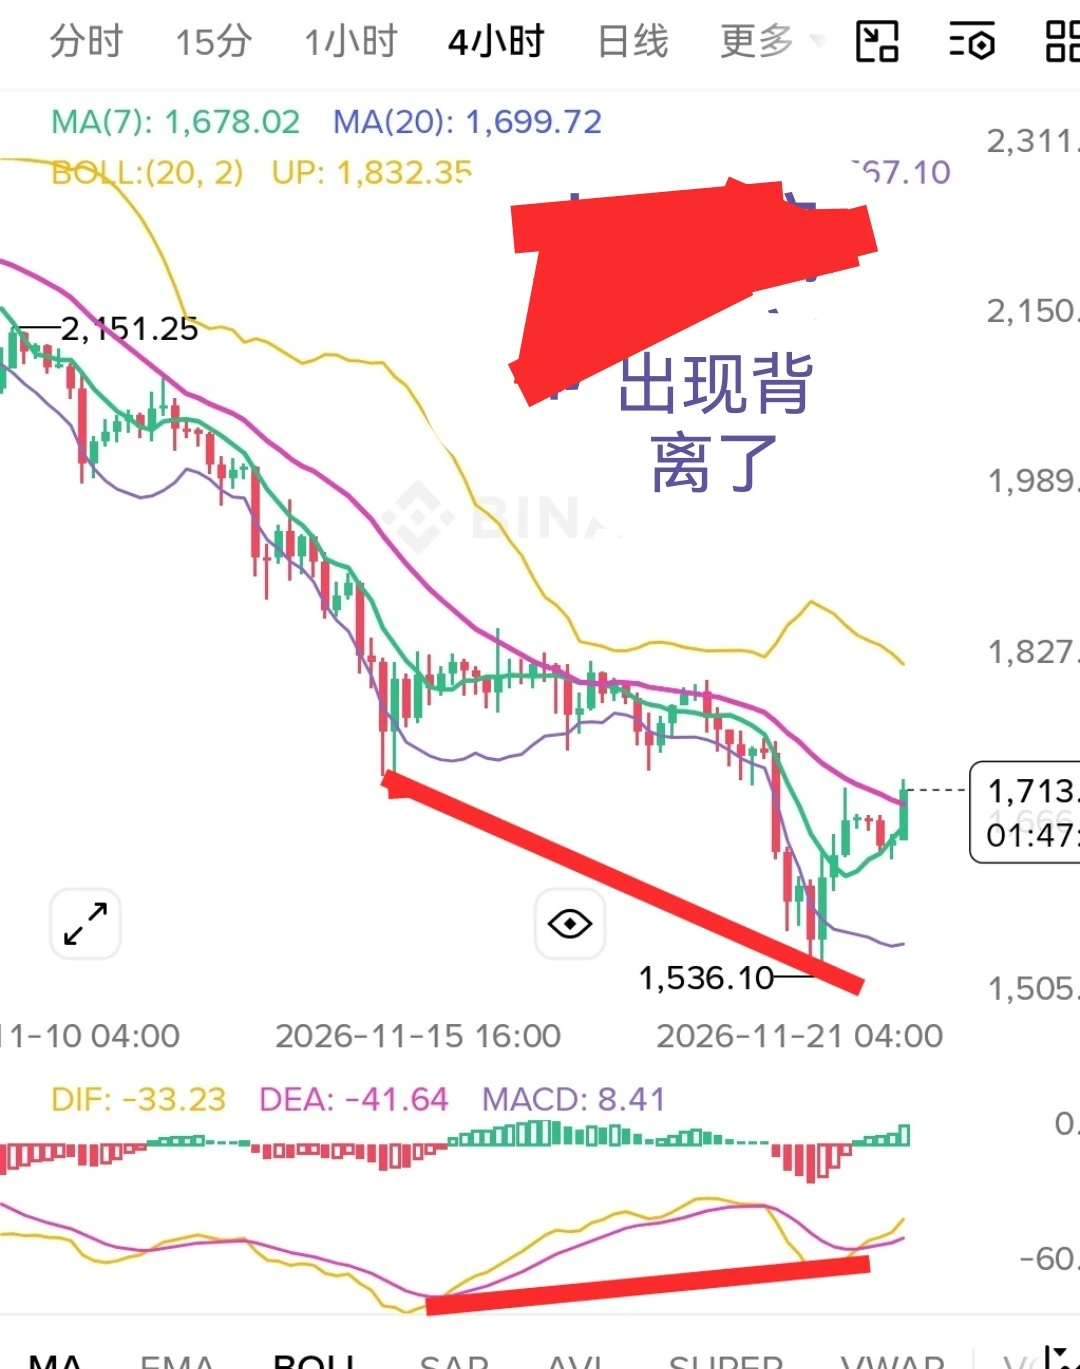
ETH has formed a divergence on the 4-hour timeframe. Could it turn bullish?
post-image
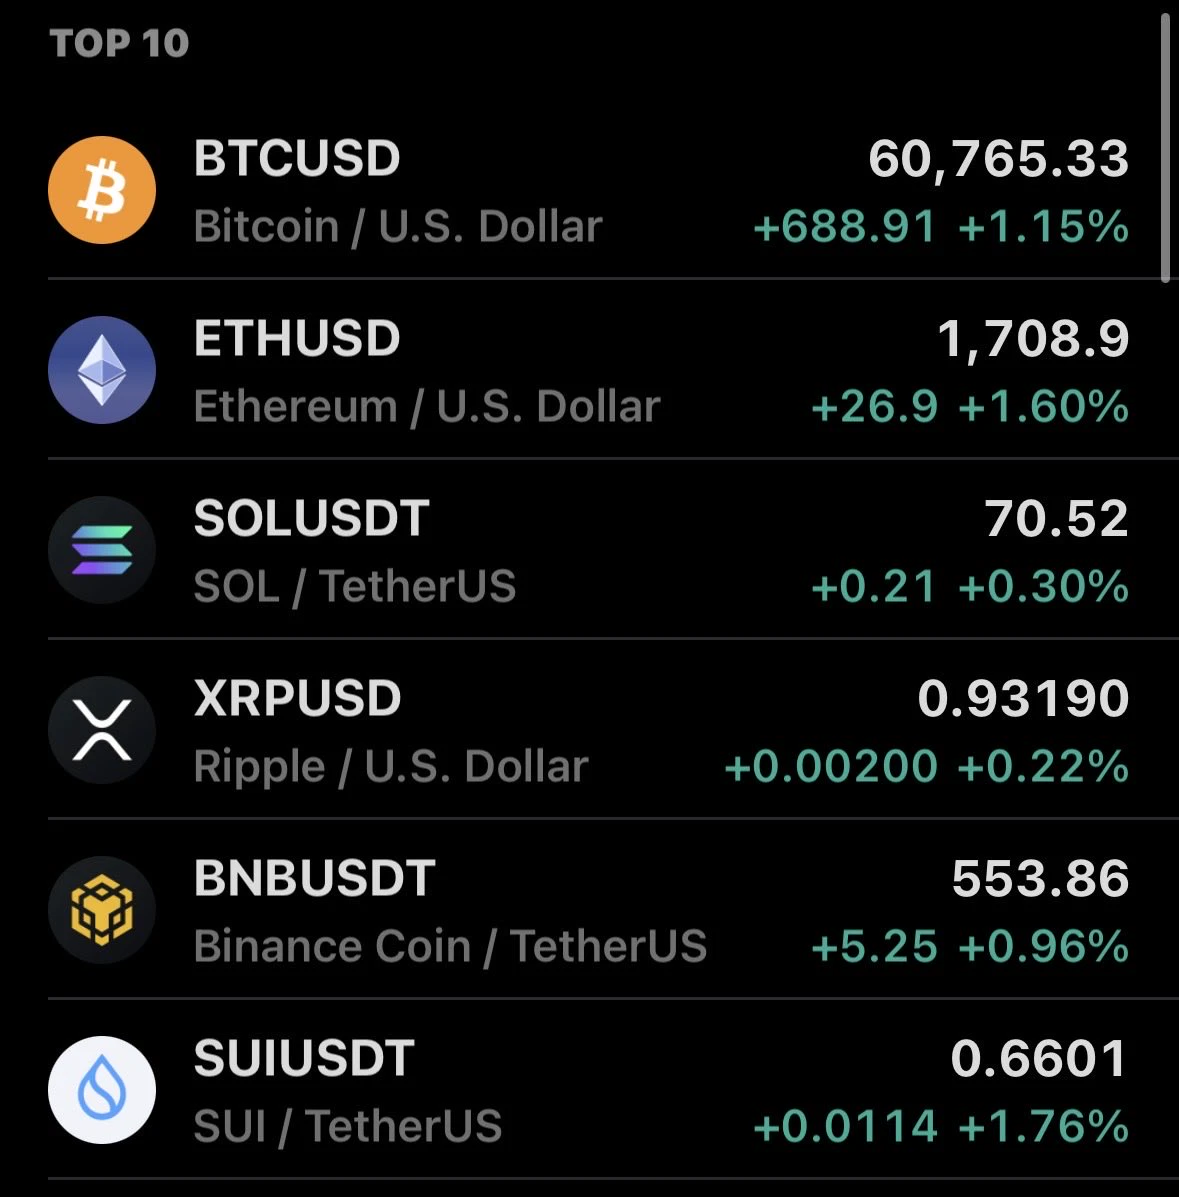
Not sold on this move just yet to be honest
I would rather wait to see what market opens look like
Anyone going long here ??
ripple:native sui:native bitcoin:native ethereum:native solana:So11111111111111111111111111111111111111112
post-image
SUI-1.05%
BTC-0.67%
ETH-1.26%
SOL-0.77%
gSunday chat <3
Back tomorrow.
post-image
$BTC longs have been flushed, while over $700M in liquidation liquidity is stacked between $61K and $66K.
The fuel is now above the current price. A short squeeze could drive the next major move higher.
post-image
BTC-0.65%
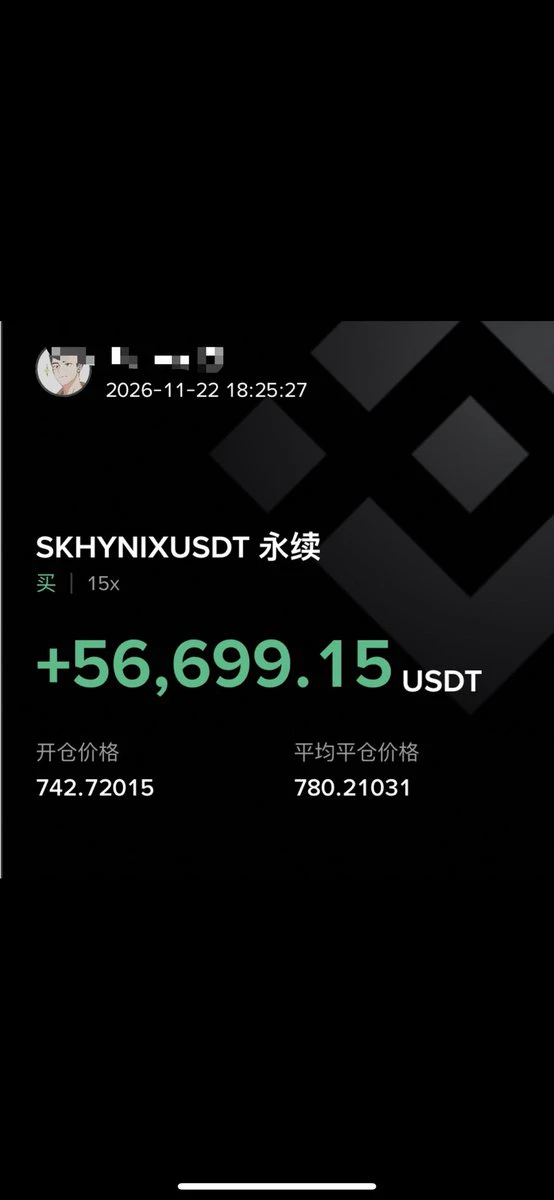
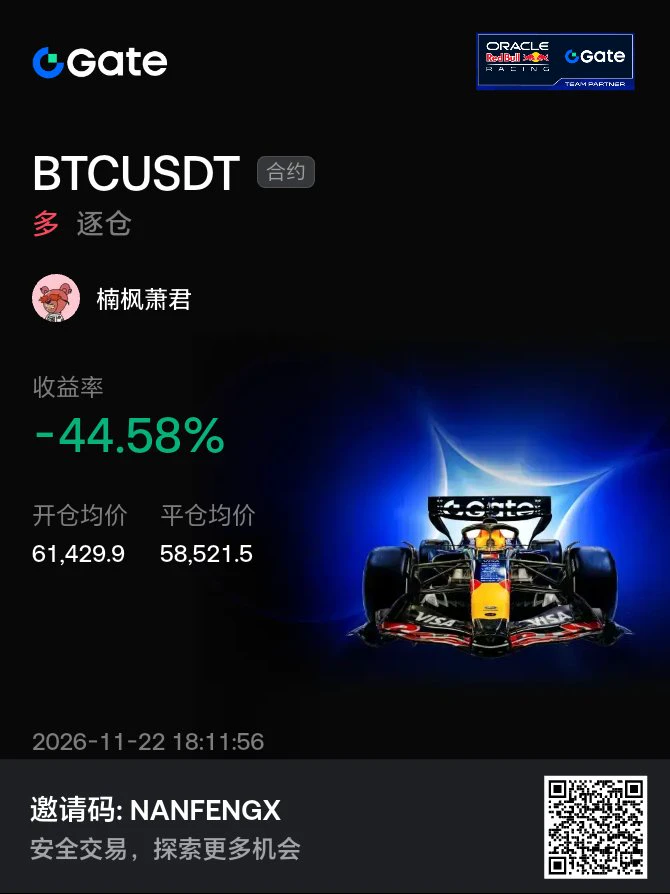
I feel like this trade was executed perfectly
post-image
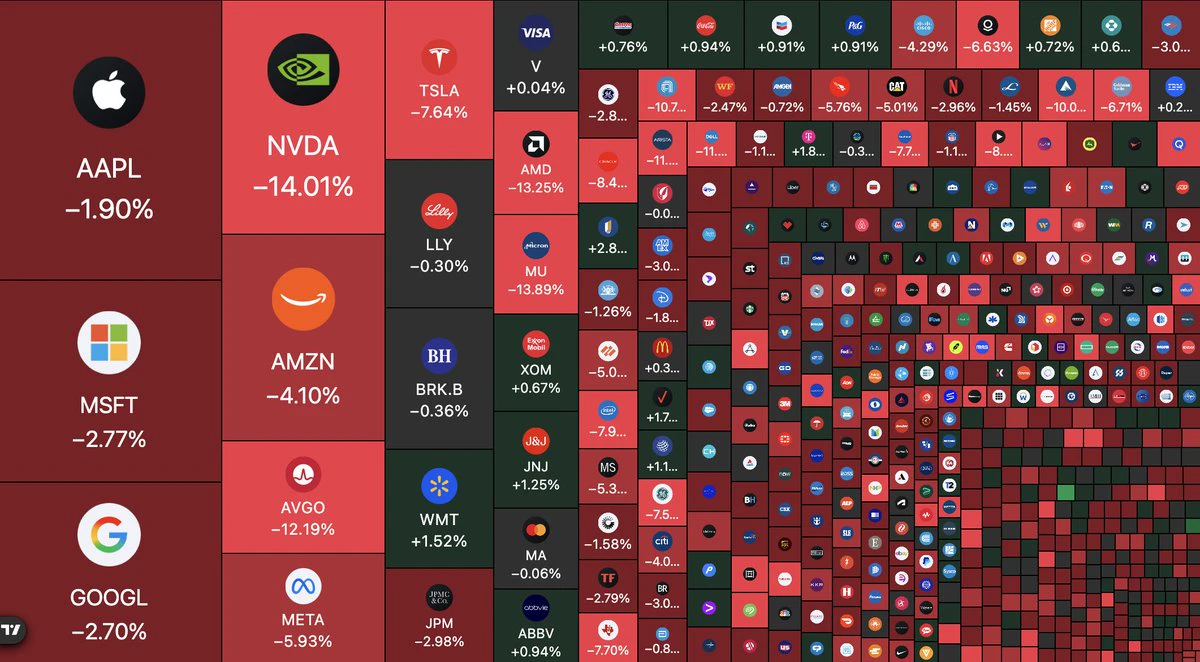
🚨 OVER $4 TRILLION WIPED OUT FROM THE NASDAQ
Nvidia $NVDA fell 14%
AMD $AMD dropped 13.25%
Tesla $TSLA lost 7.64%
The entire market is bleeding.
post-image
NVDA-13.84%
AMD-13.27%
TSLA-7.56%
  • 4
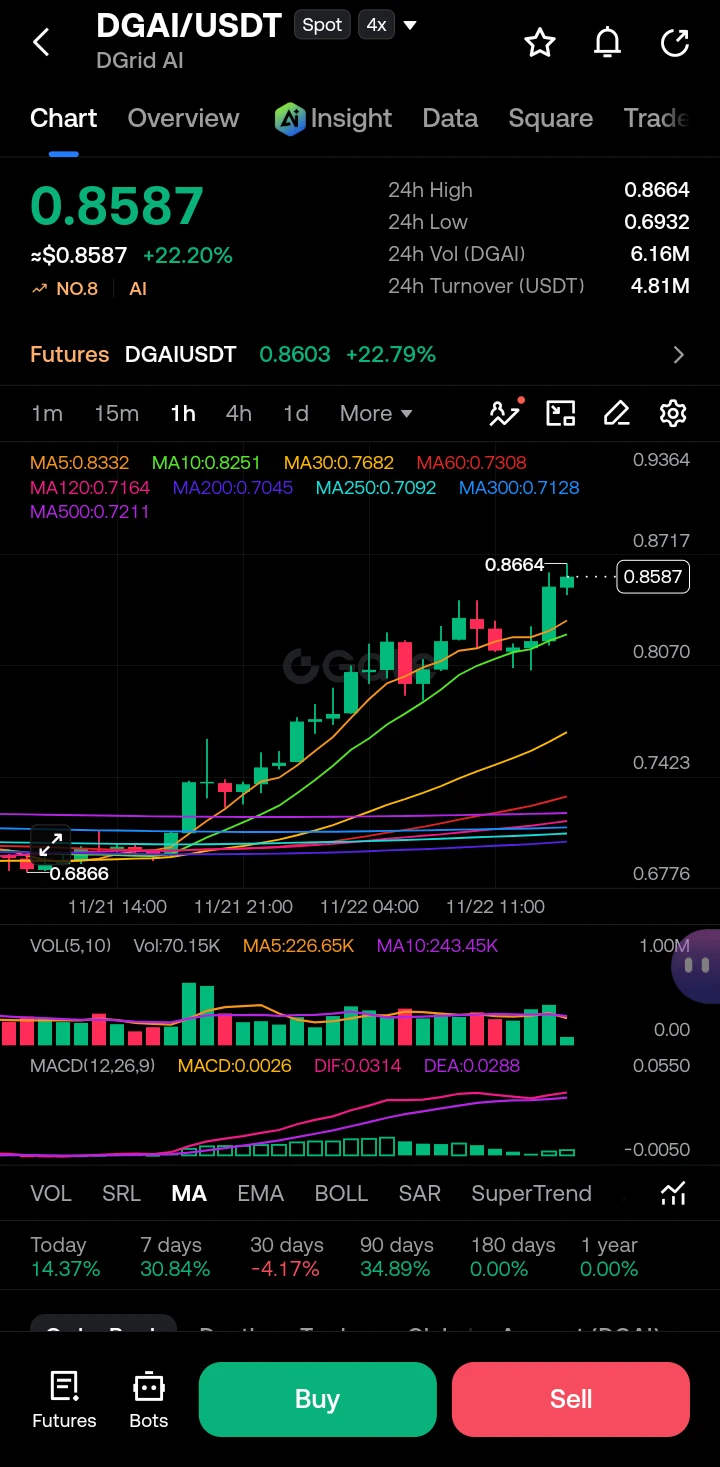
$DGAI ‌
The DGAII/USDT chart is displaying a textbook, aggressive bullish trend, having rallied over 22% in the last 24 hours to reach a current price of 0.8587. Price action is forming a series of higher highs and higher lows, riding a strong uptrend. The moving averages (MA) are in a perfect bullish fan, with the short-term MA5 (0.8332) and MA10 (0.8251) acting as dynamic support below the current price. We are currently testing the 24-hour high resistance zone at 0.8664. Volume has been noticeably elevated during this upward push (Vol MA5 is 226.65K), confirming the buying pressure behind
post-image
DGAI+0.67%
  • 1
  • 1
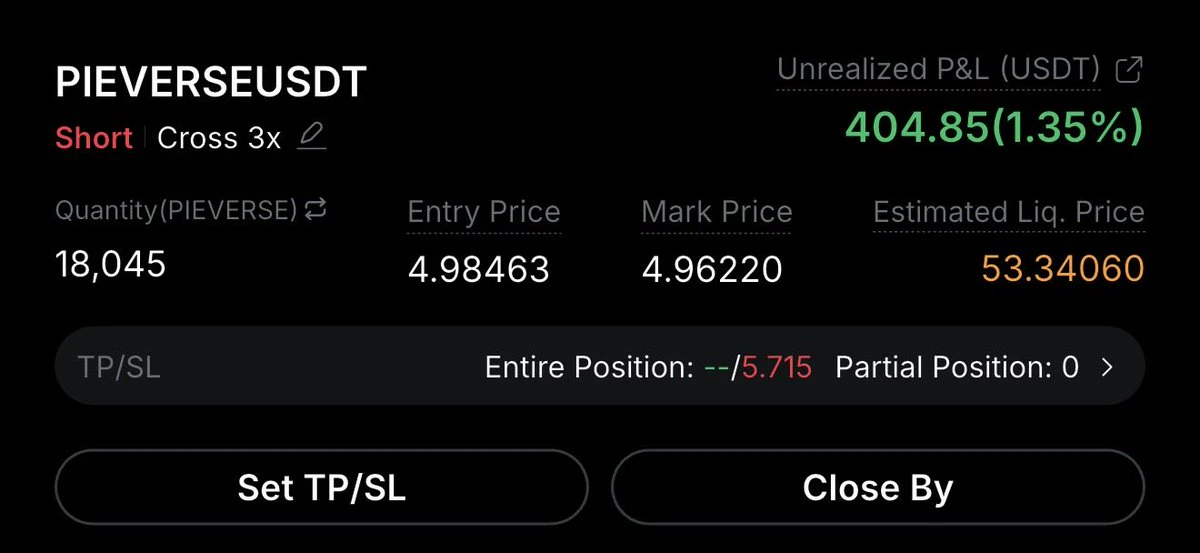
$PIEVERSE Short Setup 🔥‼️
By Professor Profit
CMP $4.96 with 3X Leverage.
Entry 2: $5.295
SL: $5.715
TPs: $3.5-$2.5-$1.6-$1-$0.55
Time to be RUGGED!
#PIEVERSE $IDOL $BNB $JCT $AKE $EVAA $PEPE $TRUMP $GOLD #BNB  #TIA $BTW $TAO $DNA $XRP $EVAA
post-image
PIEVERSE+0.50%
IDOL-6.71%
BNB-0.76%
JCT-3.26%
AKE+6.07%
Fuck your mother, fuck your mother, motherfucker, match-fixing.
post-image
  • 2
  • 2
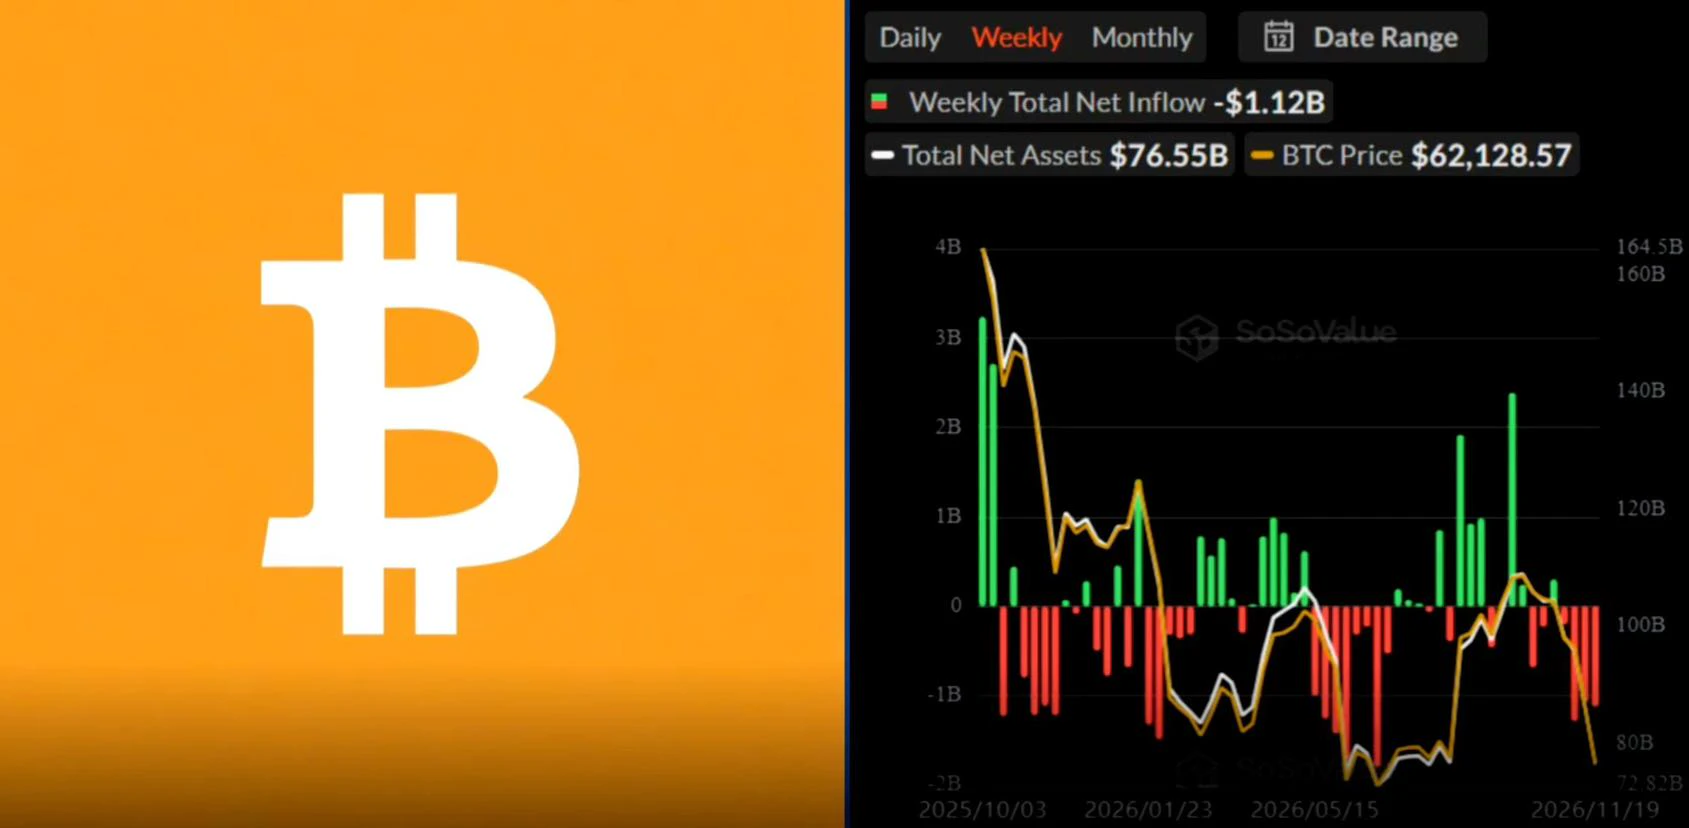
U.S. spot $BTC ETFs recorded $1.12B in net outflows over the week, while Ethereum ETFs saw $216.79M leave. A total of $1.34 billion.

Combined, the two largest crypto ETF categories lost roughly $1.34B as institutional redemptions accelerated.

Bitcoin funds faced the heavier pressure, with Ethereum products continuing their own outflow streak.

#Bitcoin #Ethereum #Crypto $BTC $ETH ‌ ‌
post-image
BTC-0.67%
ETH-1.26%
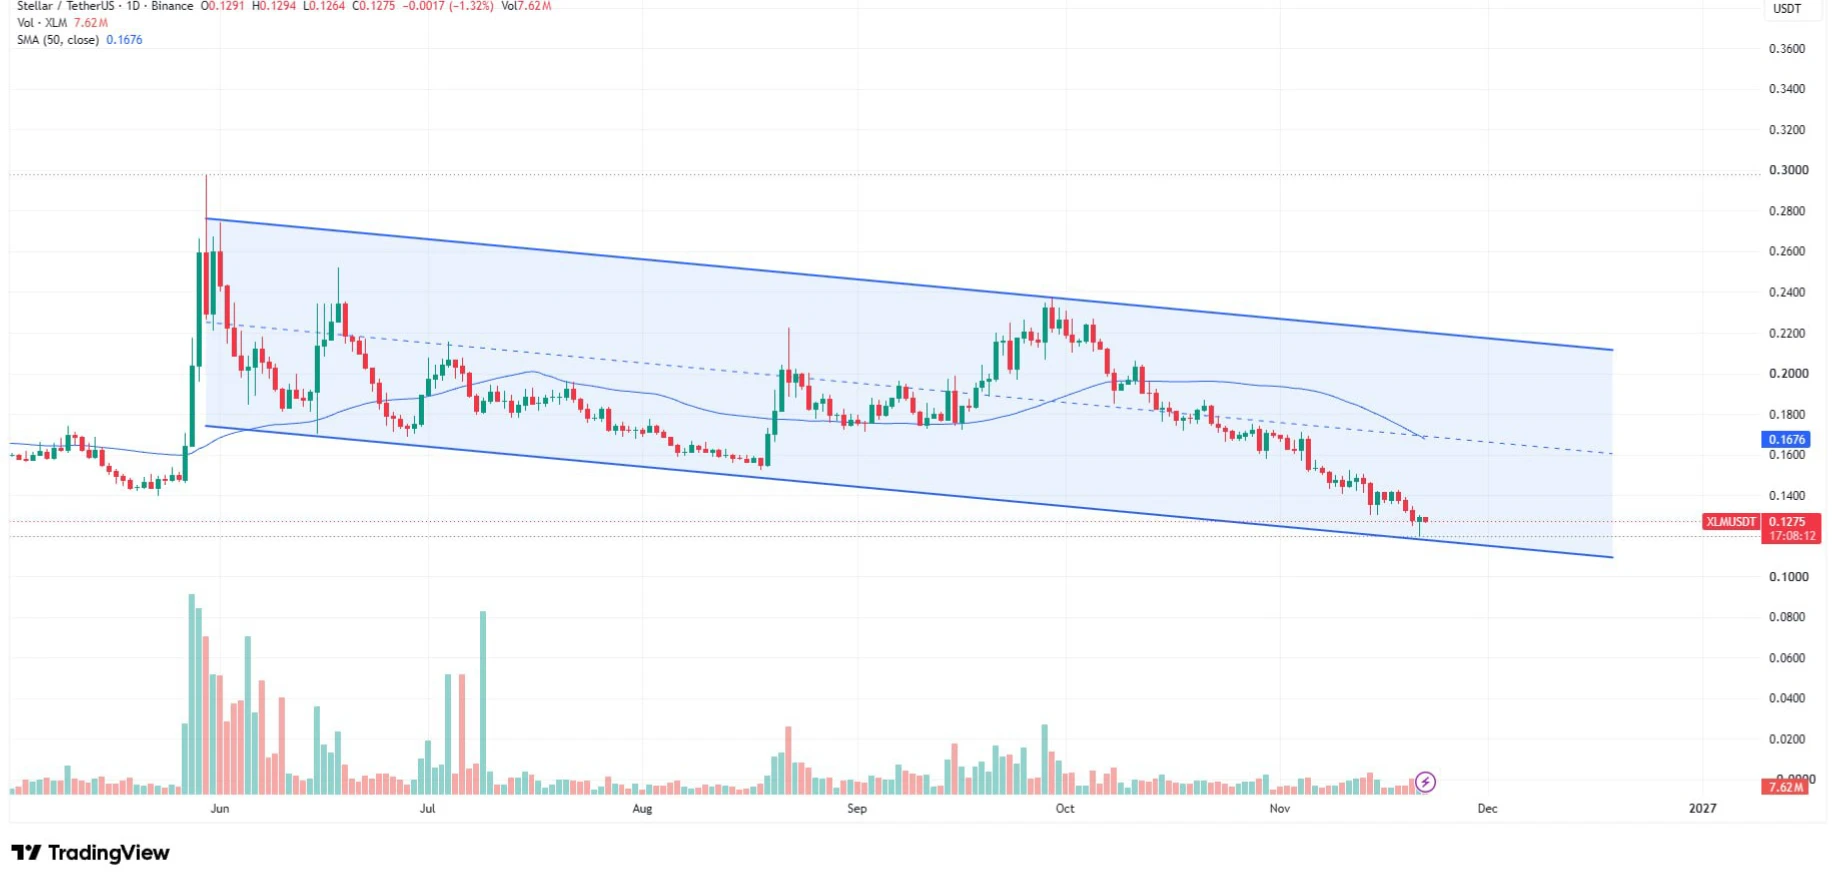
$XLM : Waiting for a Liquidity Sweep Before Going Long

$XLM is approaching the lower boundary of its descending channel, but I’m not rushing into a long position just yet.

I’d like to see a downside deviation first, potentially sweeping liquidity below the channel support, followed by a strong reclaim back inside the structure.

That would provide a much cleaner entry with better confirmation.

For now, patience is key. No need to catch a falling knife when a better setup may be forming.

Watching closely. 👀

#BTCReboundFaces60KTest #PCEAndGDPDataNextWeek
post-image
XLM-0.64%
  • 2
$SOXLB Today's gain is 7.79%, but the one-hour chart looks strong while the four-hour chart looks weak, giving completely contradictory signals. The one-hour RSI has reached 63.59, while the four-hour RSI is at 20.88, in oversold territory. This divergence between the short-term and longer-term charts has left the market outlook unclear.
I’d rather view this as a direction that hasn’t been confirmed yet than rush to call it a rebound or a pullback. The current price is 33.91, already in oversold territory. Let’s wait for a confirmed bounce before drawing conclusions; covering shorts now means
post-image
#ShareWeekly #Arbitrum #WCTCS9

The cryptocurrency market often focuses on Bitcoin prices, Ethereum movements, and the performance of major altcoins. However, I believe some of the most important developments happen behind the scenes, particularly in the movement of stablecoin liquidity across blockchain networks. Arbitrum One has recently delivered an impressive signal in this area, recording a $327.4 million increase in stablecoin circulating market capitalization over just seven days.

According to data disclosed by Arbitrum through Token Terminal, this growth placed Arbitrum One ahead of
ARB+1.17%
BTC-0.67%
ETH-1.26%
ARC-4.26%
APT-1.51%
Load More

Join 40 M users in our growing community

⚡️ Join 40 M users in the crypto craze discussion

💬 Engage with your favorite top creators

👍 See what interests you

Trending Topics

BTCReboundFaces60KTest

2.1M Views30.1K Discussing

BTC rebounded from around $55,300 on November 21, briefly reclaiming $60,000 before pulling back to around $59,300. The $60K level is back in focus as traders assess whether the recovery can last. Is this rebound a sign of stabilization or a short-lived recovery? Would reclaiming and holding $60K be enough, or do you need confirmation from trading volume and fund flows?

PCEAndGDPDataNextWeek

259K Views2.6K Discussing

GateDirectIPOPhase3ANTAllocates92100Shares

829.2K Views5K Discussing

View More