Share your thoughts
placeholder
Article
$$UAI The data looks off: the 24-hour amplitude is 47%, and trading volume reached $209 million, but the price is stuck at 0.7281, unable to move up or down. The high of 0.7597 was slammed back three times. This is not an ordinary pump—it looks like someone is executing precise price control.
First, the unusual points: the 24-hour low of 0.5152 to the high of 0.7597 means it went from hell to heaven and back to the middle of the mountain, yet trading volume did not explode and instead remained steady. If retail traders were really FOMO-chasing the price, there should have been massive volume a
UAI+19.59%
Insiders are calling this range the setup that breaks short sellers

$BTC /USDT - SHORT

Trade Plan:
Entry: 79216.1 – 79363.5
SL: 79997.2
TP1: 78759.3
TP2: 78405.6
TP3: 77875.0

Why this setup?
Why now? The daily trend is range, so the market is coiled and waiting for a directional burst. The 1h ATR of 294.74 shows volatility is compressed enough for a sharp move, while the 15m RSI at 57.61 signals room to run lower before overbought. The entry zone sits at the 1h price of 79289.8, giving a precise fill, with TP1 at 78759.3 and TP2 at 78405.6 as the first two targets on the short side. The
BTC-0.71%
Nobody is talking about the quiet SYMBOL move that has ripe shorts positioned right now

$MU /USDT - SHORT

Trade Plan:
Entry: 1029.64 – 1031.68
SL: 1040.46
TP1: 1023.31
TP2: 1018.41
TP3: 1011.06

Why this setup?


Debate:
Are we testing TP2 at 1018.41 or is the range about to trap the shorts with a fake move back above 1031.68?

⚠️ Personal market analysis only. NFA — manage risk and DYOR.
Educational content, not investment advice or a recommendation to buy, sell, deposit, or withdraw any asset. No paid promotion or referral/affiliate links.
MU+2.01%
I had just switched the app to the background when it shot right back up—are you playing hide-and-seek with me? 📈

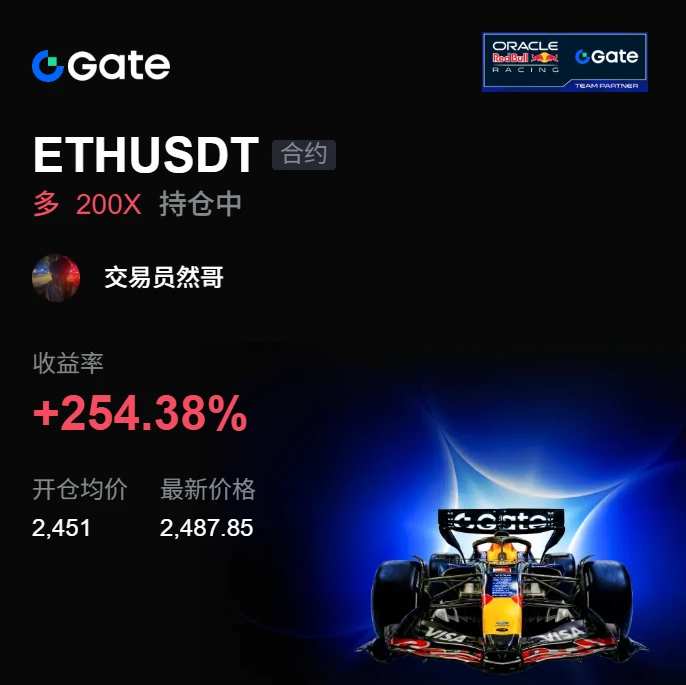
A few days ago before bed, I was thinking: $ETH had been hovering around 2451.64 for so long, never breaking the key level, while the bids were gradually thickening. Wasn’t it about to make a move? So I placed a long order, set my stop-loss, and went to sleep.

When I opened the chart in the morning: current price 2490.44, +275.3%% in the bag. That’s just ridiculous. There’s your answer, guys—this move wasn’t a waste of waiting. It dragged on for so long, but the breakout itsel
post-image
ETH-0.12%
XRP-0.29%
SOL-1.10%
$1000 to $100,000 Crypto Trade Challenge Today
live-cover
LIVE1,603
Precise short entries and profits secured! Stay decisive on the rebound! BTC and ETH outlook for 9.8
The short strategy given yesterday was validated again. Following along, you could easily pocket around a thousand points on BTC and 40–50 points on ETH. There are profits to be made again! Those already in should set a profit-locking stop-loss, while those not in can continue waiting to short the rebound!
The daily chart is still consolidating at elevated levels. The KDJ indicator shows a high-level death cross on all three lines, while MACD also shows a death cross on both lines, with trading
ETH-0.12%
BTC-0.71%
  • 1
#BTCDropsBelow80K BITCOIN DROPS BELOW $80K — THE MARKET IS WATCHING CLOSELY!
Bitcoin ($BTC ) has once again slipped below the $80,000 psychological level, putting traders and investors on alert. The $80K area has become an important battleground between bulls and bears, and losing this level can create additional short-term volatility across the crypto market.
📉 Why is $80K important?
The $80,000 level is not just a round number. It has become a major psychological zone where traders are closely watching price action. When Bitcoin trades above this area, bulls have a stronger argument that m
post-image
BTC-0.68%
September 8 15-minute short-term strategy:
ETH: Short around 2526-2545, take profit around 2500-2482-2466, stop loss if it breaks above 2550. Long around 2448-2436, take profit around 2466-2480, stop loss if it breaks below 2430.
BTC: Short around 79365-79530, take profit around 78811-78600, stop loss if it breaks above 80000.
SOL: Short around 105.70--106.87, take profit around 103.58-103.16, stop loss if it breaks above 107.50.
For ETH, due to price differences across platforms, entries can be taken $1-3 above or below; for BTC, entries can be taken $50-100 above or below.
The breakouts and
ETH-0.05%
BTC-0.68%
SOL-1.04%
I was just about to head to the forum to rant, but then I saw my balance and thought better of it—the market is always right. 😂
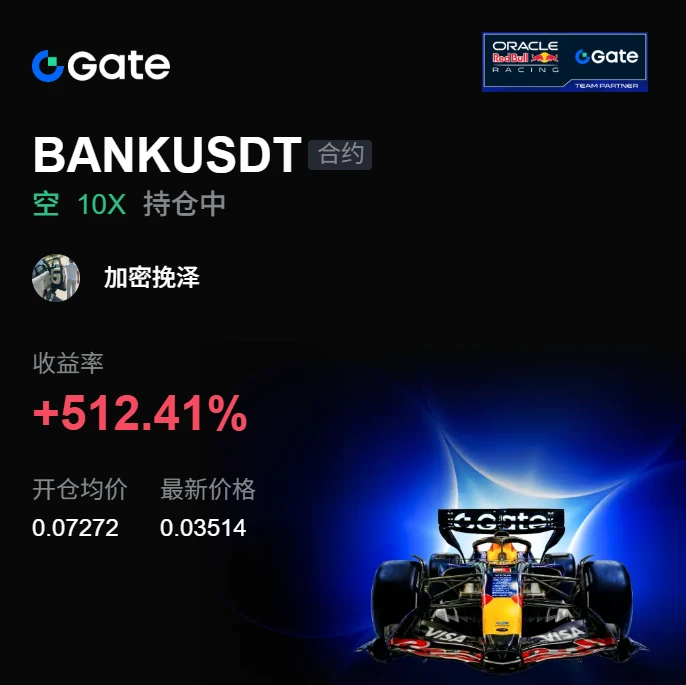
One last look before bed: $BANK was putting on a strong face around 0.07272, with the intraday chart full of tiny bullish candles. It looked lively, but the volume never really kept up. While everyone else was waiting for a breakout confirmation, I figured a low-volume surge like this wouldn't last three hours, so I placed a short order. My friends even said I was being too aggressive.
Overnight, the market did all the work by itself. The current price is 0.03514, an
post-image
BANK+1.09%
ETH-0.12%
ADA+0.27%
[New Streamer] Morning Updates of GT and XAUT coins
live-cover
LIVE1,488
A whole day of pointless ups and downs🎢. Fuck, pump it already—take it straight to 5,000, stop dawdling around 4,500 doing nothing but shaking out weak hands, then pump it to 10,000. It’s a bull market, so pump it already.
post-image
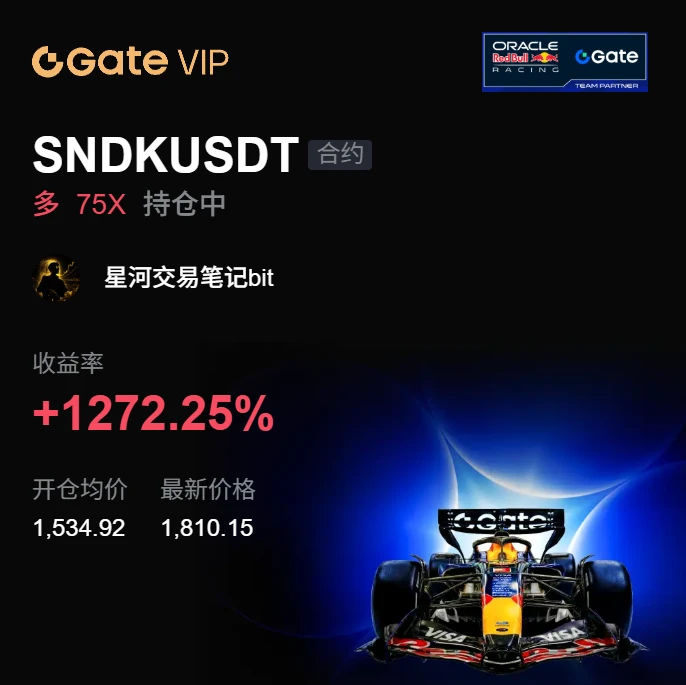
The $SNDK long was a bit of a grind to hold, with one dip in between sweeping out quite a few short chasers and coming just a few points from my protective stop. I didn’t manually cut it at the time because the four-hour structure had not yet broken.
I entered based on a double bottom on the hourly chart. After the right-side breakout, it retested the prior-high neckline and held firm, so I went long after confirmation. The entry wasn’t particularly cheap, but the stop was very close—an attempt to use limited risk to capture a trend continuation.
After it rallied into the target zone, I manage
post-image
SNDK+2.09%
BTC-0.71%
ZEC-3.36%
Insiders are quietly fading the bounce on SYMBOL while range-bound charts hide a bigger move.

$PONS /USDT - SHORT

Trade Plan:
Entry: N/A – N/A
SL: N/A
TP1: N/A
TP2: N/A
TP3: N/A

Why this setup?
Why now? The 1d trend is range, which means price is coiling and a directional break is overdue. The 15m RSI sits at 57.04, showing mild bullish exhaustion rather than conviction, so fading upside makes sense. The 1h ATR is unavailable, meaning current hourly volatility is quiet and a sudden expansion could catch overextended longs off guard. The entry zone is anchored at 0.7236, a precise level w
PONS-6.99%
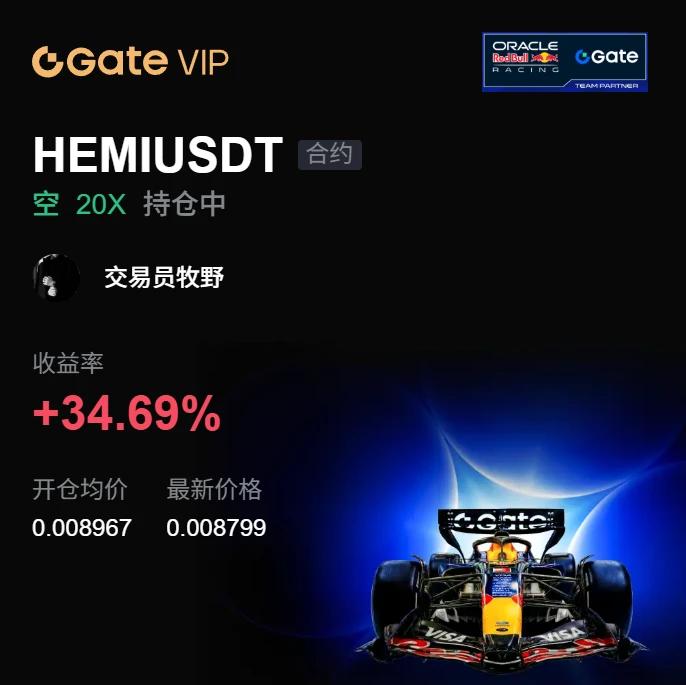
No conviction, can’t hold on—these profits are as thin as paper, but I love it. Anyway, I accept it. ❤️

While everyone was still waiting on the sidelines, I saw clear overhead resistance. Every push upward fell just short, and volume failed to follow. This kind of fake-breakout structure is perfect for entering a short; it was basically a free point. I got in directly at 0.008967, and the direction was clean and decisive, without the slightest hesitation.

Looking at the chart now, $HEMI ’s 0.008816 is already lower than my entry. 📉 Return +34.03%—nailed it. Time for a good meal. 🍗 It was
post-image
HEMI-17.61%
ADA+0.27%
SNDK+2.09%
09-08
Bitcoin
Open short at 79400, add to short at 79800, stop-loss 80400, target 78600-77800;
Ethereum
Open short at 2520, stop-loss 2545, targets 2480-2450-2400;
zec
Short around 1160, stop-loss 1175, targets 1100-1060;
sndk
Open long at 1780, stop-loss 1750, targets 1880-1930;
Gold
Aggressive: Open short at 4430, stop-loss 4440, targets 4410-4380;
Conservative: Open long after the price stabilizes above 4440, stop-loss 4420, targets 4460-4500;
Personal opinion, not investment advice. Trade based on this at your own risk.$SNDK .
post-image
SNDK+11.88%
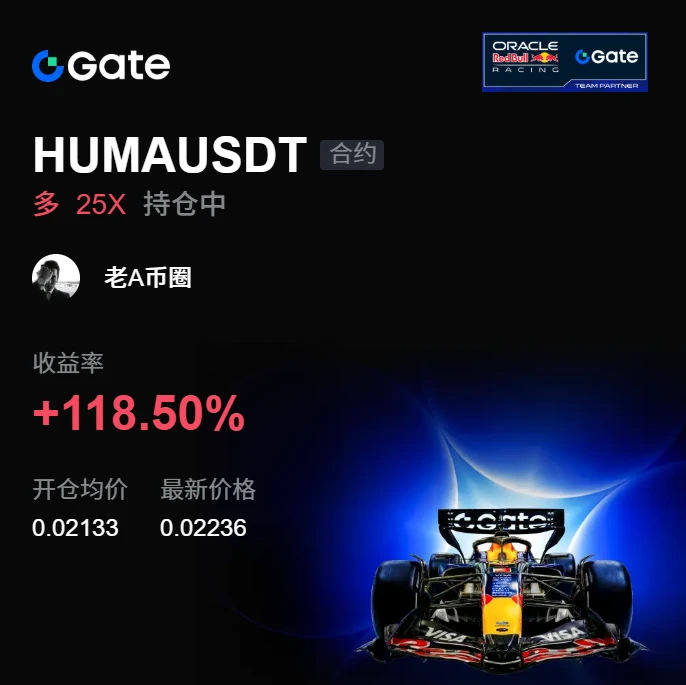
I didn’t expect it to survive—it went straight to breakeven. The service was exceptional.

When it plunged intraday, I stared at the screen thinking: this trade might really be an expensive lesson. But then I noticed funds quietly entering and the pullback holding steady, so I felt it was still missing one final push. Today, it supplied that push itself.

$HUMA is currently at 0.02232, compared with my entry at 0.02133, bringing the paper gain to +118.5%. Those already on board should be waking up laughing—the profits feel great.

The prerequisite for compounding is staying alive; the short
post-image
HUMA+0.72%
BNB-0.74%
DOGE+1.02%
#GateLaunchesTrenchesWith0GasFee 🐶 THE HUNT FOR GOLDEN DOGS IS ON!
On-chain Meme trading is getting a whole new experience with Gate.
With support for 15+ major public chains and trading fees starting from just 0.5%, finding and trading the next potential Meme gem becomes faster and easier.
And there’s more 👀
Robinhood Chain is currently offering limited-time 0 Gas, while upcoming social features like the Callout Leaderboard, KOL Leaderboard, and Active Accounts are set to make the on-chain community even more competitive.
But the real question is:
If you had to hunt for a “Golden Dog” today
post-image
DOGS+4.78%
MEME+1.81%
  • 3
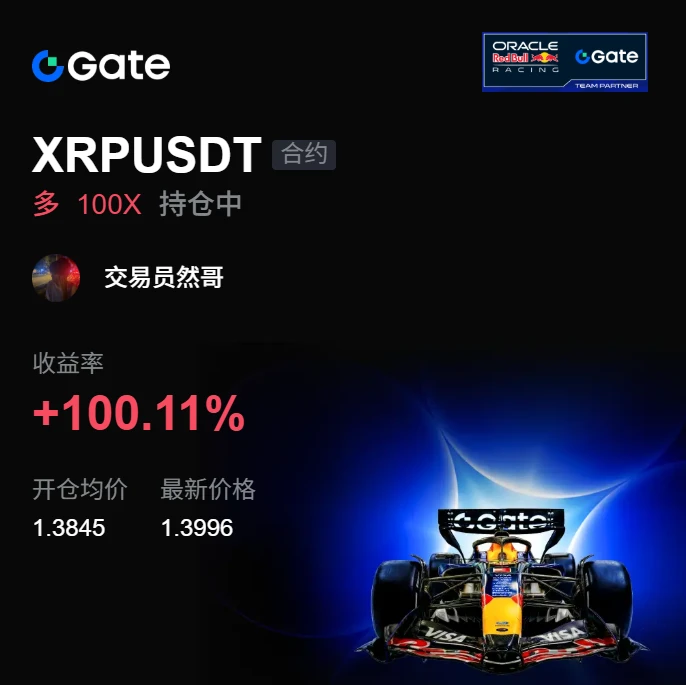
I was just about to close the position and curse the market when it turned around and dropped my jaw. While everyone else was running, I kept watching the chart, thinking, what’s the point of cutting losses at a level like this? The pullback held, support was there, so I followed the plan and went long, taking a shot.

The entry price was 1.3845. I opened a long without hesitation and immediately chose a direction. Many people were saying it would keep falling, but I couldn’t be bothered to argue. The chart doesn’t lie, and the price speaks for itself.

Now $XRP has climbed to 1.3995, with
post-image
XRP-0.29%
DOGE+1.02%
BTC-0.71%
$FLOCK Down 20% in 24 hours, with a wick low of 0.055, and now moving sideways around 0.0635—this is not a bottom-fishing signal, but a typical continuation move in a downtrend. Don't rush to catch a falling knife.
First, look at volume and price: the $150 million 24-hour trading volume combined with this decline shows that major players are distributing, not retail traders panicking. From 0.0795 down to 0.055, the drop exceeded 30%; the rebound to 0.0635 failed to reclaim even the 0.065 0.618 Fibonacci retracement level, showing extreme weakness. On the four-hour chart, MACD remains below the
FLOCK-15.04%
Load More

Join 40 M users in our growing community

⚡️ Join 40 M users in the crypto craze discussion

💬 Engage with your favorite top creators

👍 See what interests you