Share your thoughts
placeholder
Article
I originally wanted to cut my losses and sacrifice to the heavens, but the ritual never happened—the meat roasted itself. When I opened the chart this morning and saw $BILL still stubbornly holding on, I knew it was time to act. The rebound was weak, overhead resistance was obvious, and volume never managed to keep up. This kind of situation cannot last much longer.

I decisively placed a short at 0.07826. Taking another look just now: 0.01559, +1576.75%. Time to treat myself to a good meal. I timed this move so well that even I want to give myself a little praise.

As for the trade, 70% of
post-image
BILL-6.45%
XRP-3.59%
ETH-2.13%
Everyone’s staring at $ETH /USDT’s range—but the 4h just armed a trap most won’t see until it’s too late.

$ETH /USDT - SHORT

Trade Plan:
Entry: 2446.97 – 2456.75
SL: 2498.80
TP1: 2416.66
TP2: 2393.19
TP3: 2357.98

Why this setup?
Why now? The 1D is range-bound, yet the 4h SHORT signal is armed at 2451.86 with a 55% confidence—not a slam dunk, but a precise edge.
• RSI on 15m is 43.79, showing weak momentum, not yet oversold—room to fall.
• ATR 1h is 19.55, so the move to TP1 (2416.66) is only ~1.4x daily noise—tight, actionable.
• Invalidation sits at 2462.70, just 0.4% above entry—
ETH-2.13%
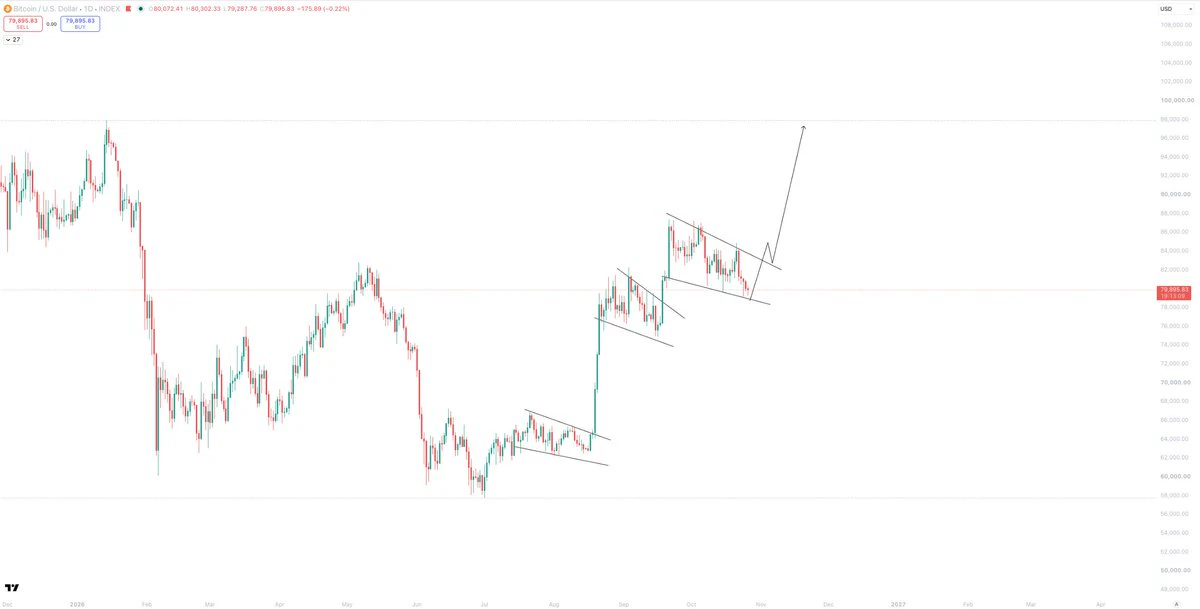
The biggest change at present is that BTC pulled back after rising back to around $82,000, while ETH failed to break above its previous high, indicating that ETH's short-term strength relative to BTC remains insufficient. On September 4, U.S. nonfarm payrolls added 162,000 jobs in August, significantly above expectations, while the unemployment rate was 4.1%; the strong employment data led the market to raise expectations for a September rate hike again, and the 2-year U.S. Treasury yield briefly rose to 4.38%.
Therefore, my current assessment of ETH is:
Short term: Range-bound with a bearish
BTC-2.03%
ETH-2.16%
BTC ETH UPDATE
live-cover
LIVE89
A deeper correction sub 58k would be a movie 🍿📺
$BTC
post-image
BTC-2.03%
  • 2
$BTC Signal】Go long—1H volume contraction, decline halted, buy at lows
$BTC Order book buy/sell imbalance: -83.59%; the sell wall remains intact; volume at 13:00 contracted to 1131, and active selling pressure has dried up. Price at 79531 is hugging the outside of the lower Bollinger Band, while the 1H chart left a $178 lower wick, with low-level buying support beginning to emerge. RSI(1H) has slid to 41, while the 4H MACD histogram remains positive, creating conditions for an oversold recovery.
🎯 Direction: Long
⚡ Entry/limit order: 79292.41 - 79531.00
🛑 Stop-loss: 78735.69
🚀 Target 1:
post-image
BTC-2.01%
Bitlayer (BTR), the native asset of the Bitlayer ecosystem, continues to seek consolidation at its bottom levels after a sharp 70.2% pullback over the past 7 days. The BTR/USDT spot pair, recovering from its intraday low of 0.04547 USDT with buying interest, rose by 10.58% to 0.05278 USDT. Perpetual futures (Perp) contracts are trading at 0.05298 USDT, up 10.74%.
Volume Indicators and Capital Flows
Despite the immediate price rebound, derivative market and capital flow data indicate a cautious outlook:
Trading Volume: In the last 24 hours, the Gate spot market recorded a trading volume of 59.6
BTR+3.68%
  • 12
  • 2
A few days ago, the hand that set the stop-loss trembled slightly. This morning, I realized that was unnecessary filial devotion.

A few days ago before bed, $LINK was still moving sideways at the bottom, testing my patience, but I took a look and saw it hadn’t broken down, so all was well. I entered at 9.352 then.

This morning, I saw 11.613, with a return of +1715.16%. Staying up wasn’t for nothing—I finally got a bite of this meat 😌. Managing risk in advance is called rationality; cutting after taking losses is called a heroic last stand.

Take 80% off the table first, and move the sto
post-image
LINK-1.56%
LAB+0.98%
ZEC+7.58%
$Bull is coming ‌ Bull is coming, continue entering short positions; there is at least twice as much downside remaining👇🏻
post-image
牛来-13.59%
【Price Trend Analysis】
1. Candlestick Patterns:
* 4-hour chart: A massive bearish candle appeared at 20:00 on September 4, followed by two candlesticks fluctuating at low levels. The current candlestick’s closing price is near its low, indicating that bearish forces are dominant.
* Daily chart: A bearish candle with long upper and lower shadows closed on September 4. Its body was relatively large, the closing price was below the opening price and the previous day’s closing price, indicating that bulls encountered strong selling pressure after pushing toward the high.
2. Technical Indicator
ETH-2.13%
BTC-2.01%
  • 1
How is this a rebound? This is CPR for my account, isn’t it? $DELL It just hit 522.17, with +727.91% in the bag. I stared at the screen for several seconds to make sure I was looking at the right account.
When I opened the market this morning, buying pressure was clearly getting stronger, and each pullback was becoming smaller. It was obviously not an ordinary dead-cat bounce. Around 453.65, I said it plainly: the risk-reward here was good enough—take the loss if wrong, and if right, it would be a big win.
Looking back now, the timing was perfect. Here’s the position update: I took 75% off the
post-image
DELL+1.53%
SNDK+11.82%
BTC-2.01%
How is this a rebound? This is CPR for my account, isn’t it? When the screen was glowing green, I was thinking, can this market still be traded? Then, right after I finished reading the bad news, $WLD forcibly climbed from 0.3669 to 0.38, slapping me in the face and telling me: stop arguing—the trend is king.

The entry logic was actually very simple: the pullback held, and buying pressure strengthened. When it stops falling, it stops falling; both volume and price action were hinting that someone was buying the bottom. While everyone else was running, I chose to take a look at the weekly st
post-image
WLD-2.94%
BNB-0.59%
SNDK+11.82%
$1000 to $100,000 Crypto Trade Challenge Today
live-cover
LIVE533
$4 Signal】1H volume breakout, bullish continuation
$4 broke above the upper Bollinger Band on heavy 1H volume, while the 4H MACD shows bullish expansion and the current price is hugging the outer channel. RSI 79.9 is flattening in overbought territory, with a 4.34% order book depth imbalance and buyers slightly dominant. OI is stable, with no signs of a squeeze, and the 0.025% funding rate shows no overheating.
🎯Direction: Long
⚡Entry/Limit Order: 0.02358304 - 0.02365400
🛑Stop-loss: 0.02341746
🚀Target 1: 0.02400881
🚀Target 2: 0.02418622
🛡️Trade Management:
- Reduce the position by 50% up
post-image
4+39.75%
BTC-2.03%
ETH-2.16%
SOL-1.89%
Everyone’s chasing XLM’s breakout, but the 4h tape just whispered a secret that flips the script.

$XLM /USDT - SHORT

Trade Plan:
Entry: 0.17882 – 0.17970
SL: 0.18352
TP1: 0.17607
TP2: 0.17394
TP3: 0.17075

Why this setup?
- Price is pinned at 0.17926, but momentum is dead: RSI(15m) is 47.27—no fuel for a pump.
- Range-bound 1D trend + tight ATR (0.0017) means we’re coiling for a snap, and the path of least resistance is DOWN to TP1 at 0.17607.
- The “Armed” status says the trap is set—but invalidation at 0.18173 is the only escape hatch for bulls.
- Why now? The clock is ticking: 4h
XLM-2.53%
Hey @grok, which tunnel design would be structurally strongest under a mountain?
post-image
Everyone’s watching XRP’s rebound—but this 4h chart is screaming something else entirely.

$XRP /USDT - SHORT

Trade Plan:
Entry: 1.3900 – 1.3976
SL: 1.4300
TP1: 1.3667
TP2: 1.3486
TP3: 1.3215

Why this setup?
- Price is pinned at 1.3938 with a hard ceiling at 1.4057—that’s your invalidation line.
- RSI (15m) at 38.82 shows momentum is fading, not flipping.
- ATR (1h) of 0.015 suggests low volatility = compressed spring, but direction remains SHORT with 55% confidence.
- The range-bound 1D trend means we’re not breaking out; we’re rejecting.
- Why now? Because 1.3900–1.3976 is the l
XRP-3.59%
Rewards are being distributed! Open your mystery box now and win up to 100 USDT worth of tokens! https://www.gate.com/referral/earn-together/invite/UFRFAQ0M?ref=UFRFAQ0M&ref_type=103&utm_cmp=rXJBDjtJ&activity_id=1788357807948
post-image
I’m watching $AAVE for a short here.
AAVE got rejected hard from the $136 area, and the 1H chart is now printing lower highs while price keeps slipping below $131. Sellers still look in control unless that level gets reclaimed.
Entry: $129.70–$130.30
Targets:
TP1: $128.60
TP2: $127.90
TP3: $126.20
Stop: $131.30
For me, $131 is the key level. As long as AAVE stays below it, I’m looking for continuation lower. A clean reclaim above $131.3 would invalidate the short idea.
#Gate60MillionUsers #BTCReclaims80K
post-image
AAVE-1.94%
  • 3
  • 1
Everyone’s staring at the 15m RSI (70.94) while SLX silently prints lower highs on the 4h.

$SLX /USDT - SHORT

Trade Plan:
Entry: 0.07002 – 0.07044
SL: 0.07228
TP1: 0.06869
TP2: 0.06767
TP3: 0.06613

Why this setup?
Why now? The 1D range isn’t your friend—it’s a trap door.
- 4h bias is SHORT (55% conf), but the real tell is the EMA cluster at 0.07023.
- Price is pinned at entry_ref, with TP1 at 0.06869 (a 2.2% drop) and TP2 at 0.06767 (3.6%).
- ATR (0.000855) says volatility is compressed—breakouts get violent.
- The 15m RSI is overheated, but that’s noise. The 4h structure is what
SLX+1.72%
Load More

Join 40 M users in our growing community

⚡️ Join 40 M users in the crypto craze discussion

💬 Engage with your favorite top creators

👍 See what interests you

View More