
Square
Following
Hot
News
Profile
Share your thoughts
placeholder
Article
Hot CPI: A Rate Hike—or a Longer Wait for Relief?
Inflation can unsettle markets without forcing the Federal Reserve to raise rates.
The crucial shift is in the expected policy path, not the CPI headline alone.
Here is how to separate October tightening risk from a temporary market scare.
What would change?
In this hypothetical scenario, CPI exceeds expectations. That could strengthen October hike expectations, but the adjustment might instead mean fewer anticipated cuts or a longer hold. Without verified market pricing, assigning a probability would be speculation.
Composition matters: persis
post-image
xxx40xxx
Hot CPI: October Hike Risk or Delayed Rate Relief?
Markets can tighten financial conditions before the Federal Reserve changes rates.
An upside CPI surprise matters most when it changes the expected policy path—not merely the headline.
The distinction helps explain when pressure on crypto and U.S. stocks could persist.
A surprise is not a verdict
If CPI exceeds expectations, October hike expectations could rise. But investors might instead anticipate fewer cuts or a longer hold. Without verified starting probabilities, the magnitude of that shift remains unknown.
Persistence matters more than surprise alone. Broad-based core inflation would strengthen the tightening argument; an isolated energy increase would offer weaker evidence. Employment trends and Fed communication could reinforce or challenge either interpretation.
Where the pressure lands
If expected interest rates and Treasury yields rise, equity valuations could weaken as future profits are discounted more heavily. Earnings provide a separate test: resilient margins and guidance could cushion the impact, while deteriorating profits could compound it.
Crypto could face reduced speculative demand and tighter financing conditions. Leverage can amplify price moves, but losses are not inevitable: positioning and expectations already reflected in prices influence the reaction.
Strategy: separate confirmation from noise
A sustained rise in yields alongside restrictive Fed communication would strengthen the bearish scenario. Cooling underlying inflation or a reversal in bond-market repricing would weaken it.
One important countercase: weaker employment could reduce hike expectations yet still hurt stocks through recession fears. Easier policy expectations are not automatically bullish.
A disciplined framework watches yields, earnings guidance and crypto leverage together rather than chasing the first move.
Risk: Inflation releases can trigger reversals, slippage and leveraged losses. This is educational analysis, not personalized investment advice or a profit guarantee.
What evidence would persuade you that October’s dominant risk is renewed tightening rather than weakening growth, and why?
$BTC $GT $ETH
#ShareWeekly #weeklyshare #FedSeptemberMinutesLeanHawkish #GateSquare
repost-content-media
BTC-0.23%
GT-0.37%
ETH-2.68%
BTC and Ethereum market surges predictions
live-cover
LIVE2,969
$RLC ‌RLCUSDT
Why did iExec RLC pump? Because it finally executed the pump order.
📉 Short
Entry: 0.9600 – 0.9800
TP1: 0.9000
TP2: 0.8500
TP3: 0.8000
SL: 1.0000
📈 Long
Entry: 0.8500 – 0.8700
TP1: 0.9200
TP2: 0.9600
TP3: 1.0000
SL: 0.8200
🔑 Key Levels
Resistance: 1.0870 / 1.0000
Support: 0.9006 (AVL) / 0.8802 (EMA7) / 0.8181 (EMA25) / 0.6528
⚠️ Not financial advice. DYOR & manage risk.
post-image
RLC+37.05%
Many people rush to chase the rally when the Fear and Greed Index returns to 59, yet overlook the rhythm of sector rotation—the greed zone is often the window to take profit on tokens that are catching up through rotation, rather than a signal to blindly add to positions. $TIA gained +10.66% today, showing independent strength against a backdrop of relatively warm overall market sentiment, but the indicators need to be examined separately: MA5=0.5128 has crossed above MA20=0.49617, confirming a bullish moving-average alignment; RSI=62.8 is strong but not overbought; and the MACD histogram at
post-image
AVAX-4.24%
The overnight ETH trade has already made back the losses from yesterday’s intraday trade.
post-image
ETH-2.68%
$BTC Both longs and shorts blown out: Big players used macro bearish news to wipe out 1 billion in long positions—is the bottom still not in? The plunge is not the end; big players are clearing the runway. The 1 billion liquidation chart shows longs accounting for 90%, while institutional smart money instead opened short positions around 81k. Their intent is quite clear: using macro bearish news as a shovel to specifically wash out leveraged retail traders chasing rallies. Personal view: Don’t rush to buy the dip now. On the 1-hour chart, the price is consolidating within a narrow range after
post-image
BTC-0.25%
$OGN The most dangerous misconception right now is equating “strong momentum” directly with “it is safe to keep chasing.”
This time, let’s ignore the gainers and losers rankings and only look at the price position. The current price is 0.04249, approximately 47.21% above the 1-hour support at 0.02243 and 25.79% below the resistance at 0.05345.
My criteria are simple: only a breakout above 0.05345 followed by continuation counts as an upside continuation; a break below 0.02243 invalidates the previous assessment. The 1-hour and 4-hour trends are relatively strong, with RSI at 49 and 77, respect
post-image
OGN+100.39%
#AIStocksFallALABDropsOver9% 📉 #AIStocksFall — ALAB Drops Over 9% as AI Chip Stocks Face Pressure
The AI trade just hit another reality check. ⚠️
On October 8, Astera Labs (NASDAQ: ALAB) fell 9.21% to $347.05, losing $35.20 in a single session. The decline came as investors pulled back from AI-related semiconductor stocks amid renewed concerns about AI revenue expectations and the enormous cost of building AI infrastructure.
But this sell-off raises a bigger question:
Is the AI growth story weakening — or are investors becoming more selective about valuations?
🔍 WHAT TRIGGERED THE SELL-OFF?
post-image
SNDK-4.91%
Guys, $KSM is rebounding strongly from the $4.45 support zone. Buyers are pushing the price higher, and if momentum continues, the next rally may be coming.
Entry: 4.75–4.78 Take Profit 1: 4.80 Take Profit 2: 4.85 Take Profit 3: 4.90 Stop Loss: 4.46 Buy and trade $KSM$ZE
post-image
KSM+3.03%
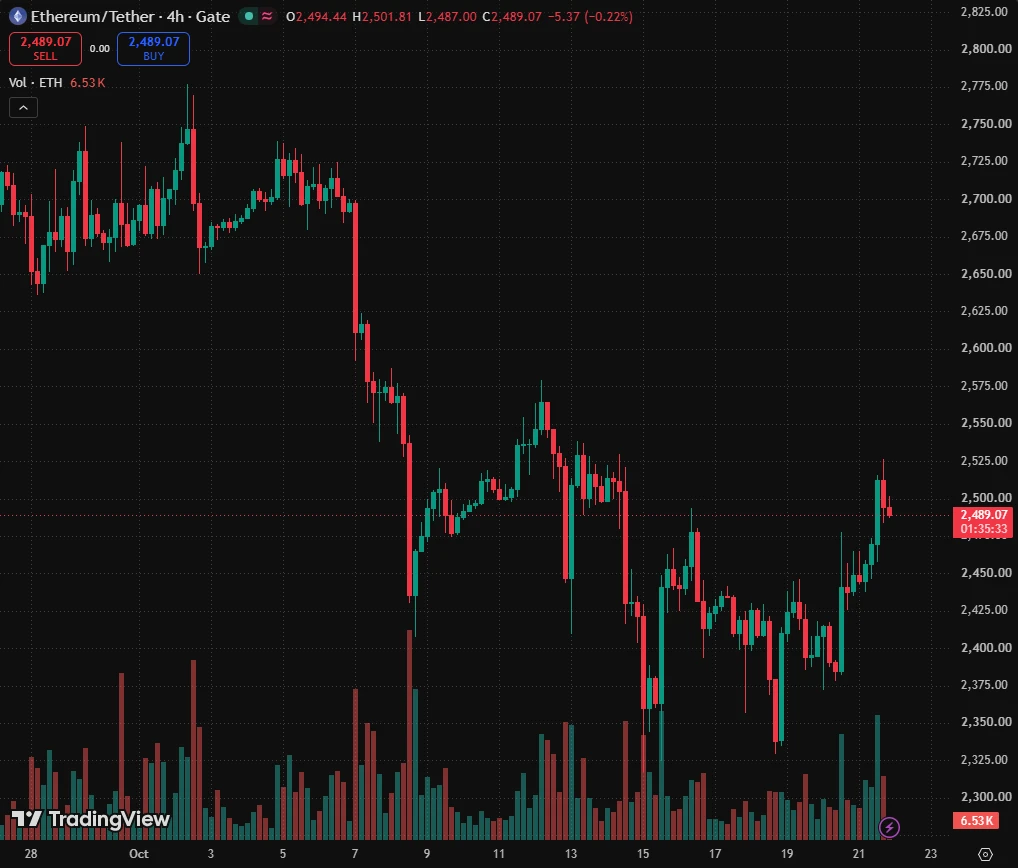
$ETH ETH is currently priced at 2490. Its intraday trend has weakened in sync with BTC, with greater elasticity and a relatively sharper pullback. The bulls lack sufficient rebound strength, and every minor rebound encounters selling pressure. On the four-hour chart, short-term moving averages continue to exert downward pressure. The primary resistance is near 2550; only a high-volume breakout and stabilization above this level would create an opportunity for a recovery, otherwise prices will remain in weak consolidation. The first support below is around 2440. If this support is decisively br
post-image
ETH-2.68%
That ETH long from yesterday afternoon hit its stop-loss last night. Today’s update will likewise start with the stop-loss, then cover the rebound in the early hours.
Yesterday’s ETH long hit its stop-loss last night.
The long was opened around 2565 yesterday, with defense at 2542. The afternoon high reached 2574, just over 10 points short of the 2585 target, so it was missed. At 7:30 p.m., price broke below 2542, so we exited as planned, losing a little over 20 points.
BTC then continued plunging, reaching a low of 2409 at 2 a.m.
After rising from 2409, it surged directly to 2475 within three
post-image
BTC-0.23%
ETH-2.68%
Morning Market Update
live-cover
LIVE1,384
‍#Gate与Visa合作推出加密资产关联卡
GatePartnersWithVisaToLaunchCryptoLinkedCard
Crypto Meets Everyday Payments!
Gate is partnering with Visa to introduce a crypto-linked payment card across 40+ countries and territories through its Gate Money ecosystem.
Key Highlights
Global Acceptance: Pay at Visa-accepting merchants across a network of 175+ million merchant locations.
Automatic Conversion: Spend supported digital assets, including USDT, BTC, ETH, and GT, with conversion into local fiat currency at checkout.
Flexible Payments: Use virtual cards for online purchases and supported mobile wallets, or phys
V+0.83%
BTC-0.23%
ETH-2.68%
GT-0.37%
SOL-3.93%
#BTCPullsBackTo81000 ₿ — Bitcoin Faces a Critical Support Test
The crypto market is entering a decisive phase as Bitcoin retreats toward the $81,000 zone. After trading around $85,000 earlier this week, BTC briefly slipped below $81,000, highlighting the pressure facing buyers. 📉
But the key question is not simply how far Bitcoin has fallen — it is whether buyers can defend this area and rebuild momentum.
📊 THE MARKET PICTURE
Recent trading reflects several challenges:
🔸 Profit-taking: Traders may be reducing exposure after previous price moves.
🔸 Macro pressure: Rising U.S. Treasury yiel
post-image
BTC-0.23%
Converting it into a unique guesthouse would at least triple the price, right?
The current sluggish real estate market is just lacking a sales genius like you 🤣
post-image
$0.235 ADA got hit hard today, but the interesting part comes later
$ADA fell nearly 8% today, with the current price hovering around $0.235. The chart looks ugly, but after checking the platform’s trending data—the 6-hour search volume surprisingly surged into the top three. The more it falls, the more people are searching for it. That’s quite interesting.
Put simply, retail investors are cutting losses and fleeing, while another group has quietly added it to their watchlist. This kind of price-volume divergence is usually followed by anything but calm.
If you want to see what’s happening wit
post-image
ADA-6.67%
FIL+2.93%
Trade Worry-Free: Get 100 USDT Loss Protection and Win Up to 666 NEAR https://www.gate.com/campaigns/6449?ref=VLARBF1YAG&ref_type=132
post-image
  • 1
$JCT Market rally launch signal! Technical indicators show bullish momentum poised to surge; scaling in gradually and avoiding chasing highs is the right move. Are you ready?#Gate.io 🚀🔥 #每周来晒
JCT+45.55%
$BTC Current price 82256, 24h -0.77%, trading volume 1735.6M USDT, Fear & Greed Index 59, still in the greed zone—the price is drifting lower, but sentiment has not cooled, and this divergence usually means bulls have not surrendered yet, with selling pressure coming more from leverage than spot markets. On the funding side, funding rates across the market remain slightly positive, with longs still paying to hold positions, but the funding premium has been compressed, indicating that the willingness to chase longs is waning and shorts are beginning to cautiously add positions. In terms of liq
NEAR-11.20%
Everyone is missing the real short setup forming right now in $CL /USDT.

$CL /USDT - SHORT

Trade Plan:
Entry: 90.06 – 90.38
SL: 91.76
TP1: 89.07
TP2: 88.30
TP3: 87.15

Why this setup?
Why now? The daily trend is range, which means price is coiling for a directional break and the 1h ATR of 0.640054 shows enough volatility to fuel a move. The 15m RSI at 34.75 confirms bearish momentum without being overextended, giving the entry zone of 90.06 to 90.38 a high-probability trigger. If price reacts from there, the first target sits at 89.07, with the second target at 88.30 offering a clean risk
post-image
CL+0.55%
  • 2
Load More

Join 40 M users in our growing community

⚡️ Join 40 M users in the crypto craze discussion

💬 Engage with your favorite top creators

👍 See what interests you

Trending Topics

GateAtTOKEN2049

35.2k Views20.77k Discussing

Gate brought a series of major events to TOKEN2049 Singapore! From the official launch of Gate Money to the F1 Red Bull driver meet-and-greet and the Gate Gala, we witnessed a new chapter of "One Gate, Borderless Finance." Which moment from TOKEN2049 stood out most to you?

BTC Pulls Back to 81000

25.41k Views35.68k Discussing

AIStocksFallALABDropsOver9%

24.61k Views550 Discussing

View More