Square
Following
Hot
News
Notifications
Profile
Share your thoughts
placeholder
Article
November 10 $ETH Market Update

Rate hike expectations heat up; waiting for CPI to set the direction

A recent New York Fed survey showed one-year inflation expectations reaching 3.9%, above the expected 3.78%. Combined with Fed officials repeatedly emphasizing inflation risks, concerns about a December rate hike have resurfaced.

The U.S. October CPI will be released tonight at 21:30. This data is important.

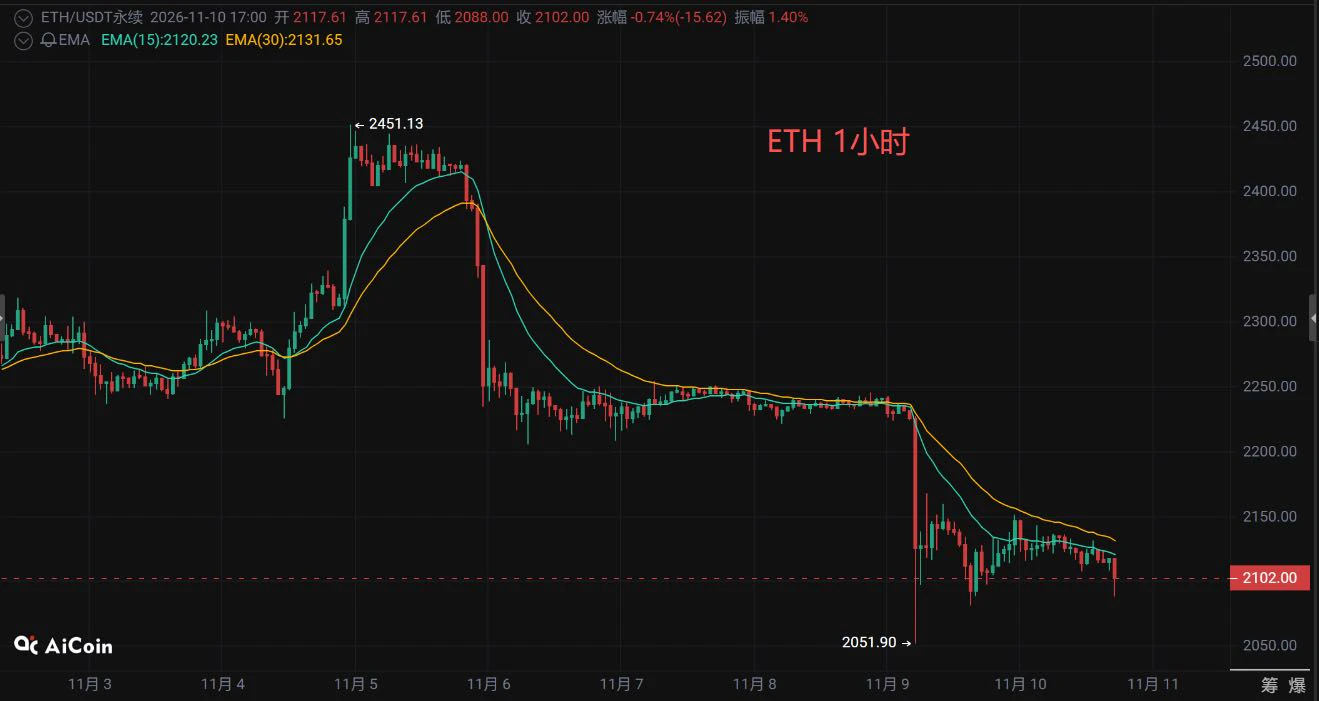
Looking at ETH, it fell to a low of 2051 yesterday, rebounded to around 2150, and then started weakening again.

It is currently fluctuating around 2100. The 1-hour moving averages are
post-image
ETH-1.23%
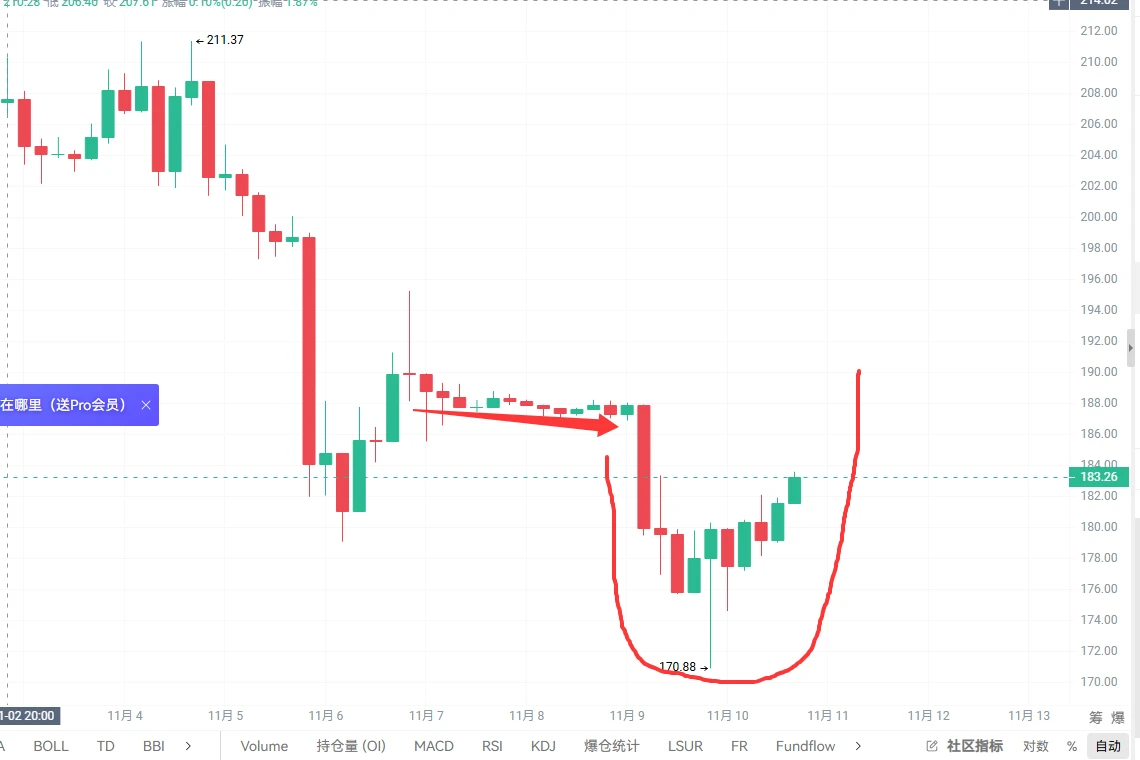
NVDA (Nvidia) is currently at 182u. You can go long, with a target near 200 and a stop loss at 168.
Yesterday it dipped to 170.88 and then rebounded. The lower wick was long, and trading volume was the highest in several months. It has bottomed.
When news of Huang's affair broke over the weekend, the market dumped first and asked questions later. Yesterday it plunged straight to 170. But Nvidia's business hasn't run into any problems, and the board said it found no evidence of company secrets being leaked. Plus, it reports earnings on the 17th next week, and AI money is still flowing its way.
post-image
NVDA-4.34%
Trenches
PIEVERSE
P
bade
b
PIEVERSE
0x0e...25a9
Market Cap
$.
Change
.
24h Vol
$.
Holders
.
牛逼
牛
bade
b
牛逼
0x96...7777
Market Cap
$.
Change
.
24h Vol
$.
Holders
.
ON
O
bade
b
ON
0x0e...1d48
Market Cap
$.
Change
.
24h Vol
$.
Holders
.
STONK
S
bade
b
STONK
6GmA...UNgx
Market Cap
$.
Change
.
24h Vol
$.
Holders
.
FLOAT
F
bade
b
FLOAT
Bv1a...BMmr
Market Cap
$.
Change
.
24h Vol
$.
Holders
.
What Is a Confusion Matrix? How Can You Understand the Exact Number of Correct and Incorrect Predictions Made by a Trading Model?

In crypto quantitative trading, a model may have a high accuracy rate, but that doesn’t tell us where it goes wrong. For example, a model may be good at identifying declines but frequently miss opportunities when prices rise. A Confusion Matrix compares predictions with actual outcomes, helping traders see exactly how the model performs.

First, what does a confusion matrix contain?

Taking the prediction of whether prices will rise in the next period as an example
post-image
Michael Saylor hints at new Bitcoin move, market awaits
Michael Saylor, Chairman of Strategy, just reposted a chart tracking the company’s Bitcoin purchases with the brief caption “Connecting the dots,” drawing market attention to the possibility that Strategy is about to announce a new transaction.
The chart shows that Strategy currently holds 849,327 BTC, with an average purchase price of approximately 75,446 USD/BTC. Based on the price of Bitcoin when the chart was shared, the company’s BTC holdings are worth approximately 64.44 billion USD.
⚠️ Personal market analysis only. NFA — manage ri
post-image
BTC-0.67%
What Is Time-Series Cross-Validation? Why Shouldn’t Crypto Predictions Randomly Shuffle the Training and Test Sets?

In crypto quantitative trading, machine learning models often need to be trained on historical data to predict future price movements. But if all the data is randomly shuffled and then split into training and test sets, as in a typical classification task, the chronological order may be disrupted, making the model’s evaluation results overly optimistic.

First, what is time-series cross-validation?

It is a method of organizing training and validation in chronological order. The
post-image
Soaring to $905! $SNDK surged overnight, leaving shorts completely stunned

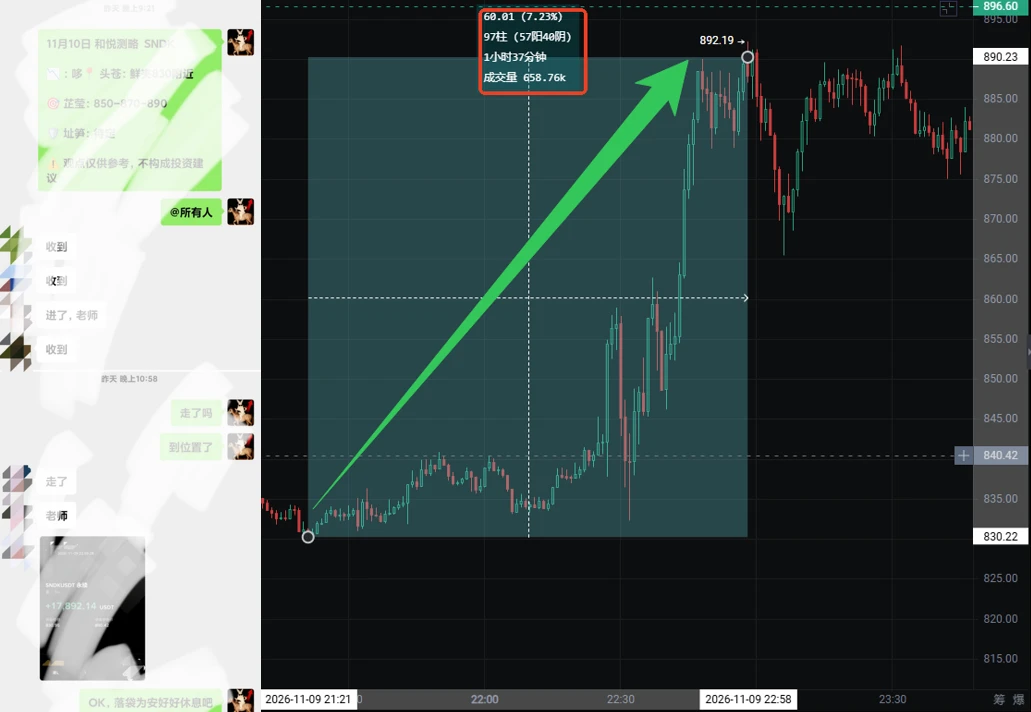
This guy works at a security booth during the day and makes one trade at night—no stress about life.

SanDisk surged to $905 intraday last night, sparked by one key factor: November NAND contract prices jumped 50%, far exceeding market expectations. The third price hike this year has fully ignited the memory sector. Morgan Stanley swiftly rated SNDK “Overweight,” while demand for high-performance flash memory from AI servers continues to soar. Supply is expected to remain tight at least through 2028. This isn’t a rebo
post-image
SNDK-0.18%
📈 AI tech stocks rebound strongly—who will lead the next wave?
Last week, AI tech stocks experienced sharp volatility, with popular stocks such as $NVDA and $AMD rebounding after steep pullbacks.
Will the rebound continue, or will they pull back again?

💬 Let's hear your take today:
If you had to pick one AI tech stock now, which one would you bet on? Share your pick and why you like it.

🌟 Gate Square's Stock Chat Season is underway
Three outstanding authors are selected daily, each receiving 5 USDT plus an official featured spot to give your investment insights more exposure.

Post your
NVDA-4.34%
AMD+13.35%
✨️💫 HYPE: the next reaction matters

🚨 The plotted path needs confirmation before it becomes convincing.

#HYPE has a conditional route lower on the 1H chart. Watch whether sellers can hold the rebound below resistance and break the nearest support.

Structure

• Patterns frame the visible price structure.
• Last closed price: 74.49.
• The curve illustrates a possible path with a pullback.

KEY LEVELS

Marked target: 66.6753
Resistance: 75.2032
Support: N/A

Reassess after a recovery above resistance followed by a retest that holds.

#ShareWeekly
#GateGlobalComplianceExpansion
$HYPE ‌
post-image
HYPE+0.33%
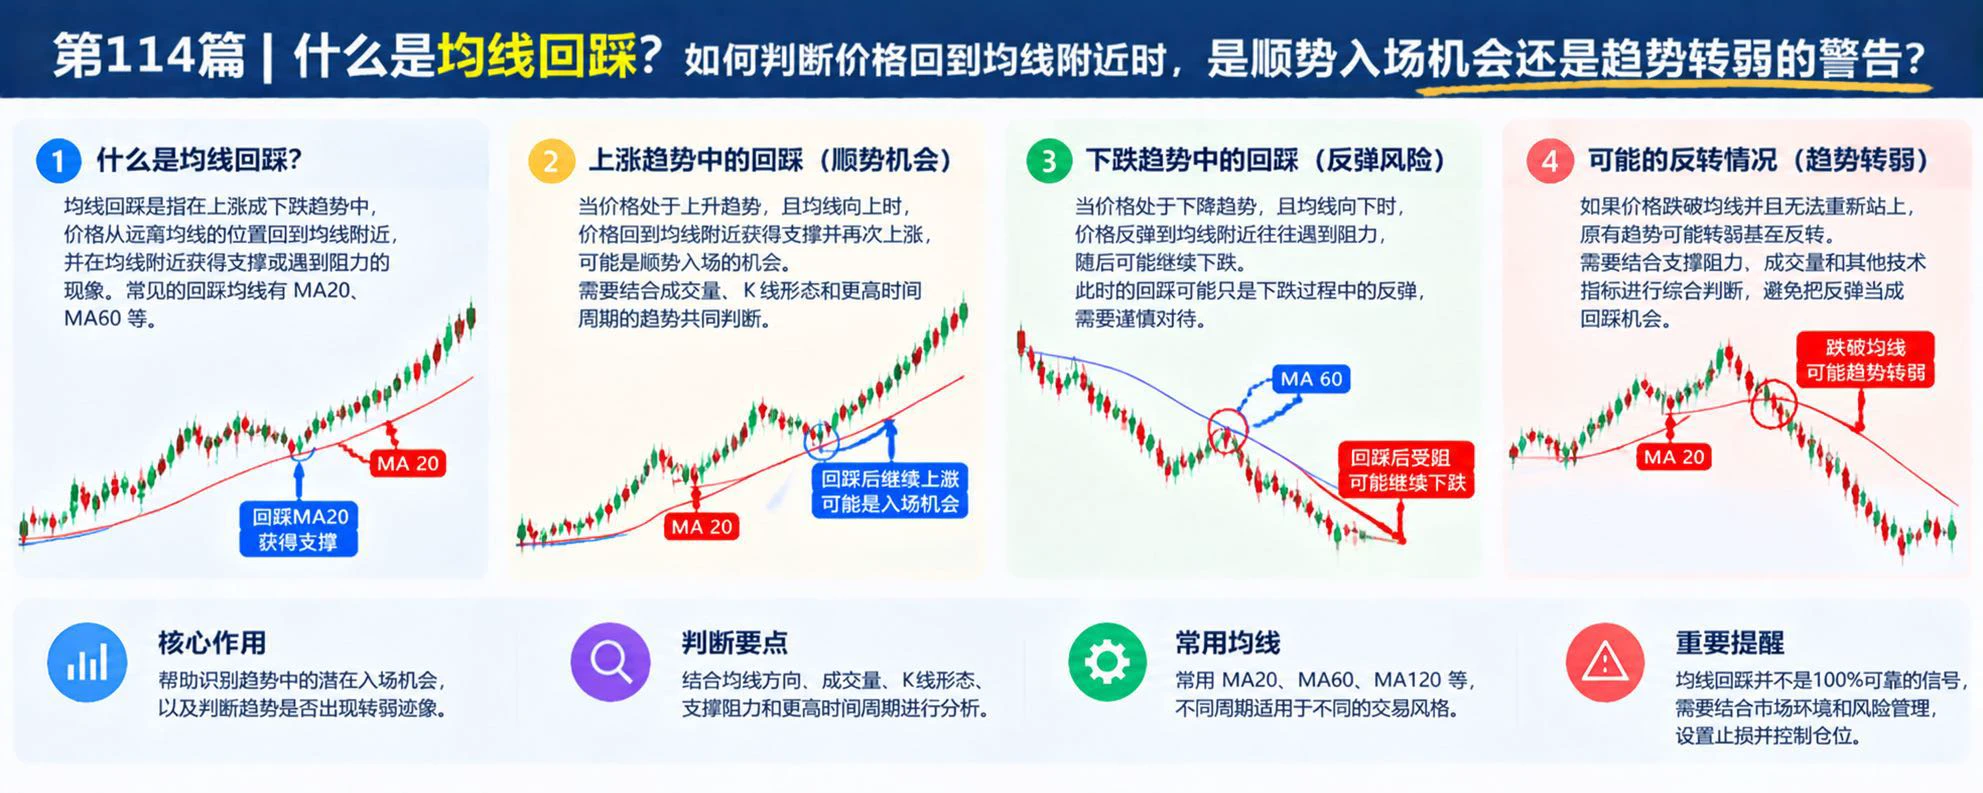
What Is Multi-Timeframe Analysis? How Can You Combine Short and Long Timeframes to Avoid Making Poor Decisions Based on Local Price Action?

In crypto trading, BTC may be rising on the 5-minute chart while still being in a clear downtrend on the 4-hour chart. If traders only watch short timeframes, they can mistake a rebound for a trend reversal. Multi-timeframe analysis uses price structures across different timeframes to help traders understand the relationship between local fluctuations and the broader trend.

First, what is multi-timeframe analysis?

It means observing multiple timeframes
post-image
BTC-0.67%
market update
live-cover
LIVE2,705
What Is Class Imbalance? Why Can Cryptocurrency Prediction Models Look Accurate Yet Have No Trading Value?

In cryptocurrency quantitative trading, a model’s accuracy can easily be misleading. If most periods in the test data do not feature a strong rise as defined, a model that always predicts “no rise” may still achieve high accuracy, yet fail to identify real trading opportunities. This is the problem caused by class imbalance.

First, what is class imbalance?

Class imbalance occurs when the number of samples in different classes varies greatly in a dataset. For example, only 100 out of 1,
post-image
I can't believe people voted for this guy to leade the labour party.
I'll tweet the $INT short level shortly. Waiting for one or two confirmations before sharing it.
We'll trade this level using our level trading strategy.
I'm giving you an early heads-up. If you're unfamiliar with level trading, check my pinned tweet first.
post-image
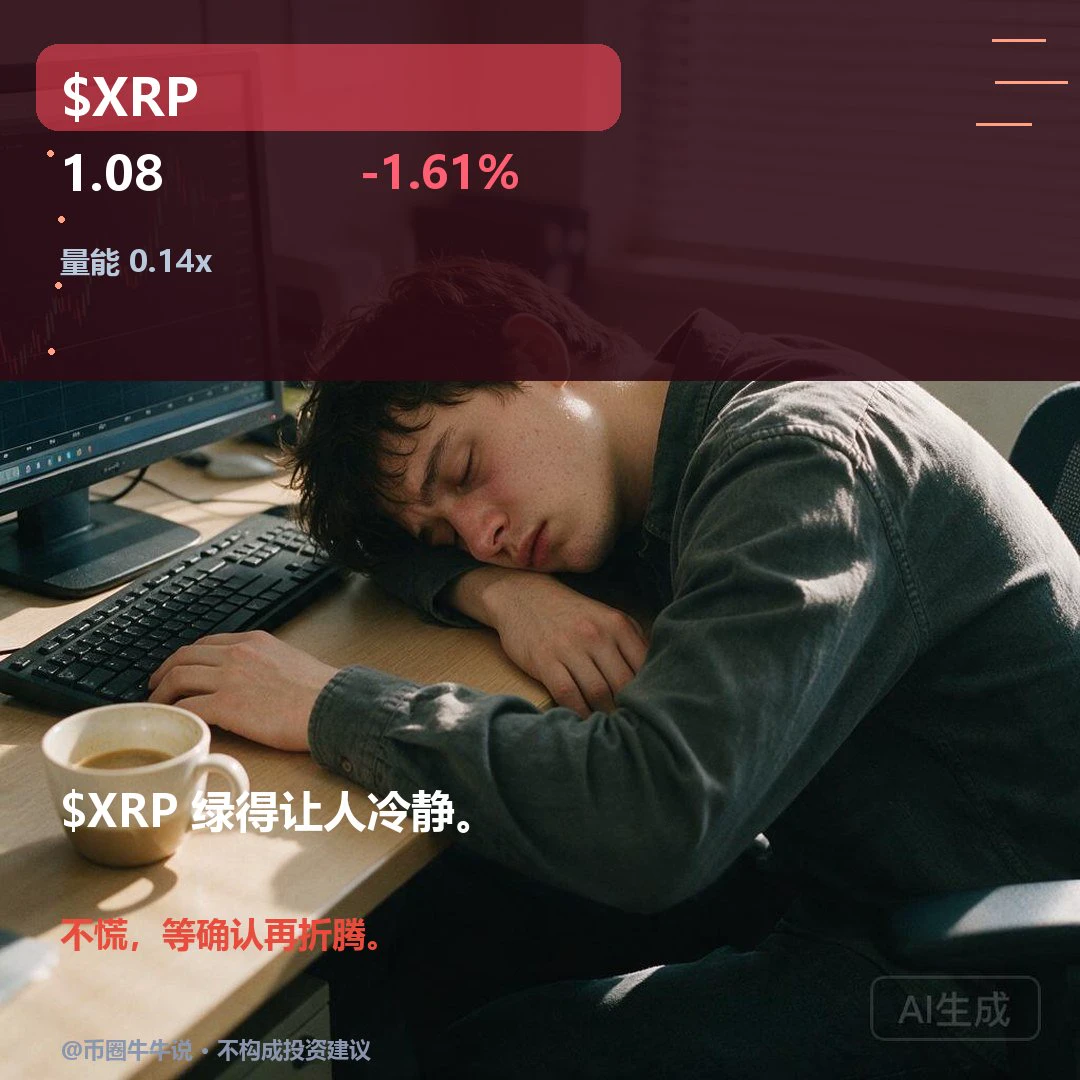
$XRP Currently trading at 1.0833, down 1.61% over 24H. Price remains under pressure below the EMA20 (1H 1.097/4H 1.129), and both the 1H and 4H structures look weak. RSI is 39.96 and 26.63, respectively, and the short-term rebound still looks weak. If price can later break above and hold the 1.1168 resistance on increased volume, watch for signs of recovery. If it breaks below the 1.0764 support and fails to reclaim it for some time, weakness may continue. In the next review, focus on whether price can hold above 1.1168. Current volume is only 0.14x the average of the last 20 bars, so a single
post-image
XRP-1.15%
The U.S. October CPI hasn’t been released yet tonight, and the probability of a Fed rate hike in December has surged to 90%—this rate hike is basically a done deal!
This is definitely a real bearish catalyst for U.S. stocks and Bitcoin, which will likely come under pressure in the short term.
I just hope this is the final rate hike of this cycle. Please! 🙏
BTC-0.67%
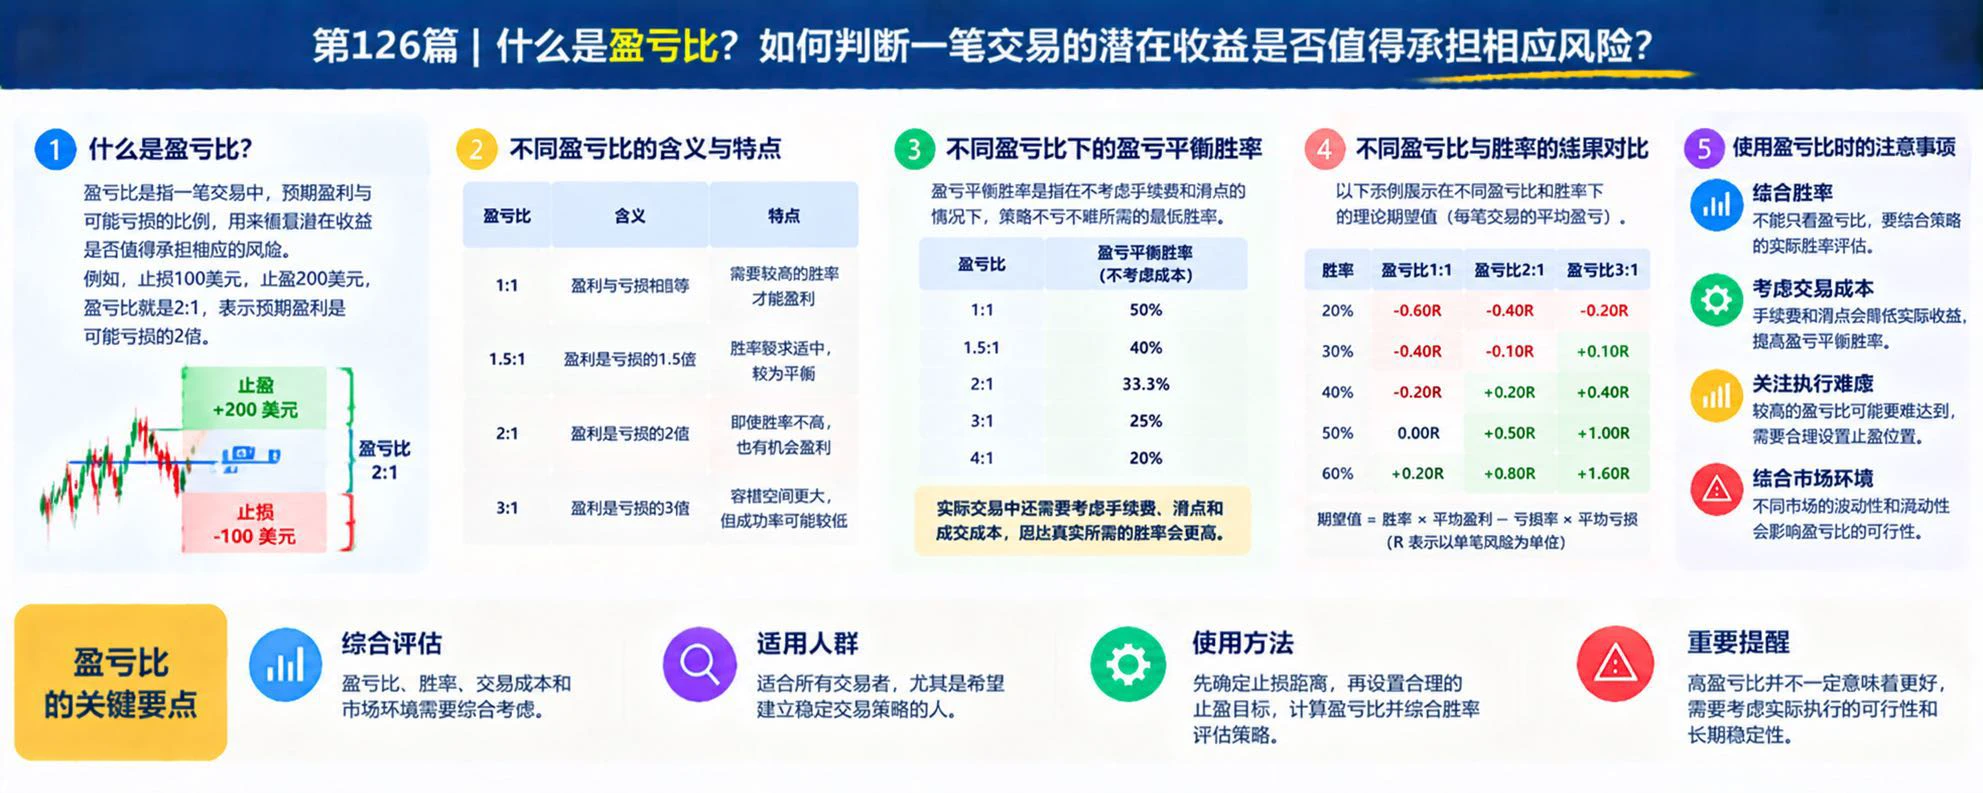
What Is the Risk-Reward Ratio? How High Does a Trade’s Win Rate Need to Be to Break Even?

In cryptocurrency trading, many people focus only on the price distance when setting stop-loss and take-profit levels, without carefully calculating the relationship between potential profit and potential loss. The Risk-Reward Ratio can help traders assess how much risk a trade is worth taking, but it must be considered together with the win rate to better evaluate a strategy.

First, what is the Risk-Reward Ratio?

The Risk-Reward Ratio typically compares a trade’s potential profit with its potential lo
post-image
What Is Backtest Overfitting? Why Might a Strategy With Perfect Historical Performance Fail Completely in Live Trading?

In cryptocurrency trading, some people keep adjusting indicator parameters, take-profit and stop-loss levels, and entry conditions until the strategy achieves the highest returns in backtests. But better historical performance does not necessarily mean a strategy is more reliable. Overfitting historical data may instead make a strategy less able to adapt to future markets.

First, what is backtest overfitting?

Backtest overfitting occurs when a strategy is excessively tailo
post-image
market oportunity
live-cover
LIVE1,808
What Is Data Leakage? How Does It Differ from Look-Ahead Bias, and How Can You Avoid Misjudging Machine Learning Trading Models?

In cryptocurrency quantitative trading, machine learning models may achieve high accuracy on a test set but perform poorly once deployed in live trading. The problem is sometimes not that the model is insufficiently complex, but that data leakage occurred during training and evaluation, indirectly giving the model information it should not have known.

First, what is data leakage?

Data leakage occurs when information that should not be used for the current predicti
post-image
Load More

Join 40 M users in our growing community

⚡️ Join 40 M users in the crypto craze discussion

💬 Engage with your favorite top creators

👍 See what interests you

Trending Topics

GateGlobalComplianceExpansion

24.88k Views194 Discussing

Gate continues to expand its global compliance footprint, now covering 81 regulated jurisdictions across Europe, North America, Asia, and Oceania. From MiCA and U.S. state-level MTLs to Japan’s FSA, Dubai, and Australia-related regulatory approvals, global exchanges are entering a new stage of compliance competition. Do you think regulatory strength will become as important as products and liquidity for exchanges in the future?

USCPIDataIncoming

53.79k Views2.28k Discussing

USIranTalksShowNewProgress

9.49k Views1.29k Discussing

View More