Share your thoughts
placeholder
Article
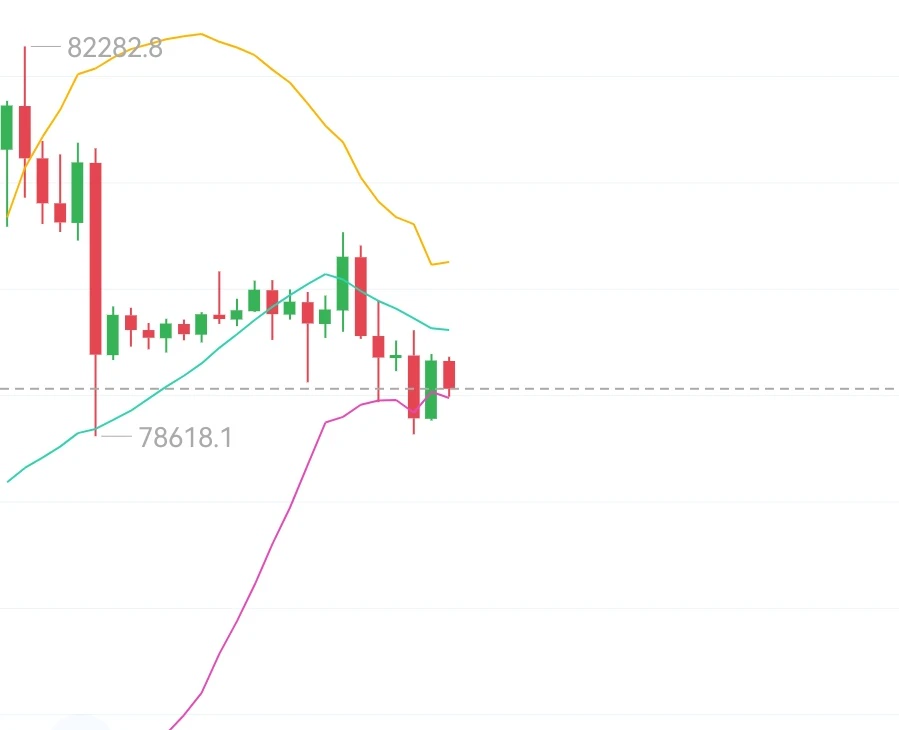
Yesterday morning, the price surged first. After breaking the parallel high and coming under downward pressure, it tested the previous hourly Bollinger lower band at 806 but failed, then fell back under pressure. During this period, the long trade gained 350 points, while the two short trades gained 450 and 600 points, respectively. The long position entered in the afternoon was trapped, but as mentioned in the morning, there was no one-sided move, and with no U.S. stock market open, the support at 786 would not break. The long position was decisively increased, and after returning to 793 at d
post-image
ETH-1.06%
BTC-1.42%
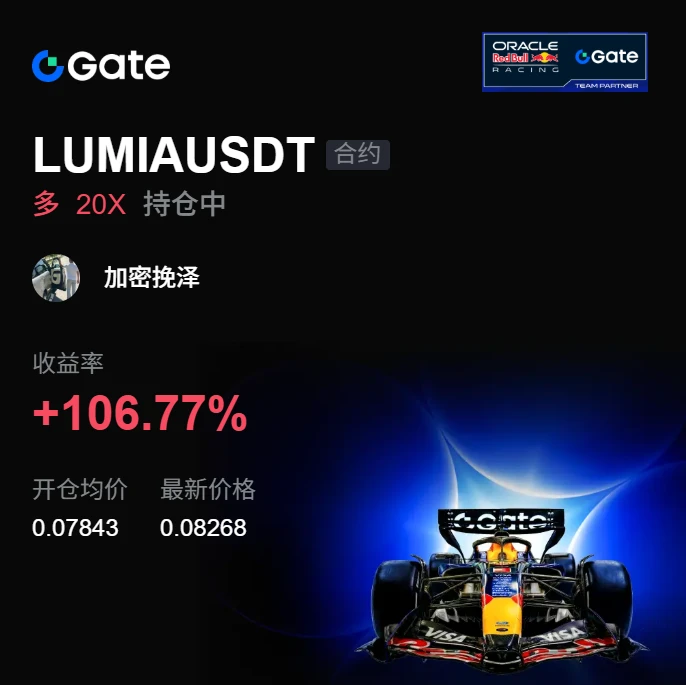
I originally wanted to sell at a loss as a sacrifice to the heavens, but the sacrifice never happened—the meat roasted itself. While everyone was still watching from the sidelines, I had already closely monitored the chart around 0.07843 for several rounds.
$LUMIA 's price action was textbook: sideways consolidation at the bottom without breaking down, gradually increasing volume, and funds quietly moving in. These were signs of major players accumulating, so I went long in advance.
After the price rose to 0.08268, the +106.77% gain was firmly locked in. It was truly sluggish at first, but the
post-image
LUMIA-0.66%
XRP-2.03%
ZEC-7.75%
$XLM /USDT is silently coiling for a move most traders will miss.

$XLM /USDT - SHORT

Trade Plan:
Entry: 0.19201 – 0.19341
SL: 0.19943
TP1: 0.18767
TP2: 0.18431
TP3: 0.17927

Why this setup?
Why now? The 1h price sits at 0.19277 inside a tight range, the 15m RSI reads 58.72 showing neither overbought nor oversold exhaustion, and the 1h ATR of 0.0028 confirms volatility is compressing before a directional burst. The daily trend is range-bound, which often precedes a sharp breakout, and the entry zone between 0.19201 and 0.19341 offers a precise trigger for a short bias. Targeting TP1 at 0.1
XLM+3.39%
Everyone watching $DOT /USDT for a bounce is about to be proven wrong.

$DOT /USDT - SHORT

Trade Plan:
Entry: 1.040 – 1.052
SL: 1.105
TP1: 1.001
TP2: 0.972
TP3: 0.927

Why this setup?
Why now? The daily trend is a range, which means a directional breakout is overdue and the 4h structure is primed for a move. The 1h ATR of 0.024781 confirms that volatility is expanding enough to fuel a leg down. With the 15m RSI at 38.35, momentum is already leaning bearish without being exhausted. The entry zone between 1.040 and 1.052 aligns with the 1h price of 1.046, giving a clean short setup. Target T
DOT+8.21%
Insiders are quietly fading silver above 66.34 while the 1h RSI sits at 50.33.

$XAG /USDT - SHORT

Trade Plan:
Entry: 66.28 – 66.40
SL: 66.91
TP1: 65.91
TP2: 65.63
TP3: 65.20

Why this setup?
Why now? The 4h bias favors a SHORT with 55% confidence, and the 1h ATR of 0.237301 tells us volatility is compressed enough for a clean move. The entry zone between 66.28 and 66.40 aligns with the 1h price at 66.34, giving a precise trigger for the short. TP1 at 65.91 and TP2 at 65.63 represent logical exhaustion points where range-bound sellers lose conviction. The daily trend being range confirms w
XAG+0.12%
Gate brings “Gold-Digging Dog” into the mainstream—Is Meme trading entering the social era?
This time, what I think is worth noting about Gate launching Gold-Digging Dog goes beyond 0 Gas.
Its official positioning is clear: Gold-Digging Dog focuses on a social trading ecosystem for Memes, and will support features such as Callout rankings, KOL rankings, and active account displays.
This means it is not merely a simple on-chain trading gateway, but is trying to bring “discovering trends” and “trading trends” into the same setting.
Previously, when we discovered a Meme coin, we might see someone
MEME-0.56%
  • 16
Nobody is talking about the quiet breakout forming in $PUMP /USDT right now.

$PUMP /USDT - LONG

Trade Plan:
Entry: 0.004373 – 0.004439
SL: 0.004087
TP1: 0.004645
TP2: 0.004805
TP3: 0.005044

Why this setup?
Why now? The daily trend is bullish, and the 1h ATR of 0.000133 signals volatile expansion that can carry price from the entry zone of 0.004373 to 0.004439 all the way to TP1 at 0.004645 and TP2 at 0.004805. The 15m RSI at 56.2 shows room to run before overbought, so the setup is still clean. The invalidation level of 0.004129 is the line in the sand that protects this trade. A breach
PUMP+9.82%
ethereum:native
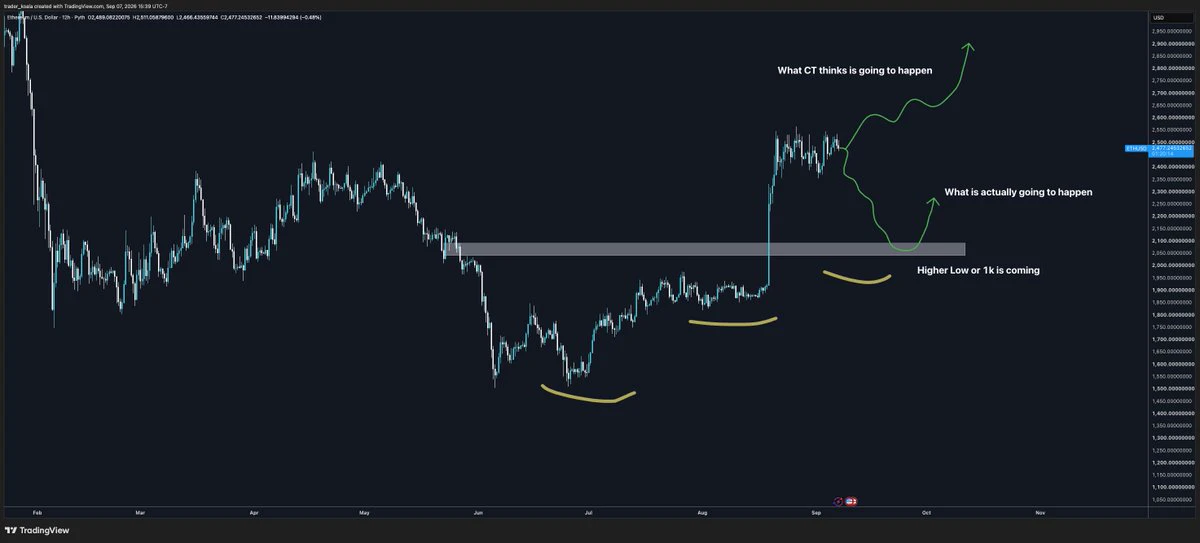
Higher low or one thousand US dollars
post-image
ETH-1.06%
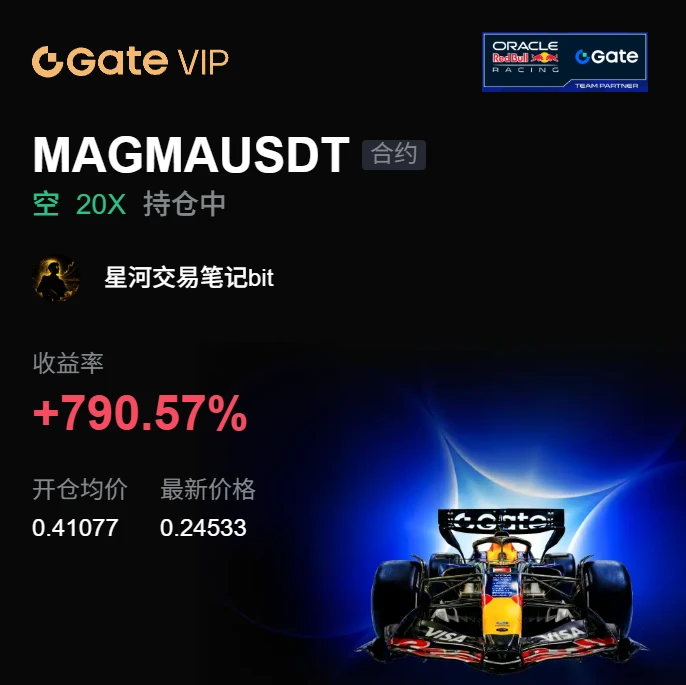
After a wick swept the stop-losses above, the market weakened directly, which usually means short-term long positions were shaken out. I did not rush into the first bearish candle; only after the rebound confirmed the breakdown did I add to the short position along with the structure.

The pullback confirmation process was shorter than expected. The rebound showed clear signs of stalling near the breakdown point, while the moving averages also turned downward from flat. After the lower edge of the range was breached, the pressure level shifted to the platform above.

This trade was managed o
post-image
ETH-1.07%
SOL-2.55%
$GBPUSD
Daily x H4
Could be a good meal.
GBPUSD+0.33%
[New Streamer] Market Prediction
live-cover
LIVE78
This was purely the market being in a good mood, casually tossing out some gold coins that happened to land right on my head.
I had just finished lunch and was checking the charts. The market was still dragging its feet, but I noticed funds quietly entering. Volume was expanding moderately while the price was still languishing at the lows—this setup felt like it was about to make a move.
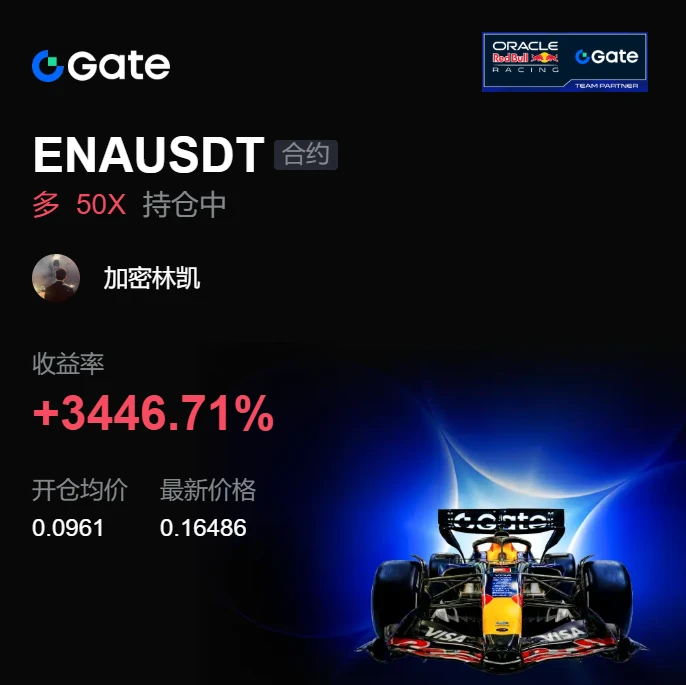
Then it took off directly: $ENA climbed from 0.09610 all the way to 0.16474, with returns reaching +3439.18%. It was truly sluggish at first, but the result was truly sweet.
I took profit on 80% and left 20% o
post-image
ENA-6.94%
ETH-1.07%
ADA-1.35%
Crypto Market and Trading Insights
live-cover
LIVE1,532
Don’t chase rallies or catch falling knives—can idle USDT also earn yield?
One of the biggest misconceptions in trading is believing that “not taking action means missing opportunities.”
When prices rise, people fear missing out; when they fall, they want to buy the dip. In the end, their account funds get repeatedly shuffled around. In fact, truly mature fund management sometimes means patiently waiting.
Gate Idle Money offers a relatively simple option: after enabling the feature, eligible stablecoins can automatically participate in yield generation without being locked up. The funds remain
  • 43
$SNDK /USDT is about to break a hidden range that most traders are ignoring right now.

$SNDK /USDT - SHORT

Trade Plan:
Entry: 1783.05 – 1786.59
SL: 1801.79
TP1: 1772.09
TP2: 1763.60
TP3: 1750.88

Why this setup?
Why now? The 1h price is pinned at 1784.82 inside a tight range on the daily trend, which means momentum is coiled and ready to snap. The 15m RSI reading of 46.33 shows just enough bearish lean to favor a short move over a bounce. With the 1h ATR at 7.07183, the average candle size is small enough that the entry zone between 1783.05 and 1786.59 offers a clean limit with room to br
SNDK-0.01%
The curse of good Robinhood filters
post-image
$Lobster fell 26.68% over 24 hours, yet its trading volume reached as high as $63.2 million. What does this data indicate? It indicates that bottom fishers are getting crushed more and more as the price falls, while the market makers are using liquidity to put on their final act for you. From the high of 0.0756 down to 0.0530, the trading range has exceeded 40%. This trend is not a shakeout but a classic distribution pattern. Catching a falling knife now means becoming a human ATM for smart money.
My trading advice is simple and blunt: 0.0544 is not the bottom. Watch 0.0480 for strong support;
龙虾-25.99%
XRP is about to break range and most traders are not ready for the move down.

$XRP /USDT - SHORT

Trade Plan:
Entry: 1.3938 – 1.3994
SL: 1.4231
TP1: 1.3767
TP2: 1.3635
TP3: 1.3436

Why this setup?
Why now? The daily trend is range, which often ends with a decisive break, and the 1h price is sitting at 1.3966 right at the entry zone of 1.3938 to 1.3994. The 15m RSI at 49.24 shows the market is neither overbought nor oversold, leaving room for a sharp directional push. The 1h ATR of 0.011034 means a single hour can easily cover the distance to TP1 at 1.3767 and TP2 at 1.3635 on a short bias.
XRP-2.03%
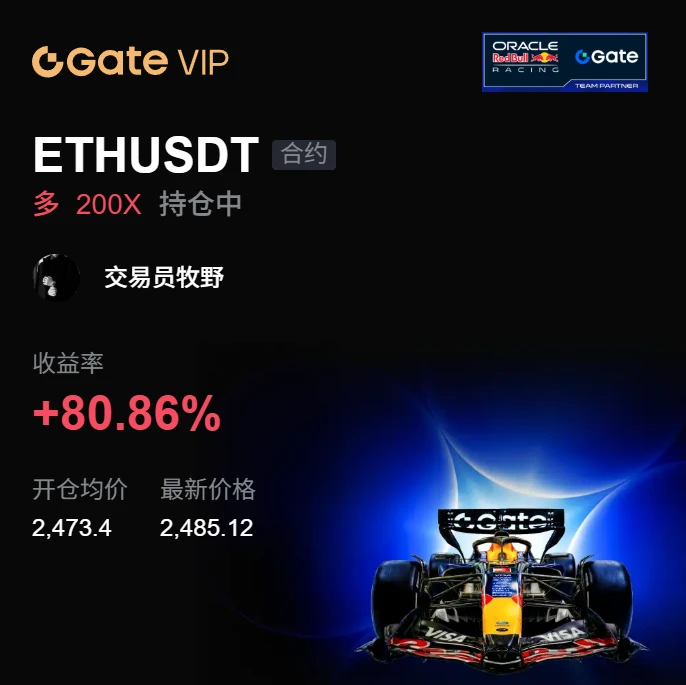
I didn’t do anything—just went to the restroom, and when I came back, the K-line had already done the work for me. I opened the chart in the morning: $ETH was bottoming out without breaking down, while volume was starting to recover. I saw that the incoming capital looked substantial, so I went long. When I came back, it had moved from 2473.40 to 2485.34, +82.61%. Feels great, brothers. This bite of profit was satisfying—those on board should have woken up laughing. In terms of execution: put the bulk into your pocket first, take 80% off the table, and move the stop-loss on the remaining 20% c
post-image
ETH-1.07%
LAB-2.57%
SOL-2.55%
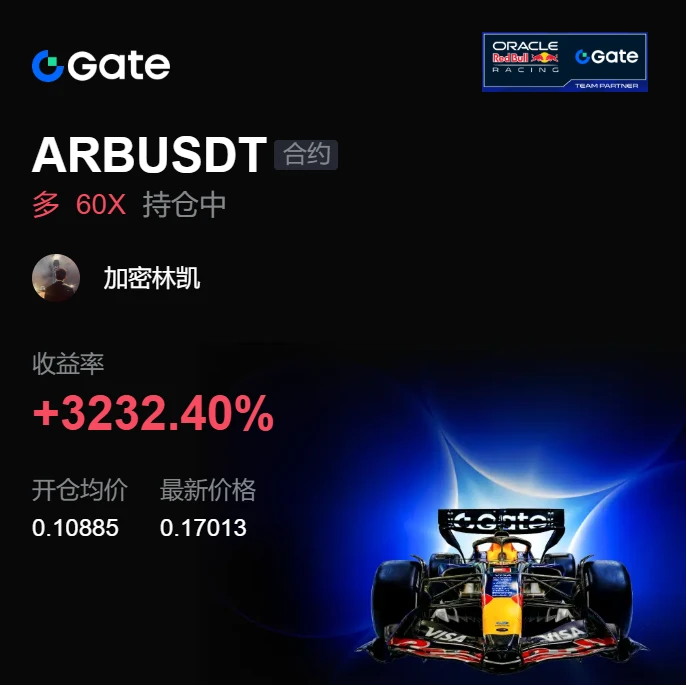
I did nothing—just went to the restroom, and when I came back, the candlestick chart had already done the work for me😳

During the repeated intraday swings, $ARB kept retesting 0.10885 without breaking below it, while volume failed to pick up. I judged that funds were accumulating at this level, so I directly opened a long position.

When I came back, the price had shot straight up to 0.17025, giving me +3232.92% in unrealized profit. This move gave us the answer, brothers🔥

First take profit on 80% and put the bulk of it in my pocket; move the stop loss on the remaining 20% to around the
post-image
ARB-11.04%
SOL-2.55%
BTC-1.42%
Load More

Join 40 M users in our growing community

⚡️ Join 40 M users in the crypto craze discussion

💬 Engage with your favorite top creators

👍 See what interests you

View More