Square
Following
Hot
News
Profile
Share your thoughts
placeholder
Article
Featured#GateXRedBullWinsSingaporeGP
Max won in Singapore, a street circuit where he’d never won before, and Red Bull swept the Sprint and the Grand Prix. I follow markets more than motorsport, but as a brand story this is exactly the kind of weekend a sponsor wants. Here’s my honest take.
1. The resurgence is real, but it’s only two races old
Max won in Malaysia a week earlier, his first win of the season, and now Singapore. Red Bull usually struggles on slow, bumpy street tracks, so this one means more. He even said the last few races felt a lot stronger. Two wins in two weekends is momentum, not y
post-image
The reality of financial markets is:
You cannot retain every option and capture the returns from every opportunity.
post-image
Michael Saylor sends another signal of increased BTC holdings! Strategy may continue its buying spre
live-cover
LIVE2,552
Before the data is released on Wednesday evening, the market is unlikely to see any major volatility. The real big move will have to wait until 8:30 p.m. Wednesday.
Over the next two days, focus on two levels for Bitcoin, the same range I’ve repeatedly mentioned recently: 840 on the upside and 820 on the downside. Only a break above 840 would signal that the bulls are beginning to strengthen, with the market potentially continuing higher; a break below 820 would signal that the bears are strengthening, potentially leading to a test of the previous low. So over the next two days, we only need t
BTC+0.69%
Yue Jie’s Macro Analysis|The Core Battleground in This Week’s Crypto Market
Yue Jie has always firmly believed, after years of reviewing the market: short-term major volatility in the crypto market is fundamentally a battle over macro expectations, with candlesticks merely reflecting the final outcome. This week enters a window packed with major data releases. Rather than staring at the charts and exhausting yourself with repeated indecision, it is better to understand the underlying logic and prepare response plans in advance.
10.14 20:30|CPI, this week’s core inflation benchmark
CPI measures
post-image
BTC+0.69%
ETH+2.04%
$BTW has something to it,
post-image
BTW+10.82%
The three US telecom giants lost over 50 billion in a single day, with the hardest-hit one down 13%—but the person on my list isn’t watching this.
Shuqin is doing a different calculation: the three combined are worth over 480 billion, while the rocket-building company he owns is worth 2.2 trillion. Even if it grew as large as Verizon, it would still be just a fraction of that pie.
That’s exactly what I look for in people: others calculate who will take whose job, while she calculates whether this price can hold up. I won’t vouch for her in the next wave.
Unlocks will take place for three conse
post-image
BTC+0.65%
$CKB shifts in the short term—why hasn’t the 4-hour chart conceded yet?
$CKB 24-hour +14.52%, current price 0.001688. On the surface, this is just another price move, but the real conflict is hidden in the timeframes: the 1-hour chart is weak, while the 4-hour chart is strong. When two charts give opposite answers, the least useful thing to do is pick the one you like and believe it completely.
Let’s pull the camera back to the 24-hour range: low 0.001457, high 0.002196. Where the current price of 0.001688 sits within this range will directly affect what the same signal means. Near the high, s
post-image
CKB+12.56%
BTC at $83,500—would you dare buy the dip?
From 126,000 down to 83,500, everyone is yelling “the bull market is dead,” but cumulative ETF net inflows stand at $57 billion, and whales haven’t fled. CPI is released tomorrow—is this ultimately the final dip, or the eve of a crash?
First, look at the surface: negative news is bombarding the market, but the price isn’t falling.
It has pulled back 33% from the ATH of 126,000, stayed weak over 7 days, but is still up 8% over 30 days. Over 24 hours, it has churned between 82,900 and 84,400, with the current price at 83,500, flat to slightly higher. Th
post-image
BTC+0.65%
ETH+2.04%
SOL+2.05%
ETH/USDT Technical Analysis and Monday Outlook
Current Price: $2,552.75
24h Range: $2,496.52 to $2,578.45
Weekly Chart Analysis
The weekly timeframe shows the price has recovered from the lower Bollinger Band at $1,355. The asset is currently trading above the middle Bollinger Band, which sits at $2,139. The upper band is located at $2,923, marking a long-term resistance level. The MACD indicator remains in negative territory, but the downward momentum is decreasing.
Daily Chart Analysis
On the daily chart, the price is trading below the middle Bollinger Band at $2,640. The recent local high w
KatyPaty
Tom Lee: Ethereum may break $5,000 by the end of the year, and this cycle is expected to hit $50,000.
Tom Lee said in an interview that Ethereum could rise to $25,000–$50,000 in this cycle and may exceed $5,000 by the end of the year. According to him, ETH has been trading in the same range for five years, and prolonged accumulation could form the basis for a major breakout. If Bitcoin rises above $100,000, ETH could reach approximately $7,500.
It is important to understand: this is a forecast, not a guarantee. Traders, according to the prediction market, estimate the probability of reaching $5,000 by the end of 2026 at just 4%.
Weekly chart (1W): price below the Bollinger middle band
On the weekly timeframe, ETH is trading around $2,501. The Bollinger middle band (MB) is at $2,110, the upper band (UB): $2,869, and the lower band (LB): $1,351.
The price is holding above the middle band, preserving the global uptrend, but it is still far from the upper channel boundary. MACD on the weekly chart: the histogram is positive (100.69), while the DIF and DEA lines are near the zero mark, indicating weak but not negative momentum. Weekly OBV is declining, indicating a lack of significant inflows on this timeframe.
Daily chart (1D): attempt to hold above support
The daily timeframe provides a more precise picture. The price of $2,501 is below the Bollinger middle band ($2,648), which technically indicates weakness. The upper band: $2,818, and the lower band: $2,478.
MACD on the daily chart: the histogram is negative (-35.59), but the DIF and DEA lines are converging—the downward momentum is slowing. Daily OBV is also declining, indicating that selling is prevailing. The nearest support is the lower Bollinger band at $2,478; resistance is the middle band at $2,648.
4-hour chart (4H): consolidation near the lower band
On the 4-hour timeframe, the price of $2,501 is slightly above the Bollinger middle band ($2,496). The bands are: UB — $2,548, LB — $2,444.
MACD on the 4H chart is only beginning to form: the histogram is slightly positive (8.02), while DIF (-27.02) and DEA (-35.05) remain in negative territory. This indicates a possible reversal, but there is no confirmation yet. 24-hour volume is 506.13K ETH, which is below average. OBV on the 4H chart is declining, confirming the absence of aggressive buying.
Conclusion
The technical picture on the ETH charts looks neutral and cautious. The price is trapped between support at $2,444–$2,478 and resistance at $2,548–$2,648. For Tom Lee’s scenario to materialize, the upper boundary of the daily Bollinger channel ($2,818) must be broken with rising volumes. For now, the market is in a consolidation phase, and the forecast remains just a forecast and nothing more.
#EthereumUpOver71%inQ3
$ETH ‌
repost-content-media
ETH+2.04%
  • 6
  • 1
#btc Massive weekly close and looking strong. Ideally a quick sweep down to build a larger weekly down wick, then up to new highs. If we close above blue supply and OTE from here we likely straight go for $90k+
post-image
BTC+0.65%
Great partners forge history together.
At the Singapore F1 Grand Prix, Gate joined Redbullracing, the Red Bull racing team, to witness a glorious moment. Verstappen calmly claimed the top spot, while Isack went all out, showcasing the strength and heritage of a top-tier team.
Behind every trophy lie trust, focus, and moving forward side by side. The story continues—at the next stop, we will keep winning! 💪
‍#F1新加坡 #RedbullRacing #Verstappen #GateVIP
post-image
  • 2
$UNI UNI/USD 1D timeframe: Is the bullish trend continuing?
am observing the price reaction of Uni at this level, which could be a turning point to resume the bullish trend.
It looks like the price has corrected wave 4 red and if price
prints above the green channel at 8.38, there is the early sign that the correction
of wave 4 red is completed.
However, stronger confidence obtained when price moves higher than 9.33 which acts as a strong confirmation point to establish that wave 4 is completed and the bullish trend continues with wave 5 red.
Invalidation: If price goes below 7.8, this conside
post-image
UNI+1.54%
Financial News, Crypto Updates, Real Trading Strategies
live-cover
LIVE1,453
Ether was where short sellers hurt most on Oct 11, with $22.6M of the $30.3M liquidated in $ETH coming from bets against it. The whole day's $136.2M still ran well below the 7 day average.
ETH+2.04%
  • 1
#ShareWeekly #WillYouBuyDipInKoreanStocks
Korean Stocks Plunge as Samsung and SK Hynix Slide. Is It Time to Buy the Dip?
South Korean equities opened the week with a sharp sell-off on Monday, October 12. The benchmark KOSPI plunged 3.65% to close at 6,384.24, marking its first close below 6,400 in roughly two months and its largest single-day drop in about a month. The tech-heavy KOSDAQ followed suit, tumbling 4.83% to 849.19.
The Damage in Semiconductors
The two memory-chip giants bore the brunt of the selling. Samsung Electronics fell 4.39% to close at 250,500 won, equivalent to approximat
post-image
KatyPaty
#ShareWeekly #WillYouBuyDipInKoreanStocks
Korean Stocks Plunge as Samsung and SK Hynix Slide. Is It Time to Buy the Dip?
South Korean equities opened the week with a sharp sell-off on Monday, October 12. The benchmark KOSPI plunged 3.65% to close at 6,384.24, marking its first close below 6,400 in roughly two months and its largest single-day drop in about a month. The tech-heavy KOSDAQ followed suit, tumbling 4.83% to 849.19.
The Damage in Semiconductors
The two memory-chip giants bore the brunt of the selling. Samsung Electronics fell 4.39% to close at 250,500 won, equivalent to approximately $187.60 at the current exchange rate of 1,335.1 won per dollar. SK Hynix dropped 4.52% to 1.6 million won, or roughly $1,198.50 in dollar terms. This decline occurred despite Samsung reporting record-breaking earnings, a fact that has puzzled many market participants.
What Drove the Sell-Off?
Several factors combined to pressure the market:
1. Foreign Selling: Foreign investors net sold approximately 2.02 trillion won on the day and have been net sellers for five consecutive sessions, offloading roughly 8.6 trillion won over that period.
2. Buyback Support Fading: Market analysts noted that Samsung and SK Hynix may have completed their treasury stock purchases, removing a key source of demand.
3. AI Profitability Concerns: During the Korean market holiday, doubts expanded in the U.S. about artificial intelligence profitability following news that OpenAI's annualized revenue was below market expectations.
4. Middle East Tensions and Inflation: Renewed Houthi attacks on Saudi Arabia's main airport pushed oil prices higher, fueling inflation concerns and complicating the Federal Reserve's policy outlook.
Is This a Buying Opportunity?
The bull case for accumulating Korean tech stocks on weakness rests on several points:
· Goldman Sachs views the KOSPI's divergence from the Philadelphia Semiconductor Index (SOX) as a positioning washout rather than a cycle top. The firm noted that forward earnings expectations remain solid, with HBM4 capacity ramp-up and equipment shortages expected to sustain AI infrastructure demand through 2028.
· Korean tech stocks are trading at multi-decade low valuations, which Goldman cited as a reason to accumulate high-conviction memory and tech leaders during significant discounts.
· Samsung's record earnings suggest the fundamental business remains strong, even as the stock price faces selling pressure.
The bear case, however, warrants consideration:
· Foreign outflows show no signs of reversing. Yuanta Securities analyst Lee Jae-won noted that "the biggest concern for the domestic market is not semiconductor earnings but foreign investor supply and demand".
· The KOSPI has broken below its 100-day moving average, a technically significant level, while the 200-day average barely holds.
· Valuation alone is not a catalyst. As one analyst put it, "solid fundamentals being confirmed and foreigners immediately returning to buy Korean stocks are separate issues".
Key Levels to Watch
· KOSPI Support: 6,300–6,350 (psychological and technical zone)
· Samsung Electronics:$183.50–$187.25
· SK Hynix: $1,161–$1,198.50
The Bottom Line
The Korean market is caught between strong semiconductor fundamentals and heavy foreign selling pressure. The sell-off appears driven more by positioning, macroeconomic headwinds, and a fading buyback catalyst than by any deterioration in the underlying chip cycle. For long-term investors, Goldman's thesis of a positioning washout rather than a structural top offers a compelling framework. However, the absence of a near-term catalyst for foreign inflows suggests patience may be required.
Would you buy the dip, or wait for confirmation of a bottom?
Not financial advice. Always do your own research.
repost-content-media
SK Hynix-4.52%
SKHY-0.91%
SKHYV-0.98%
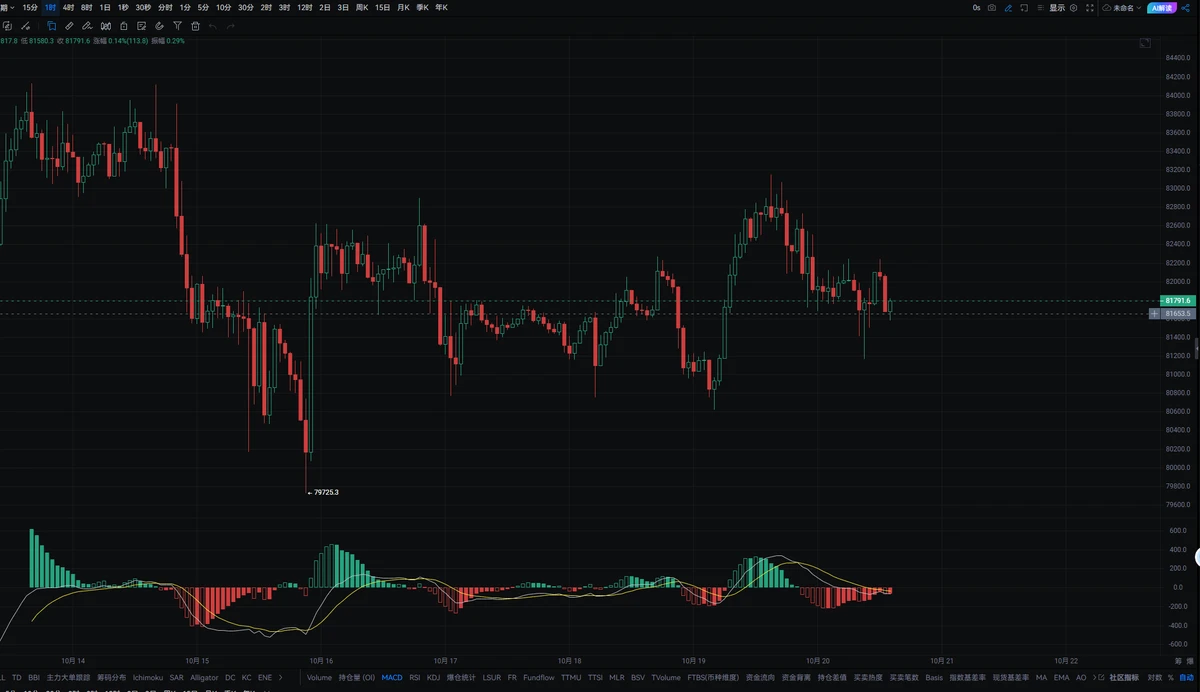
On Monday, the recovery remains strong, and the long bias continues!
From a technical perspective, the MACD is running below the zero axis. The histogram continues to shorten but has not turned red, indicating that bullish momentum has not yet fully recovered; the RSI is in the neutral zone at 45, showing that bullish and bearish forces are temporarily balanced. Short-term support is strong, making a rebound or consolidation highly likely. The price continues to fluctuate around the middle Bollinger Band, forming a typical triangle convergence pattern. The frequent appearance of long lower sha
post-image
BTC+0.65%
Third trade today
Didn’t hold positions for long today—basically took profits whenever possible. The daily chart broke above the high of the final downward move, but the short-term intraday trend is bearish, so take what you can get.
Entered short at 4185 and exited at 4176, 9 points, pocketing $873!#黄金 #伦敦金 $XAUUSD ‌
post-image
XAUUSD-0.41%
#每周来晒 — Share your weekly gains and make every effort more valuable!
In the ever-changing world of cryptocurrency, every week is a new opportunity to learn, grow, and make progress. Whether you are following market developments, studying blockchain technology, exploring Web3 innovations, or exchanging experiences with community members, every active participation can bring new inspiration.
For content creators, consistently sharing is not only a way to express themselves, but also an important process for accumulating experience, building a personal brand, and connecting with the community. Ev
Rahul Gandhi’s flip-flop is more entertaining than the election itself. He started by shouting, “I have ironclad evidence,” then turned around and said, “You prove your innocence.” Switching the burden of proof whenever it suits you is the same old tactic used in any market: spread the rumor first, then shift the blame. Position sizing is always more important than getting the direction right. People who speak with too much certainty are often the first to be proven wrong. Let’s see what happens next; maybe I’m wrong.
post-image
Load More

Join 40 M users in our growing community

⚡️ Join 40 M users in the crypto craze discussion

💬 Engage with your favorite top creators

👍 See what interests you

Trending Topics

GateWCTCS9GlobalTradingCompetition

34.94k Views5.29k Discussing

Gate WCTC S9 Global Trading Competition is officially live, crossing asset boundaries across crypto, stocks, and CFDs with an 8M USDT total prize pool. The Lucky Launchpad guarantees a win every time, new users get a 20 USDT futures voucher upon registration, and the Event Contract PK tournament features a prize pool of up to 400,000 USDT.[👉 Read announcement](https://www.gate.com/announcements/article/102133)

GateXRedBullWinsSingaporeGP

172.88k Views6.43k Discussing

WillYouBuyDipInKoreanStocks

61.35k Views1.77k Discussing

View More