










#Gate股票暢聊季 Nasdaq drops 5.28% in a single day, wiping out its gains for the year; Nvidia plunges 23% in a week as the AI boom faces a repricing
At Friday’s close, the Philadelphia Semiconductor Index fell 10.73% in a single day. Anthropic shares briefly dropped to $83.05 on their second day of trading, just 5 cents above their $83 offering price from the day before; they held at $88.91 at the close, down 8.5%, giving back most of their first-day gains. The selloff did not stop with the new listing. The Nasdaq Composite closed down 5.28% at 22617.73, wiping out its 2026 gains in one fell swoop; the S&P 500 fell 3.70% to 6910.39, and the Dow Jones Industrial Average dropped 1.93% to 48147.33. Both the S&P 500 and the Dow retreated more than 10% from their record closing highs, entering correction territory. The assets being liquidated were heavily concentrated in computing power, models, and the companies financing them. $4 trillion wiped out in a week. Over the past week, the Nasdaq fell about 10.02%, the S&P 500 dropped 8.61%, and the Dow lost 8.02%.
According to an international news agency, the Nasdaq and Dow suffered their biggest weekly declines since March 2020, while the S&P 500 had its worst weekly performance since April 2025. The split within the market was even more striking. The Philadelphia Semiconductor Index plunged about 10.7% on Friday alone, down a cumulative 43% from its June high; the Cboe Volatility Index rose to around 40 intraday, its highest level since April 2025; the 10-year U.S. Treasury yield fell to 4.91%, and gold dropped 3.02% to $3517.24.
By one estimate, the combined market capitalization of the “Magnificent Seven” tech stocks evaporated by more than $4 trillion in a month and a half, exceeding the size of France’s annual economy.
The market had initially seen November 19 as a turning point.
Under prior expectations, the company’s listing would be a litmus test for the AI trade: if it held up, capital would flow back into the sector. The official timeline was clear. On November 18, the company priced its shares at $83 each and offered 980 million shares to the public, above the $70–$78 indicated range; on November 19, its Class A common stock began trading on the Nasdaq Global Select Market under the ticker ANT, opening at $111.50, reaching an intraday high of $115.10, and closing at $97.17, up 17.07% from the offering price.
The November 20 closing announcement provided the full accounting: underwriters exercised their overallotment option in full, expanding the public offering to 1.127 billion shares and raising about $93.5 billion, of which about $91.6 billion went to the company; a concurrent $26 billion private placement was also completed, with AMD, Broadcom, Google, Micron, Microsoft, Nvidia, and TSMC among the seven subscribers. The public offering and private placement totaled about $119.5 billion.
There are three parts to the answer to why the largest IPO in history failed to support the market.
In terms of supply structure, 23.6486 million shares in the offering were sold by existing shareholders, and the company also allowed some current and former employees to immediately sell about 300 million shares. Another roughly 300 million shares will be unlocked on December 15, putting potential selling pressure in plain sight from the start.
In terms of allocation, a large portion went to institutions and major customers with a stronger inclination to hold long term, leaving the shares available to trade on the secondary market more concentrated. As for valuation benchmarks, the prospectus disclosed revenue of $33.24 billion for the first three quarters, about 12 times the year-earlier figure. Third-quarter revenue alone was $16.956 billion, with quarter-over-quarter growth slowing to about 47% from 144% in the second quarter; commitments signed over the same period for computing power and infrastructure purchases and leases totaled about $895.4 billion, including about $69.8 billion over the next 12 months. Revenue is growing rapidly, but committed spending far exceeds the proceeds of this offering—this is at the heart of the pricing dispute.
Some analysts have called this a buyer’s strike: those who received allocations do not want to add to their positions, while those who missed out would rather watch from the sidelines than take shares at the second day’s high. Demand is not absent; it was already used up during the offering.
Nvidia: leadership change, investigations, and its best earnings quarter
If Anthropic was the fuse, Nvidia was the amplifier of this selloff. The company faced three developments in a single week.
On November 12, Jensen Huang resigned as president, CEO, and board member, effective immediately. The board accepted his resignation on November 11, appointed CFO Colette Kress as interim CEO, and began the search for a permanent successor.
On November 17, Huang said publicly that he would be willing to return if the board believed it was in everyone’s best interests; on the same day, during the earnings call, the board chair made clear that a reappointment was not under consideration.
On November 19, Moody’s lowered Nvidia’s rating outlook from positive to stable, citing the sudden departure of a key executive and the lack of a succession plan.
On November 20, an international news agency reported that the U.S. Securities and Exchange Commission was investigating potential accounting issues at Nvidia, while the Justice Department was also reviewing its acquisition of open-source platform Hugging Face; both the SEC and Nvidia declined to comment.
It should be noted that a regulatory investigation does not itself mean wrongdoing has been established. Alongside these reports was an earnings release that was not hard to like. In the quarter ended October 25, the company’s growth and product roadmap remained on track. Chuck Carlson, CEO of Horizon Investment Services, said this could be one of the best quarters in corporate earnings history, with the company doing everything right.
The market nevertheless applied a different formula: shares closed down 14% Friday at $125.50, falling for a seventh consecutive trading day; they lost about 23% for the week, their biggest weekly decline since October 2008, wiping out nearly $900 billion in market value. Based on Friday’s close, market capitalization stood at about $3.03 trillion, putting Nvidia fourth among U.S. stocks behind Apple, Microsoft, and Alphabet; the stock had fallen about 48% from its October 6 high of $243.40, erasing about $2.7 trillion in value from its peak.
Has the bubble burst, or are prices being reset?
Professional investors offered different interpretations of the market action that day.
The first interpretation is that risk is spreading.
Massimo Santicchia, head of U.S. equities at Procyon, said this is no longer just a valuation-driven pullback; it is broadening, and the market is clearly in risk-off mode. Carsten Hesse, an analyst at Berenberg, put it more bluntly: incremental buying that had supported high-flying tech stocks is rapidly disappearing.
The second interpretation is that the hoped-for sentiment washout failed.
Chuck Carlson said that, like many investors, he had expected Anthropic’s listing to serve as a sentiment-clearing event, releasing all at once the doubts weighing on the AI trade, but that did not happen.
Interactive Brokers’ Steve Sosnick summed it up as a massive repricing: the market had been extremely bullish on AI and is now repricing risk.
The third interpretation comes from market positioning.
Goldman Sachs’ trading desk said the firm’s panic index had risen to 9 out of 10; over the past month, momentum traders, including commodity trading advisers, had sold about $57 billion in equities and had turned their U.S. equity positions into net shorts of about $19 billion. If the market continues to fall, these strategies could sell another roughly $80.6 billion. The firm wrote in a report that many investors had expected the world’s largest IPO to serve as a clearing event and lift risk appetite toward year-end; without that force, the market would struggle to digest the selling. The warnings from value investors came earlier.
When asked in August whether he saw signs of a bubble, Bridgewater founder Ray Dalio answered “yes” three times and compared the current state to 80% of the peak of the 1929 and 2000 bubbles. He said only two things could truly burst the bubble: rising interest rates and a surge in stock issuance.
Citadel founder Ken Griffin said in October that investors were almost certainly in an AI bubble; Michael Burry, known for short selling, doubled his put options on the Nasdaq 100 and called this a bull-market trap.
Taken together, these views do not disagree on whether the technology is real.
Nvidia’s side is right: chips are being delivered, data centers are being built, and the demand is real.
Dalio’s side is right too: real demand does not mean that any price is justified. The dispute is over one thing: have prices already priced in a decade of growth?
The IPO window, financing costs, and the next in line
The first to feel this repricing are comparable companies that have yet to go public. OpenAI confidentially filed to go public on June 8 and confirmed in September that it had pushed the window back to 2027; its most recent private funding round valued it at $852 billion. Foreign media have reported that the company is in talks to raise about $30 billion in a private round at a valuation of about $1.2 trillion. Delaying its listing is itself a vote on the secondary market’s ability to absorb shares. SpaceX, already public, offers a point of comparison. The company listed in June with a base offering of $75 billion, rising to about $86.25 billion after the overallotment option was exercised, at a listing valuation of about $1.77 trillion; its share price stayed below the offering price for an extended period after listing. The two companies have this in common: the secondary market has yet to fully accept the prices set by the primary market. Pressure also reached the most heavily leveraged parts of the market.
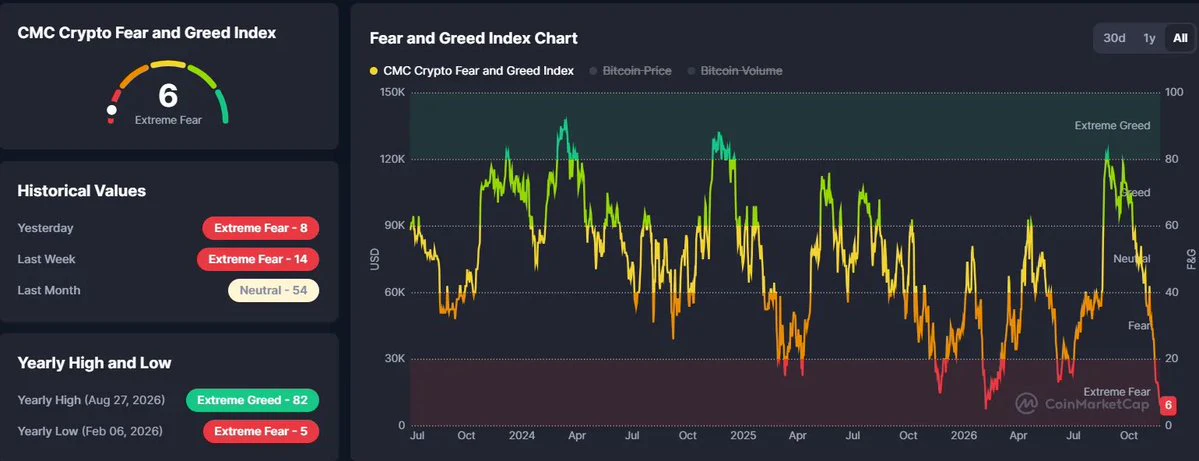
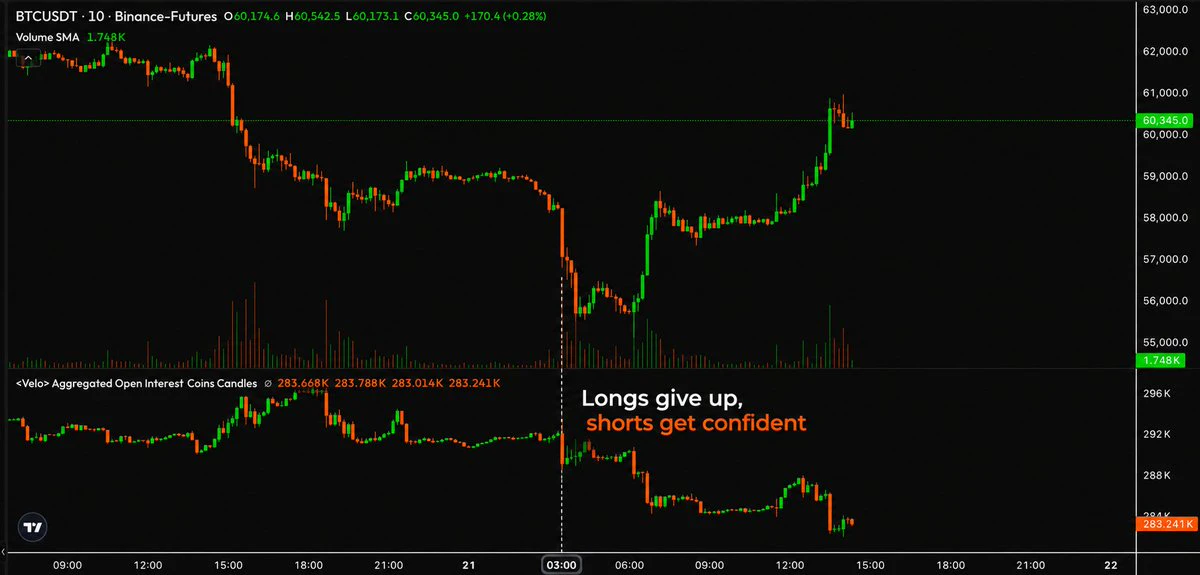
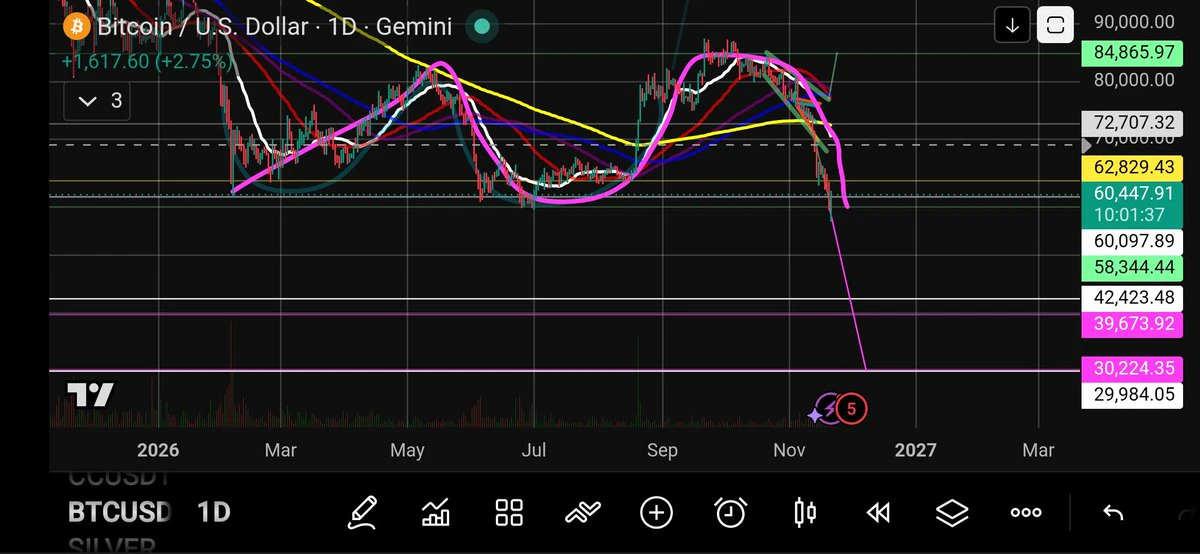
Crypto data firms estimated that about 271,500 accounts were liquidated across the market over the past 24 hours, with liquidations totaling about $1.79 billion. Goldman’s basket of popular retail stocks and its basket of Bitcoin-sensitive stocks fell 8.9% and 11%, respectively; institutional portfolios were not the only ones hit.
First, a one-day decline does not equal a trend. The Nasdaq wiped out its 2026 gains, but its cumulative gains over the preceding year and more were far greater than this week’s losses. Reading one bout of liquidation as the end of AI is mistaking price fluctuations for the direction of an industry.
Second, a regulatory investigation does not mean wrongdoing has been established. The SEC and Justice Department actions remain at the investigation and review stages, and many such investigations ultimately do not result in enforcement action.
Third, Anthropic’s net loss needs to be broken down. Of its $23.29 billion net loss in the third quarter, about $21.9 billion came from changes in the fair value of convertible debt, derivative liabilities, and SAFEs, all non-cash items; its operating loss under U.S. GAAP for the same period was $567 million. The nature of a loss and a cash crunch are two different things.
Fourth, both accounting methods and interest rates can change the conclusion. Anthropic’s market capitalization can be calculated on an issued-share or fully diluted basis: about $1.27 trillion under the former and about $1.75 trillion under the latter, a difference of nearly 40%. Without specifying the basis, it is easy to reach opposite conclusions. Interest rates are the other half of the pricing equation: the 10-year yield fell on Friday, showing that capital was also buying safe-haven assets. If rate-hike expectations pick up again, valuation pressure will return.
Three conclusions can be drawn. This was a concentrated liquidation centered on AI assets, not indiscriminate selling across the entire market; the trigger was a historic IPO’s failure to meet expectations, compounded by uncertainty surrounding a leading company; what changed was the way prices are set, shifting from paying for growth to paying for returns.
Whether the AI boom is over will not be answered by this week’s candlestick chart, but by the gap between capital expenditure and revenue over the next four quarters.
At Friday’s close, the Philadelphia Semiconductor Index fell 10.73% in a single day. Anthropic shares briefly dropped to $83.05 on their second day of trading, just 5 cents above their $83 offering price from the day before; they held at $88.91 at the close, down 8.5%, giving back most of their first-day gains. The selloff did not stop with the new listing. The Nasdaq Composite closed down 5.28% at 22617.73, wiping out its 2026 gains in one fell swoop; the S&P 500 fell 3.70% to 6910.39, and the Dow Jones Industrial Average dropped 1.93% to 48147.33. Both the S&P 500 and the Dow retreated more than 10% from their record closing highs, entering correction territory. The assets being liquidated were heavily concentrated in computing power, models, and the companies financing them. $4 trillion wiped out in a week. Over the past week, the Nasdaq fell about 10.02%, the S&P 500 dropped 8.61%, and the Dow lost 8.02%.
According to an international news agency, the Nasdaq and Dow suffered their biggest weekly declines since March 2020, while the S&P 500 had its worst weekly performance since April 2025. The split within the market was even more striking. The Philadelphia Semiconductor Index plunged about 10.7% on Friday alone, down a cumulative 43% from its June high; the Cboe Volatility Index rose to around 40 intraday, its highest level since April 2025; the 10-year U.S. Treasury yield fell to 4.91%, and gold dropped 3.02% to $3517.24.
By one estimate, the combined market capitalization of the “Magnificent Seven” tech stocks evaporated by more than $4 trillion in a month and a half, exceeding the size of France’s annual economy.
The market had initially seen November 19 as a turning point.
Under prior expectations, the company’s listing would be a litmus test for the AI trade: if it held up, capital would flow back into the sector. The official timeline was clear. On November 18, the company priced its shares at $83 each and offered 980 million shares to the public, above the $70–$78 indicated range; on November 19, its Class A common stock began trading on the Nasdaq Global Select Market under the ticker ANT, opening at $111.50, reaching an intraday high of $115.10, and closing at $97.17, up 17.07% from the offering price.
The November 20 closing announcement provided the full accounting: underwriters exercised their overallotment option in full, expanding the public offering to 1.127 billion shares and raising about $93.5 billion, of which about $91.6 billion went to the company; a concurrent $26 billion private placement was also completed, with AMD, Broadcom, Google, Micron, Microsoft, Nvidia, and TSMC among the seven subscribers. The public offering and private placement totaled about $119.5 billion.
There are three parts to the answer to why the largest IPO in history failed to support the market.
In terms of supply structure, 23.6486 million shares in the offering were sold by existing shareholders, and the company also allowed some current and former employees to immediately sell about 300 million shares. Another roughly 300 million shares will be unlocked on December 15, putting potential selling pressure in plain sight from the start.
In terms of allocation, a large portion went to institutions and major customers with a stronger inclination to hold long term, leaving the shares available to trade on the secondary market more concentrated. As for valuation benchmarks, the prospectus disclosed revenue of $33.24 billion for the first three quarters, about 12 times the year-earlier figure. Third-quarter revenue alone was $16.956 billion, with quarter-over-quarter growth slowing to about 47% from 144% in the second quarter; commitments signed over the same period for computing power and infrastructure purchases and leases totaled about $895.4 billion, including about $69.8 billion over the next 12 months. Revenue is growing rapidly, but committed spending far exceeds the proceeds of this offering—this is at the heart of the pricing dispute.
Some analysts have called this a buyer’s strike: those who received allocations do not want to add to their positions, while those who missed out would rather watch from the sidelines than take shares at the second day’s high. Demand is not absent; it was already used up during the offering.
Nvidia: leadership change, investigations, and its best earnings quarter
If Anthropic was the fuse, Nvidia was the amplifier of this selloff. The company faced three developments in a single week.
On November 12, Jensen Huang resigned as president, CEO, and board member, effective immediately. The board accepted his resignation on November 11, appointed CFO Colette Kress as interim CEO, and began the search for a permanent successor.
On November 17, Huang said publicly that he would be willing to return if the board believed it was in everyone’s best interests; on the same day, during the earnings call, the board chair made clear that a reappointment was not under consideration.
On November 19, Moody’s lowered Nvidia’s rating outlook from positive to stable, citing the sudden departure of a key executive and the lack of a succession plan.
On November 20, an international news agency reported that the U.S. Securities and Exchange Commission was investigating potential accounting issues at Nvidia, while the Justice Department was also reviewing its acquisition of open-source platform Hugging Face; both the SEC and Nvidia declined to comment.
It should be noted that a regulatory investigation does not itself mean wrongdoing has been established. Alongside these reports was an earnings release that was not hard to like. In the quarter ended October 25, the company’s growth and product roadmap remained on track. Chuck Carlson, CEO of Horizon Investment Services, said this could be one of the best quarters in corporate earnings history, with the company doing everything right.
The market nevertheless applied a different formula: shares closed down 14% Friday at $125.50, falling for a seventh consecutive trading day; they lost about 23% for the week, their biggest weekly decline since October 2008, wiping out nearly $900 billion in market value. Based on Friday’s close, market capitalization stood at about $3.03 trillion, putting Nvidia fourth among U.S. stocks behind Apple, Microsoft, and Alphabet; the stock had fallen about 48% from its October 6 high of $243.40, erasing about $2.7 trillion in value from its peak.
Has the bubble burst, or are prices being reset?
Professional investors offered different interpretations of the market action that day.
The first interpretation is that risk is spreading.
Massimo Santicchia, head of U.S. equities at Procyon, said this is no longer just a valuation-driven pullback; it is broadening, and the market is clearly in risk-off mode. Carsten Hesse, an analyst at Berenberg, put it more bluntly: incremental buying that had supported high-flying tech stocks is rapidly disappearing.
The second interpretation is that the hoped-for sentiment washout failed.
Chuck Carlson said that, like many investors, he had expected Anthropic’s listing to serve as a sentiment-clearing event, releasing all at once the doubts weighing on the AI trade, but that did not happen.
Interactive Brokers’ Steve Sosnick summed it up as a massive repricing: the market had been extremely bullish on AI and is now repricing risk.
The third interpretation comes from market positioning.
Goldman Sachs’ trading desk said the firm’s panic index had risen to 9 out of 10; over the past month, momentum traders, including commodity trading advisers, had sold about $57 billion in equities and had turned their U.S. equity positions into net shorts of about $19 billion. If the market continues to fall, these strategies could sell another roughly $80.6 billion. The firm wrote in a report that many investors had expected the world’s largest IPO to serve as a clearing event and lift risk appetite toward year-end; without that force, the market would struggle to digest the selling. The warnings from value investors came earlier.
When asked in August whether he saw signs of a bubble, Bridgewater founder Ray Dalio answered “yes” three times and compared the current state to 80% of the peak of the 1929 and 2000 bubbles. He said only two things could truly burst the bubble: rising interest rates and a surge in stock issuance.
Citadel founder Ken Griffin said in October that investors were almost certainly in an AI bubble; Michael Burry, known for short selling, doubled his put options on the Nasdaq 100 and called this a bull-market trap.
Taken together, these views do not disagree on whether the technology is real.
Nvidia’s side is right: chips are being delivered, data centers are being built, and the demand is real.
Dalio’s side is right too: real demand does not mean that any price is justified. The dispute is over one thing: have prices already priced in a decade of growth?
The IPO window, financing costs, and the next in line
The first to feel this repricing are comparable companies that have yet to go public. OpenAI confidentially filed to go public on June 8 and confirmed in September that it had pushed the window back to 2027; its most recent private funding round valued it at $852 billion. Foreign media have reported that the company is in talks to raise about $30 billion in a private round at a valuation of about $1.2 trillion. Delaying its listing is itself a vote on the secondary market’s ability to absorb shares. SpaceX, already public, offers a point of comparison. The company listed in June with a base offering of $75 billion, rising to about $86.25 billion after the overallotment option was exercised, at a listing valuation of about $1.77 trillion; its share price stayed below the offering price for an extended period after listing. The two companies have this in common: the secondary market has yet to fully accept the prices set by the primary market. Pressure also reached the most heavily leveraged parts of the market.
Crypto data firms estimated that about 271,500 accounts were liquidated across the market over the past 24 hours, with liquidations totaling about $1.79 billion. Goldman’s basket of popular retail stocks and its basket of Bitcoin-sensitive stocks fell 8.9% and 11%, respectively; institutional portfolios were not the only ones hit.
First, a one-day decline does not equal a trend. The Nasdaq wiped out its 2026 gains, but its cumulative gains over the preceding year and more were far greater than this week’s losses. Reading one bout of liquidation as the end of AI is mistaking price fluctuations for the direction of an industry.
Second, a regulatory investigation does not mean wrongdoing has been established. The SEC and Justice Department actions remain at the investigation and review stages, and many such investigations ultimately do not result in enforcement action.
Third, Anthropic’s net loss needs to be broken down. Of its $23.29 billion net loss in the third quarter, about $21.9 billion came from changes in the fair value of convertible debt, derivative liabilities, and SAFEs, all non-cash items; its operating loss under U.S. GAAP for the same period was $567 million. The nature of a loss and a cash crunch are two different things.
Fourth, both accounting methods and interest rates can change the conclusion. Anthropic’s market capitalization can be calculated on an issued-share or fully diluted basis: about $1.27 trillion under the former and about $1.75 trillion under the latter, a difference of nearly 40%. Without specifying the basis, it is easy to reach opposite conclusions. Interest rates are the other half of the pricing equation: the 10-year yield fell on Friday, showing that capital was also buying safe-haven assets. If rate-hike expectations pick up again, valuation pressure will return.
Three conclusions can be drawn. This was a concentrated liquidation centered on AI assets, not indiscriminate selling across the entire market; the trigger was a historic IPO’s failure to meet expectations, compounded by uncertainty surrounding a leading company; what changed was the way prices are set, shifting from paying for growth to paying for returns.
Whether the AI boom is over will not be answered by this week’s candlestick chart, but by the gap between capital expenditure and revenue over the next four quarters.