
Square
Following
Hot
News
Profile
Share your thoughts
placeholder
Article
dogecoin:native /hourly
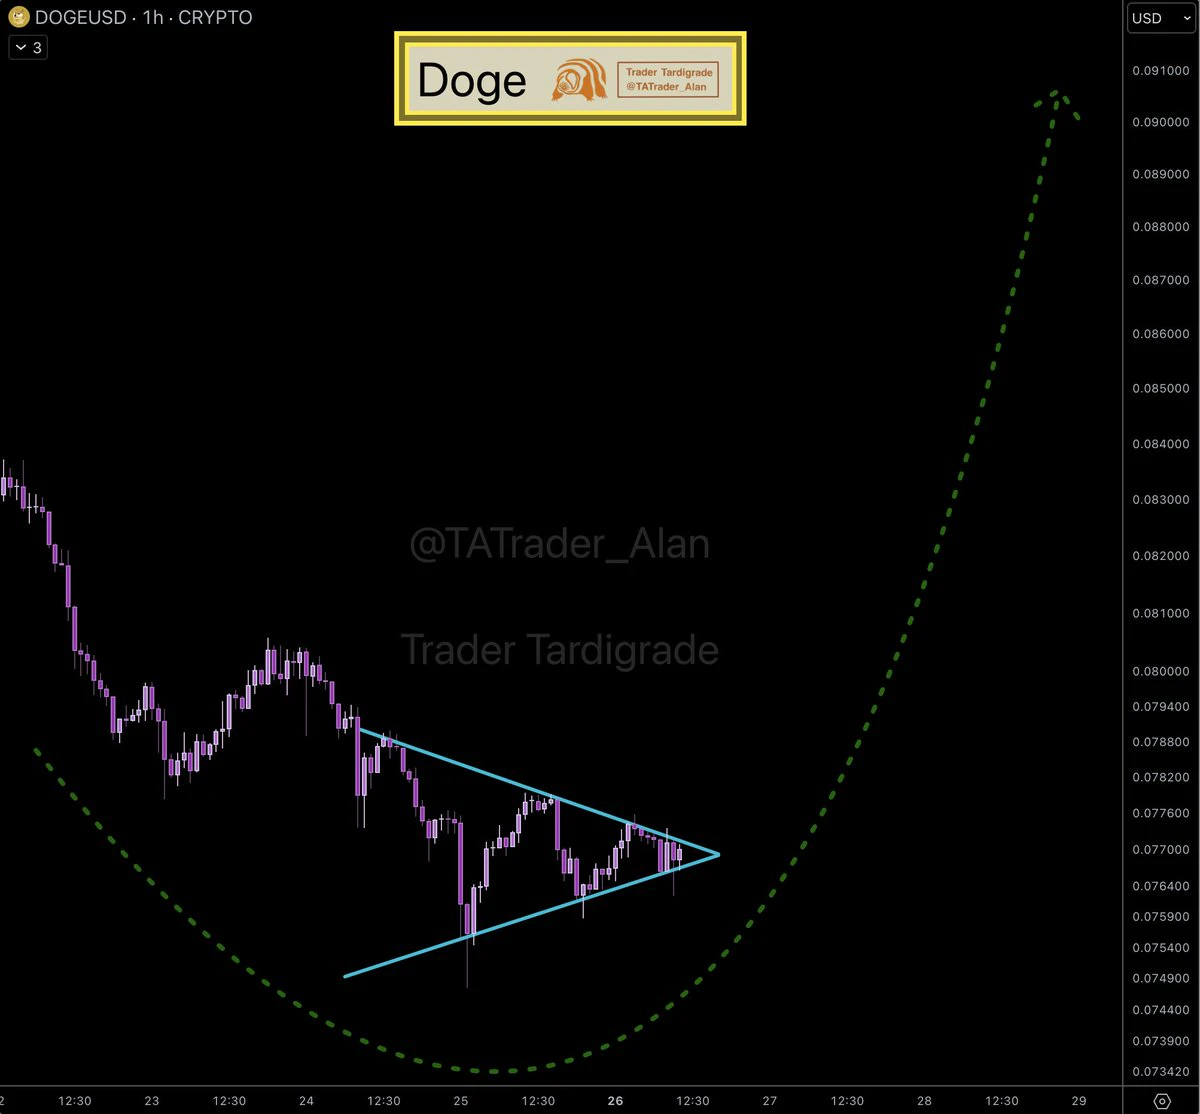
Is #Dogecoin going to end up the downtrend with a Symmetrical Triangle? 👀
post-image
DOGE-2.09%
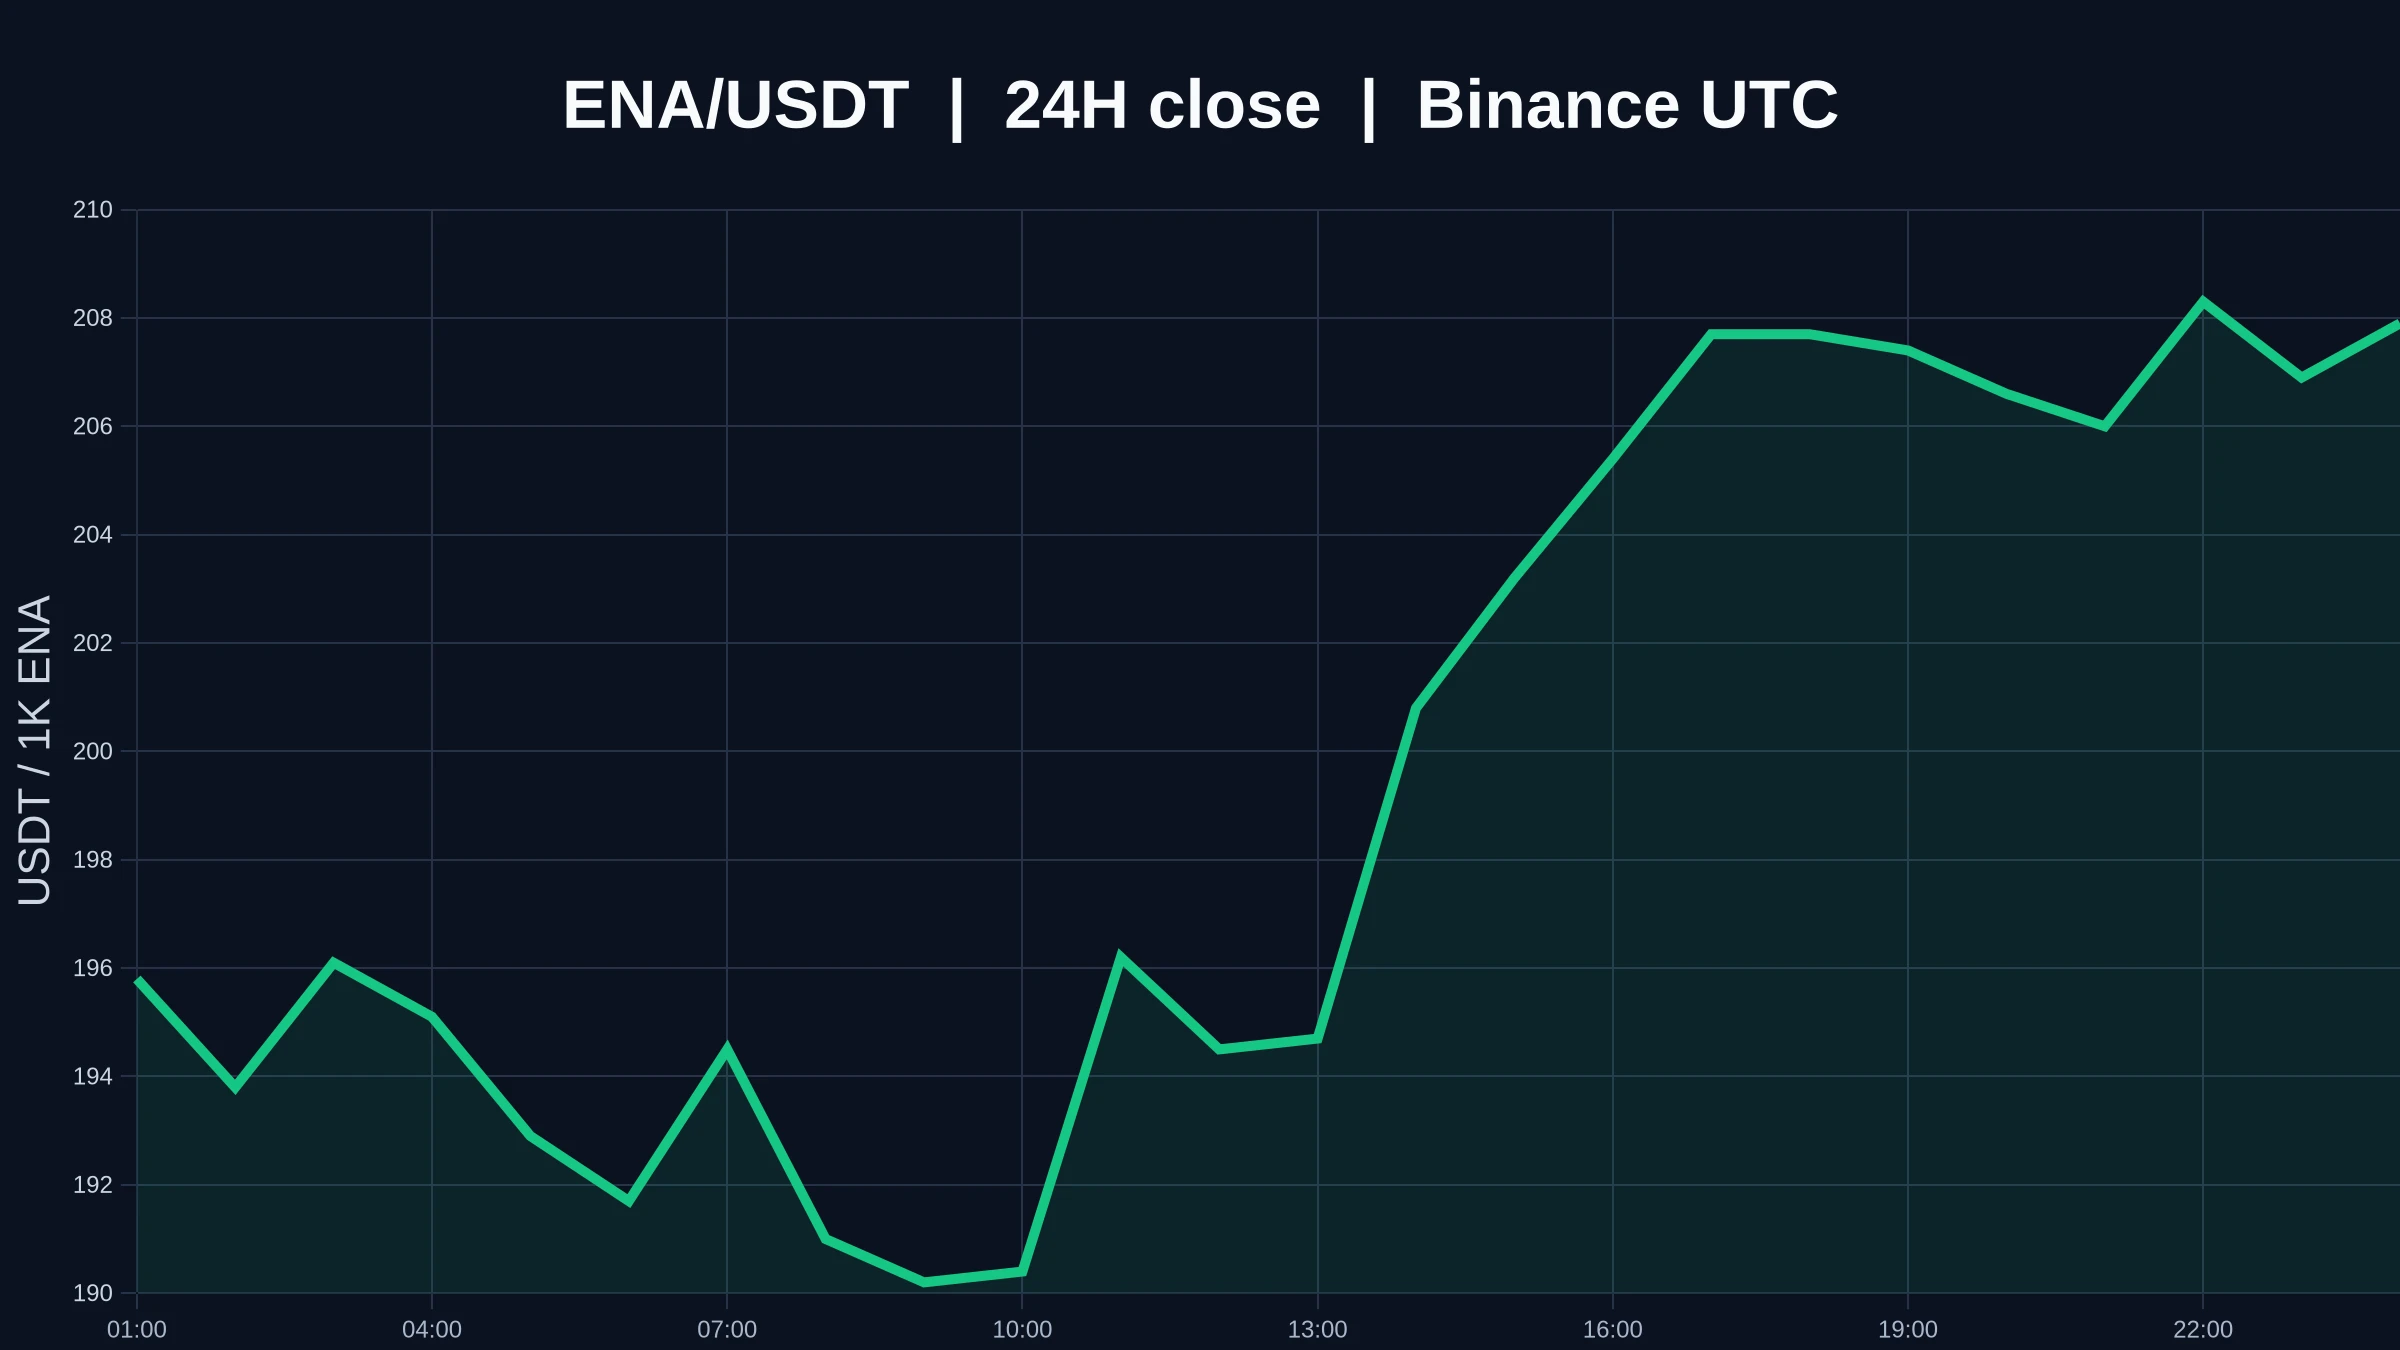
$ENA 24-hour change: +6.30%; current price is 0.2074. The 1-hour chart is strong, and so is the 4-hour chart. Whether the two charts tell the same story matters more than the gainers and losers list. Strength and crowding are key here. A high RSI signals strong buying pressure, but also that plenty of traders are already chasing the price. The trend may continue, but whether the first pullback is absorbed matters more than continuing to guess how high it can go. During a rally, it’s easiest to mistake hype for support; real support only becomes visible after a pullback.
The distances on the c
post-image
ENA+3.76%
Trenches
STONK
S
bade
b
STONK
6GmA...UNgx
Market Cap
$.
Change
.
24h Vol
$.
Holders
.
BTC
B
bade
b
BTC
C5xp...pump
Market Cap
$.
Change
.
24h Vol
$.
Holders
.
CNPY
C
bade
b
CNPY
0xc6...ddd2
Market Cap
$.
Change
.
24h Vol
$.
Holders
.
ZIG
Z
bade
b
ZIG
0x8c...1145
Market Cap
$.
Change
.
24h Vol
$.
Holders
.
LAUNCH
L
bade
b
LAUNCH
AhBi...Qj6C
Market Cap
$.
Change
.
24h Vol
$.
Holders
.
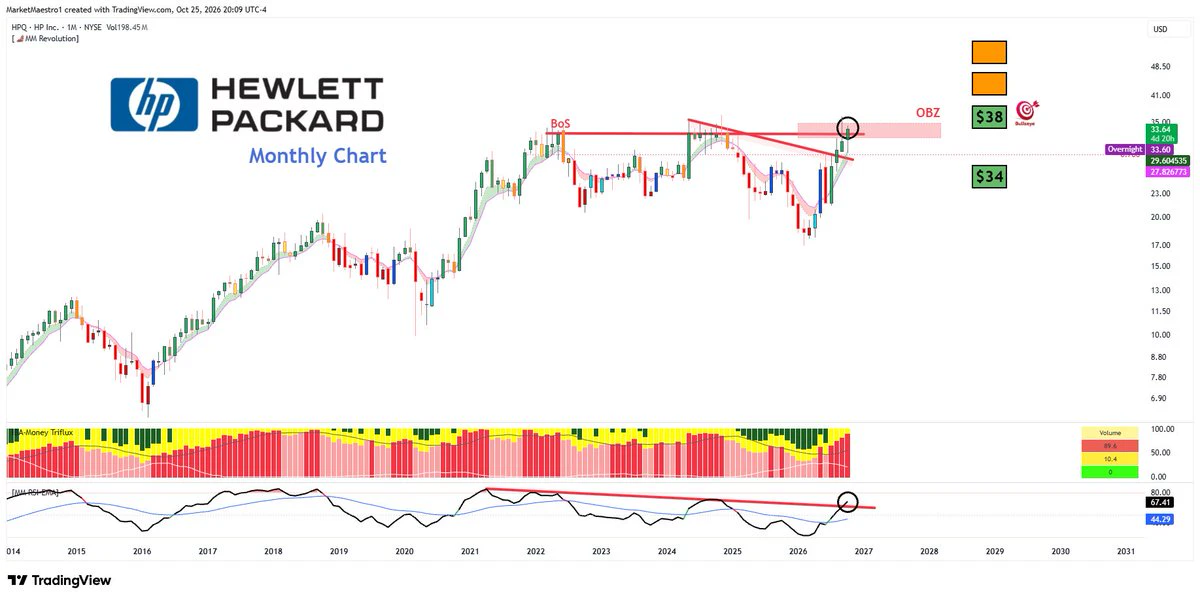
$HPQ
It’s showing a level of strength rarely seen in this environment. It broke through the BoS zone
post-image
HPQ-0.41%
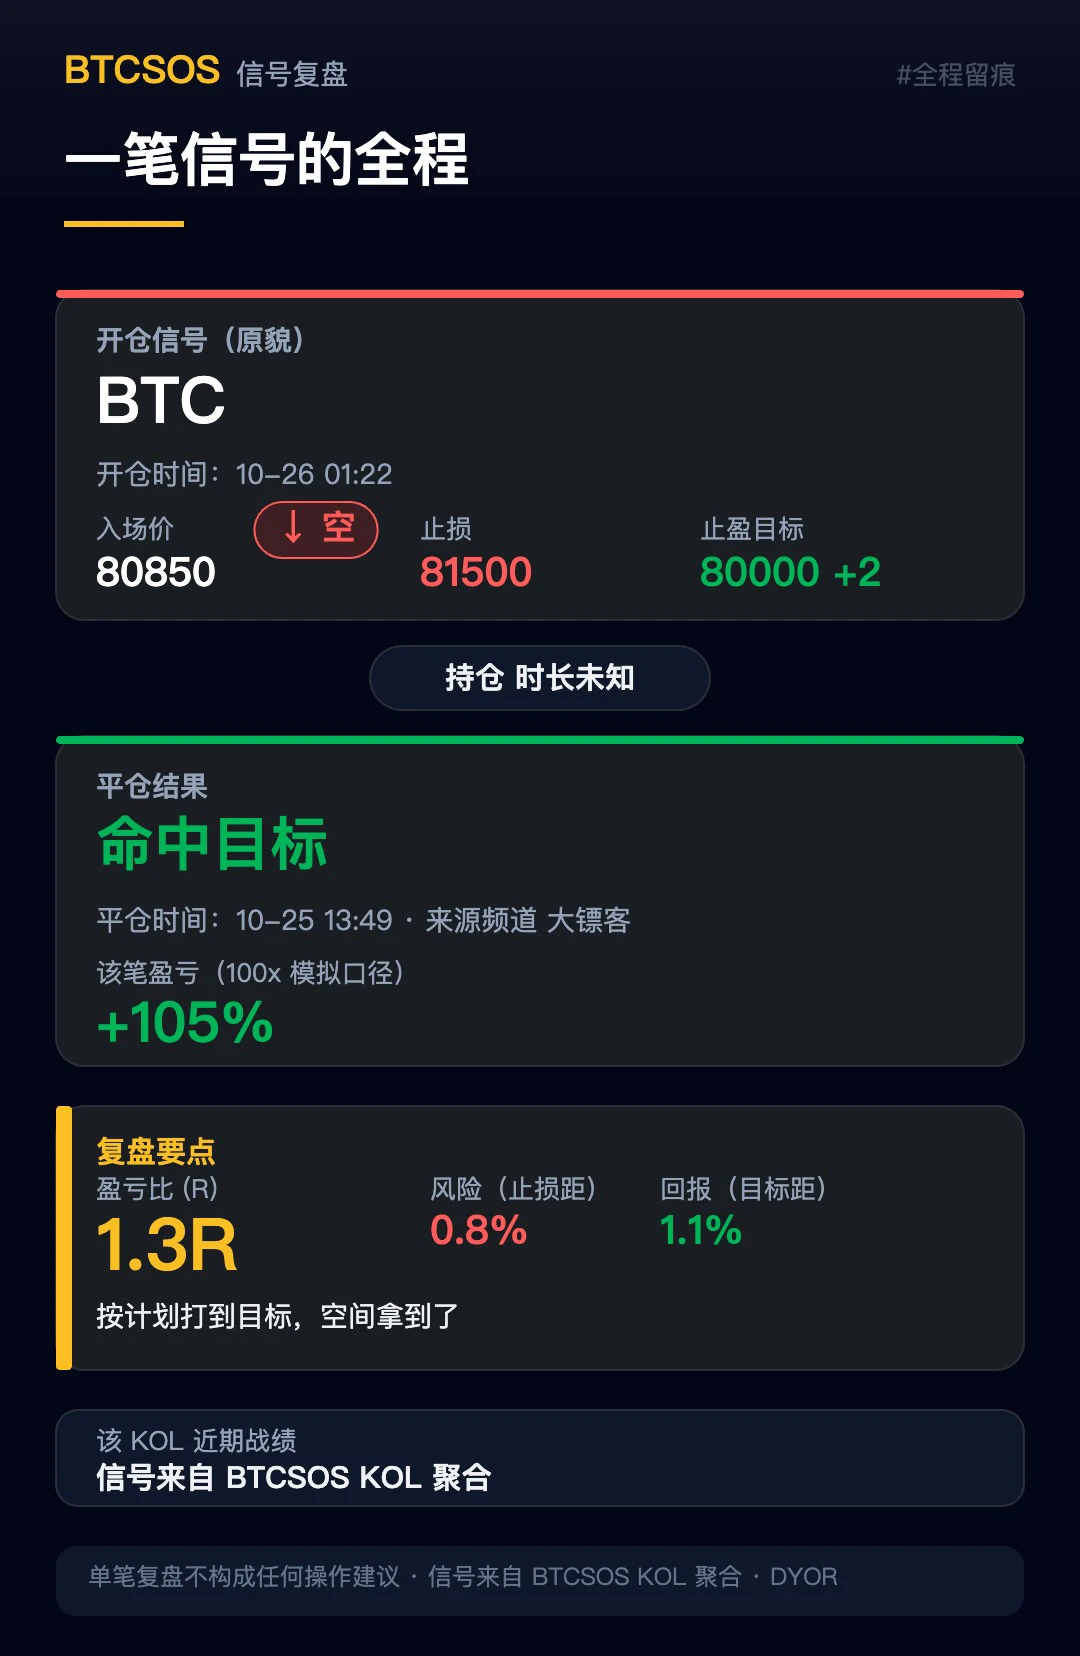
Let’s dig into a recently settled signal: Big Bounty opened a short on 10-26 at 01:22, $BTC , entering at 80850, with a stop-loss at 81500 and targets at 80000/79300. Key point: both the stop-loss and targets were marked! Not one of those “we’ll see when we get there” hot-air calls—we have the original record in our archive, go look it up yourself~
Then this trade held on for so long …… I was getting anxious for it 😤 Luckily, it closed on 10-25 at 13:49 and bam, hit the target 🎯! +105% on a 100x simulated basis—that’s what we like to see! (But babe, going all-in on a single trade is asking t
post-image
BTC-1.66%
GLDX-1.31%
PAXG-0.12%
#每周来晒 #美股财报季 #Gate广场万圣节
BTC Falls Below $80,000 Again: Short-Term Pullback or Trend Reversal?
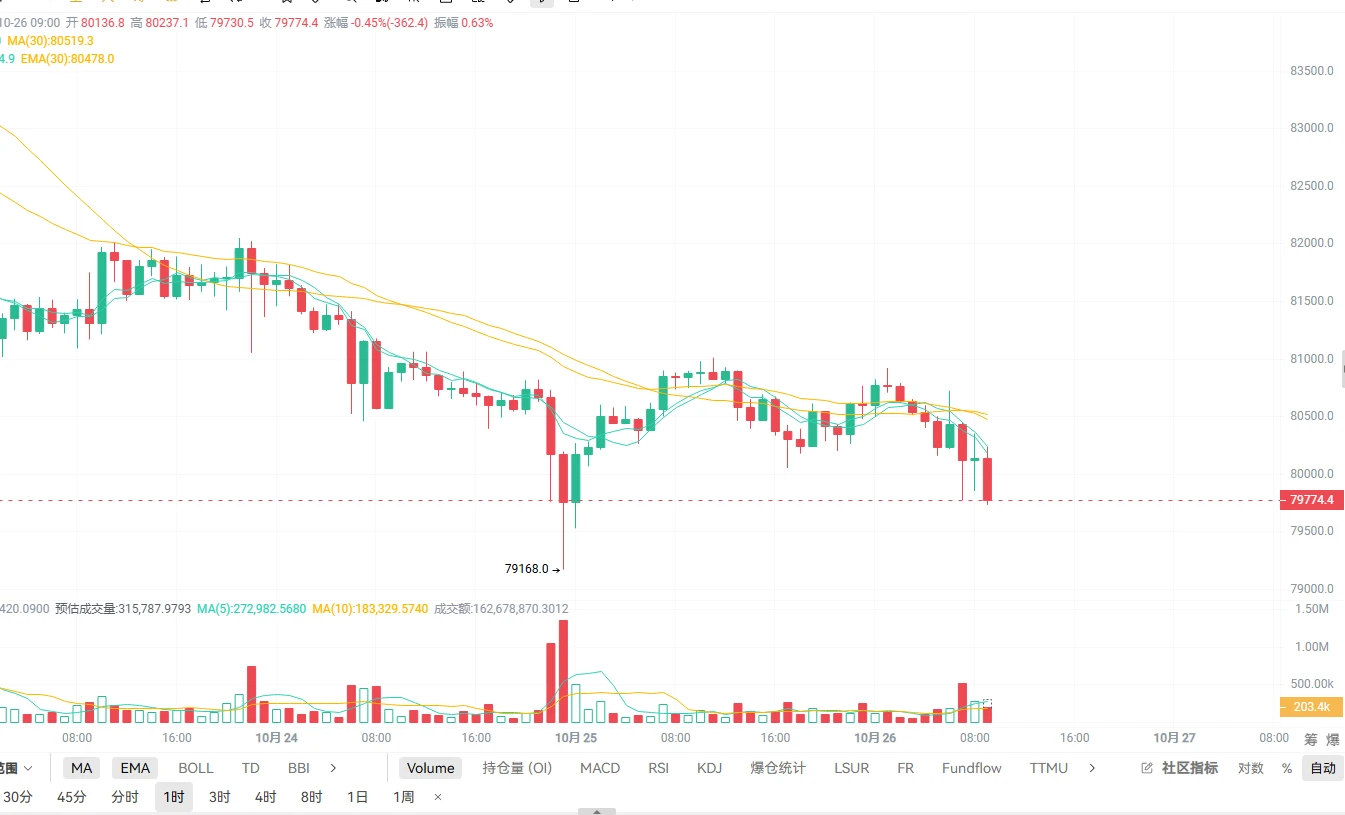
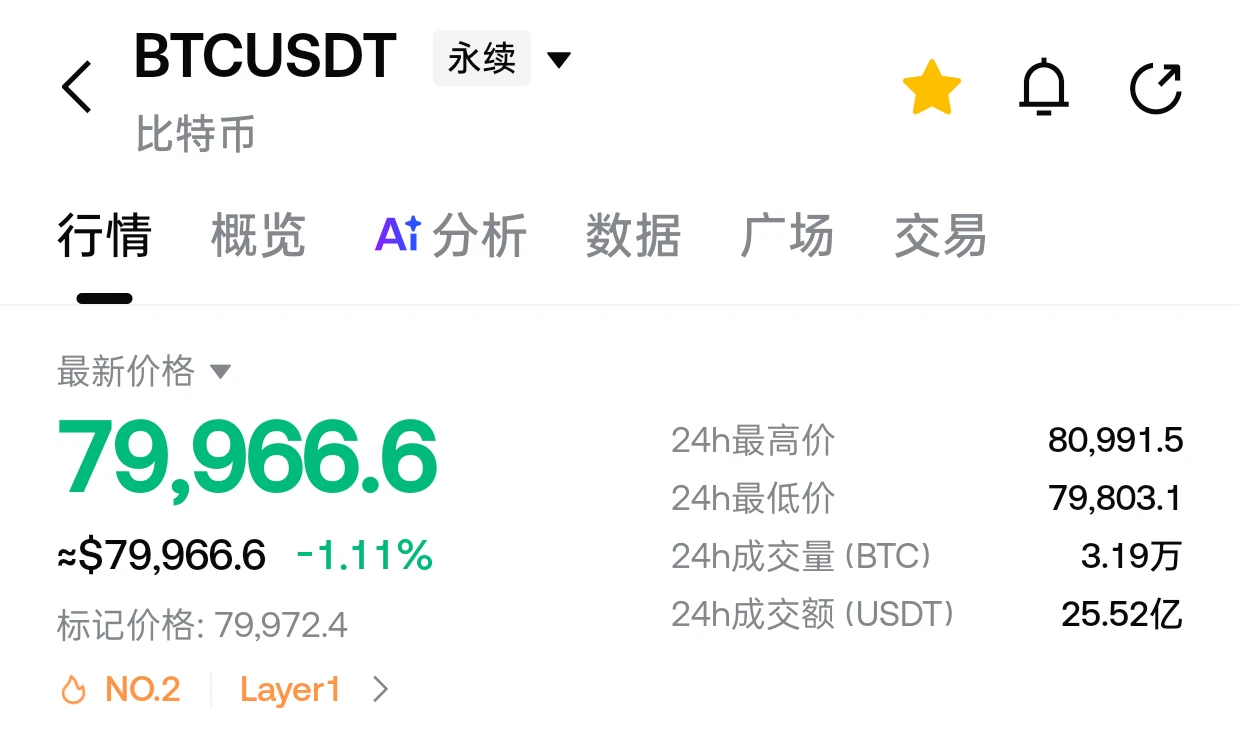
Waking up to this was a shock: with no negative news, BTC plunged straight through the $80,000 level, hitting a low of $79,100. One sharp wick down, and $239 million in long positions across the market were liquidated on the spot. The Asian session on Monday caught its breath, rebounding and hovering above $80,000.
🔥 Three forces behind this sell-off
First driver: ETF funds are fleeing. U.S. spot BTC ETFs saw net outflows of $636 million on Thursday, followed by another $138 million on Friday, tota
post-image
BTC-1.66%
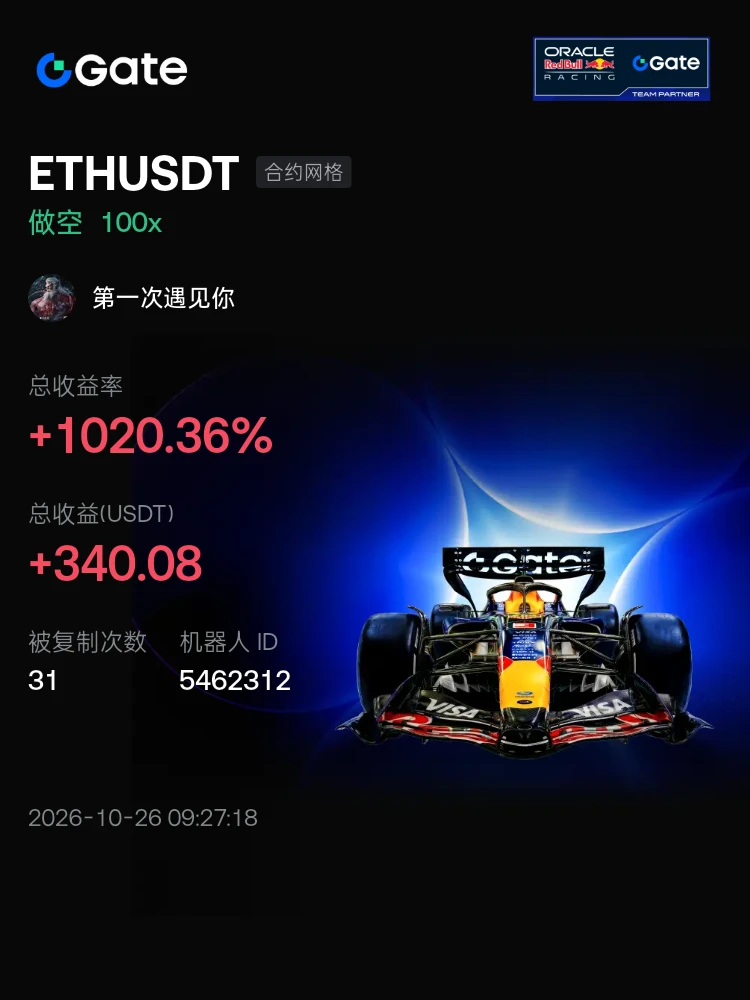
#交易机器人 I'm using the ETHUSDT contract grid bot on Gate—come copy trade with me
post-image
Watching $XMR
hit that dense moving-average zone and then pull all the way back, honestly, this entry setup couldn't have been more perfect. This short trade is up 40%—beautiful. Unusual market activity: $ARIA : Current price 0.08218 - 24-hour change: +15.79%$BTC : Current price 80,083.4 - 24-hour change: -1.00%
post-image
XMR-4.28%
ARIA+13.15%
BTC-1.67%
🌈 Gate Live Livestreaming Ideas - October 26
Trending Topics:
🔹The Fed decision collides with tech giants’ earnings! A blockbuster week for the markets kicks off—are BTC and U.S. stocks in for a major shake-up?
🔹BTC has fallen below $80k again! Bulls keep losing key levels—will this time send prices straight to new lows?
🔹BTC is down 10%, but could the bottom be closer? Analysts say the correction is nearing its end—is it time to buy the dip or keep waiting?
🔹Michael Saylor suddenly stops signaling crypto purchases! Strategy halts its buying spree—is BTC losing one of its biggest buyers?
post-image
BTC-1.67%
SUI-3.66%
FF-0.21%
COMP-10.82%
  • 6
  • 5
Light bit | October 26 $BTC Oil prices surge to $117, selling pressure emerges; favor shorting rallies
【Today's Strategy】
Entry timing: Enter short positions on a rebound into the 80200–80400 range
Stop loss: Above 80700
Staggered take-profit:
First target: 79300–79168 (previous low)
Second target: 78500–78300
【Core Conclusion】
Geopolitically, signs of escalation are emerging. Oil prices have risen to $117 for the first time in six months, and Iran has intensified attacks on oil tankers in the Strait of Hormuz. BTC's safe-haven properties have yet to be effectively activated; geopolitical ris
post-image
BTC-1.66%
☀️ GM! A new week is here—what’s your opening move? ♟️
BTC is looking for direction around $80K , macro news keeps coming, and WCTC S9 officially kicks off today. 👀
📌 Today, let’s talk: with the market changing constantly, what’s your opening strategy?
₿ Keep holding BTC or look for new opportunities?
📊 Which market signal are you watching most closely this week?
🛡️ How will you adjust your trading plan and manage risk?
There are no standard answers in the market, but every step is worth reviewing.
🏆 Come to Gate Square with #WCTCS9 to share your views, trading strategies, or team plans,
post-image
BTC-1.67%
GT-1.91%
  • 4
  • 4
On October 26, U.S. national debt had already topped $40 trillion. Crude oil has been rising lately, with only a slight pullback over the past two days of the weekend. The U.S. Dollar Index has now pulled back to around 101.5, where we should watch for support. The 30-year Treasury yield has also reached a support level.
🟢With the U.S. midterm elections approaching, the third aircraft carrier is currently refueling and repositioning in Japan, and is still headed to the Middle East afterward. Amphibious forces are being deployed. Trump knows this could push oil prices higher and fuel inflation
USIDX-0.15%
GLDX-1.31%
PAXG-0.12%
XAU-0.08%
XAUUSD-0.05%
The Jerk’s Take on CL U.S. Crude Oil 10.26
Over the weekend, CL hit 105 right on the nose. It’s now pulled back to the 5-day moving average, and it wouldn’t be surprising to see it look for support around the 10-day moving average before another big bullish candle, as the regional situation changes.
This is just the Jerk’s take, so don’t take it as gospel. But data often don’t lie. The Jerk’s strategy is still to trim U.S. tech stocks when oil prices fall. Better to have cash on hand than be caught short, right?
For CL, keep an eye on support around 100. If the U.S. says it’s going to act, it’
CL-1.65%
GLDX-1.31%
PAXG-0.12%
XAU-0.08%
10.26 Market Analysis
Bitcoin Strategy Reference Setup
Entry range: Long near 79,800–80,300
Stop-loss: 79,200
First target: 81,200; second target: 82,500
A quick review of the current market: Although the market has shown some short-term rebound momentum, with buying at lower levels bringing a slight recovery in prices, downward pressure has not been fully alleviated from a medium-term perspective. The tug-of-war between bulls and bears remains intense, and Bitcoin’s $80,000 level has once again become a key threshold for determining the next direction of the market!
Ethereum’s price action is
post-image
BTC-1.66%
ETH-2.30%
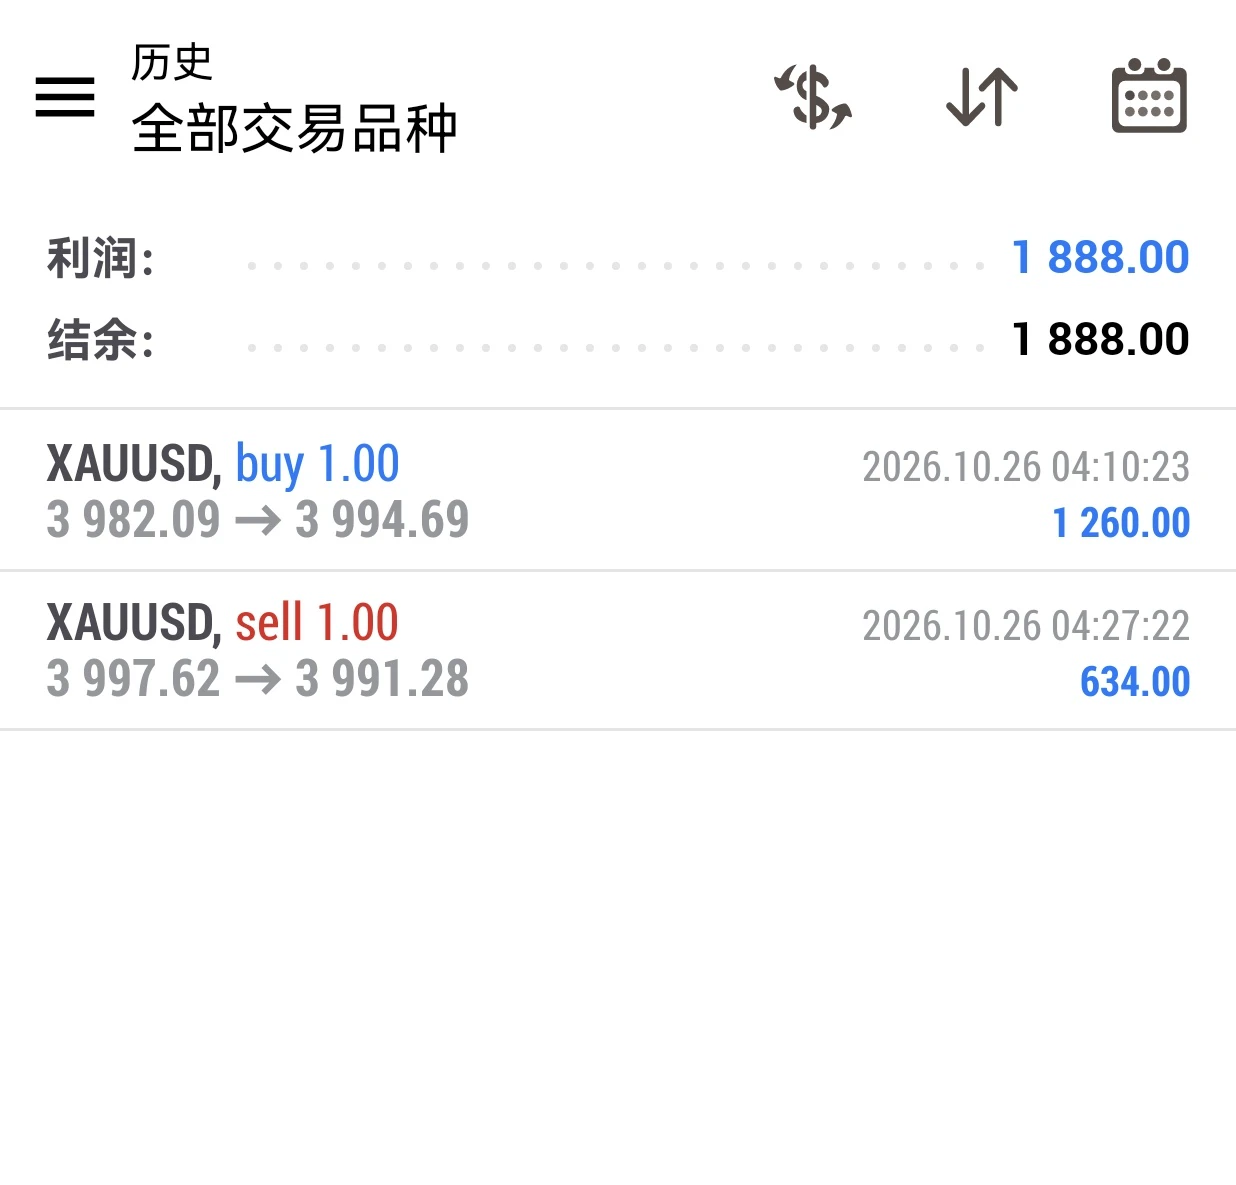
A new week begins with the first trade of the week!
Two consecutive intraday wins:
① Long at 3982, exited at 3994, +12 points, $1260
② Short at 3997, exited at 3991, +6 points, $634
$XAU #黄金 #现货黄金跌破$4000 ‌
post-image
XAU-0.08%
Deadass just had dinner at an Indian restaurant and Yenni was my server.
Picture for proof.
post-image
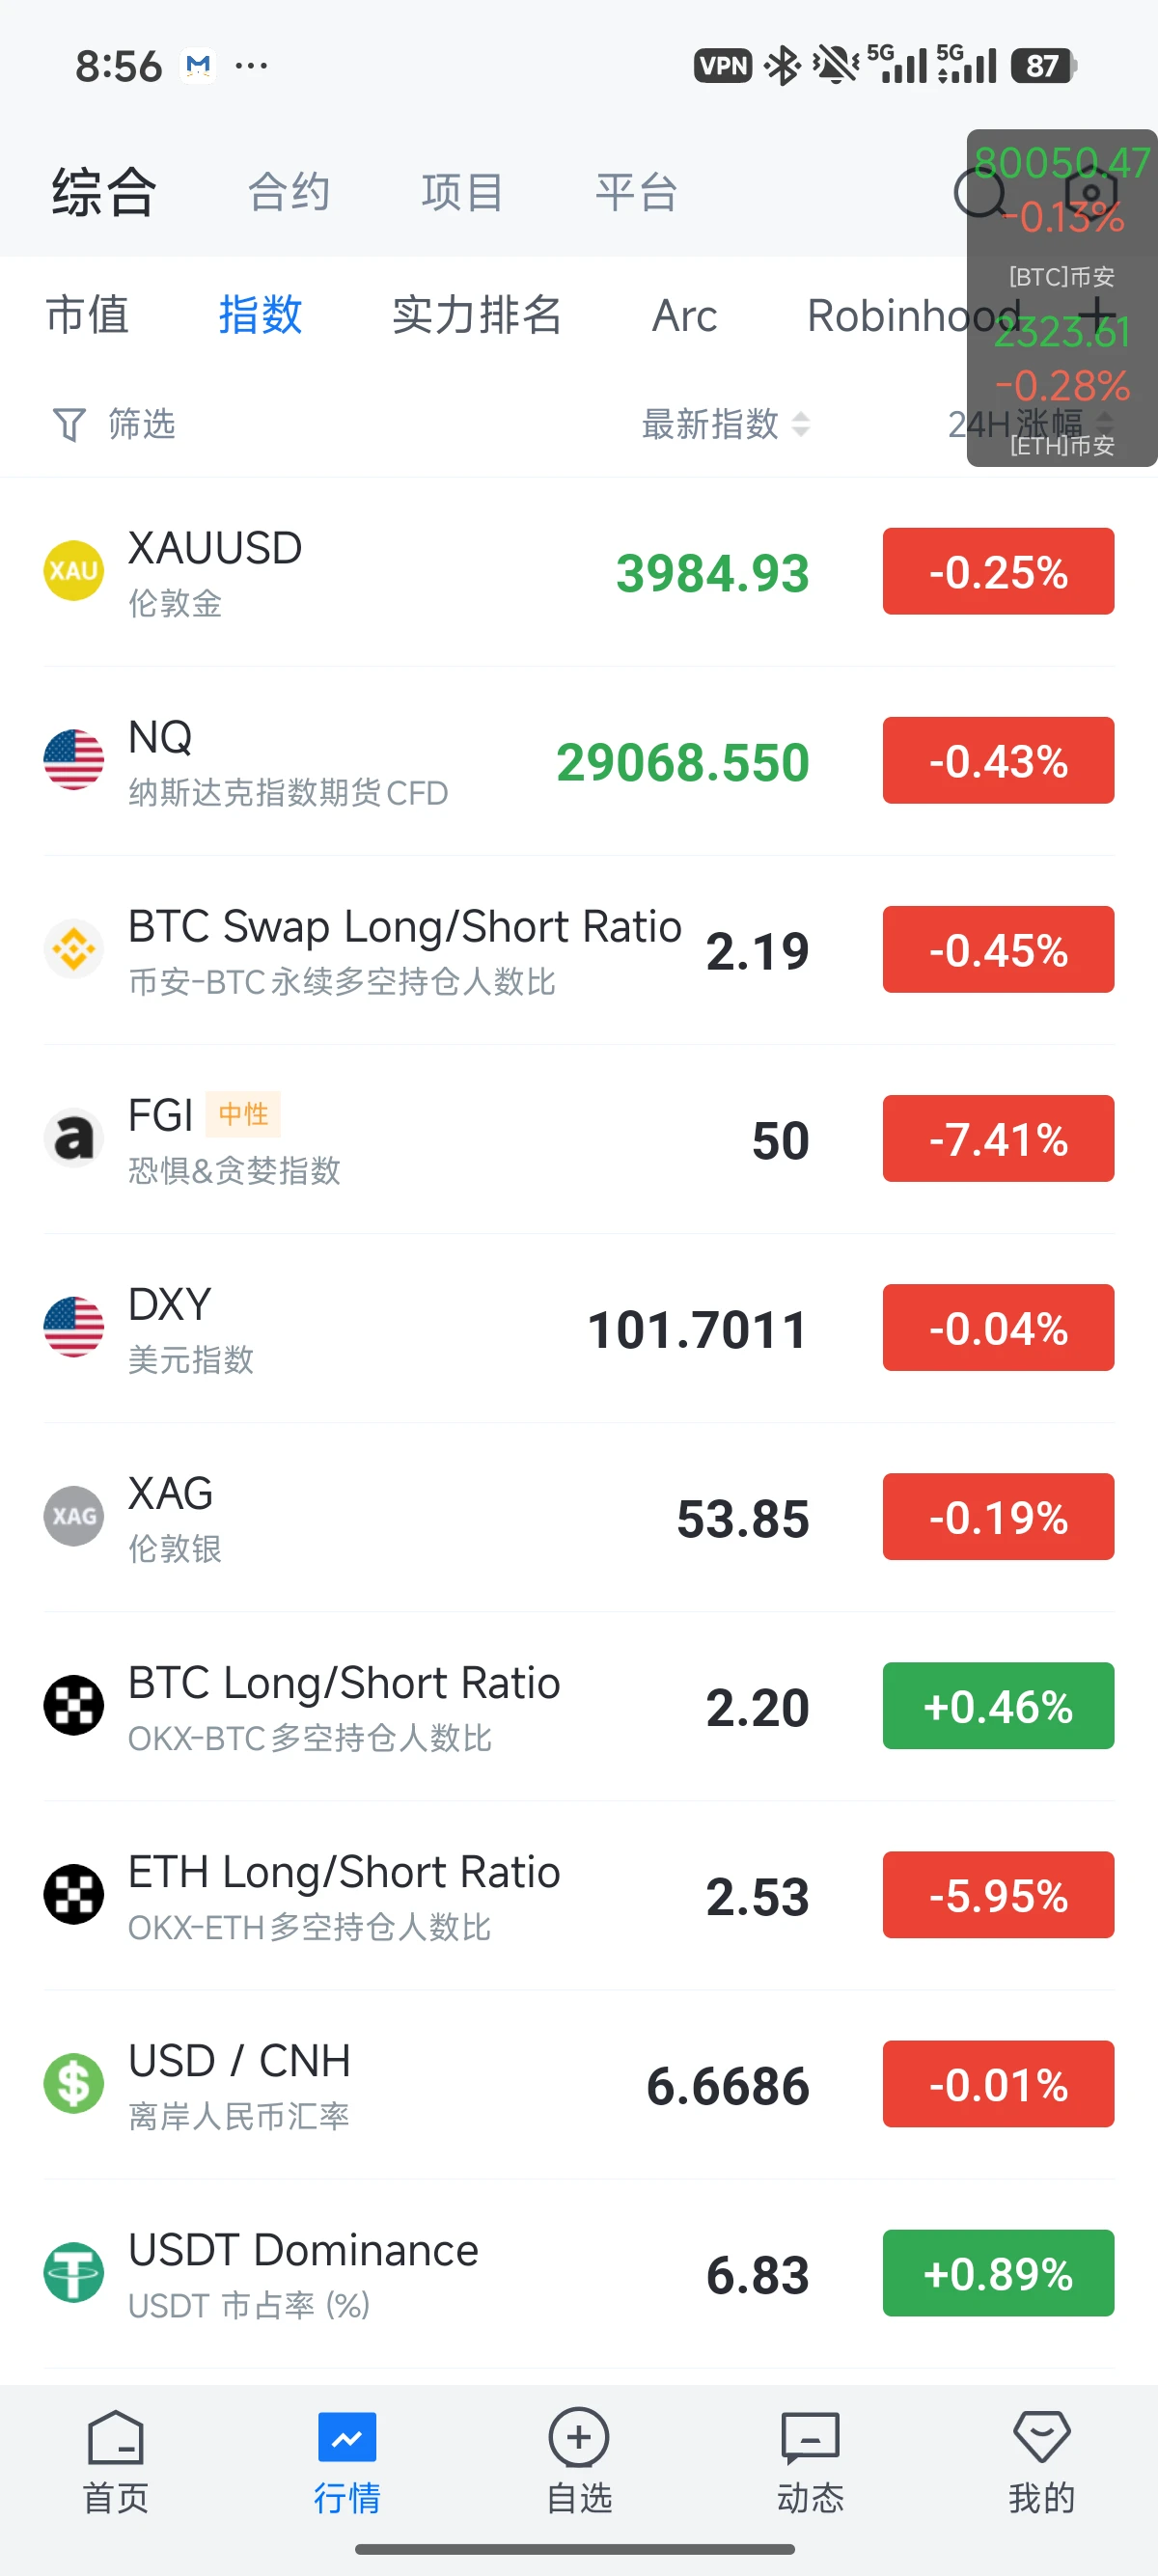
Monday gets off to a strong start; gains are underway🎉
Gold has fallen below 4,000, but the long/short ratio remains stubbornly high. I personally think it will continue to fall, so anyone looking to buy the dip should wait patiently
post-image
GLDX-1.31%
PAXG-0.12%
Load More

Join 40 M users in our growing community

⚡️ Join 40 M users in the crypto craze discussion

💬 Engage with your favorite top creators

👍 See what interests you

Trending Topics

USEarningsSeason

110.92k Views3.56k Discussing

The U.S. Q3 earnings season is in full swing, with major tech companies including Tesla and Meta reporting results. Market focus is shifting beyond revenue and profit toward AI spending, capital expenditure, margins and forward guidance. Which company’s earnings are you watching most closely?

BitcoinFallsBelow80K

10.48k Views24.56k Discussing

USConsumerSentimentNearRecordLow

14.55k Views322 Discussing

View More