











Share your thoughts
placeholder
Article
Bitcoin is back above $80,000, but the real test begins now.
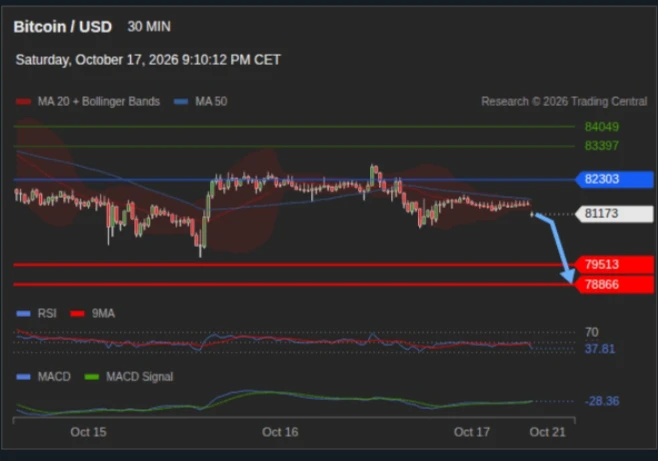
At the time of writing, $BTC is trading near $81,000 after testing the $82,000 area. That puts price directly below an important resistance zone.
Key levels I am watching:
• Immediate support: $80,000
• Stronger support: $77,000-$78,000
• Main resistance: $82,000-$82,500
• Next target after confirmation: $85,000
My strategy is simple: I am not chasing this move.
If Bitcoin retests $80,000 and buyers defend it, I will look for continuation. A strong close above $82,500, followed by a successful retest, would make the breakout more con
post-image
BTC+1.33%
  • 1
BREAKING:
US unemployment data came in at 4.1%
Expectations: 4.1%
post-image
$ICP Signal】Long bias: 4H momentum expanding, buy-side dominance in the order book
$ICP Current price 2.563 is testing the 4H Bollinger upper band, with the MACD histogram expanding to 0.0050. After retesting the 1H EMA20, buyers have re-entered. Order book depth imbalance is 13.09%, with a buy-side ratio of 1.30, while the funding rate of 0.0055% shows no signs of overheating. OI is consolidating sideways, and the price is climbing step by step along the moving averages, with short-term bullish momentum still remaining.
🎯Direction: Long
⚡Entry/limit order: 2.55531 - 2.56300
🛑Stop-loss: 2.5
post-image
ICP-1.47%
BTC+1.33%
ETH+1.41%
SOL+0.19%
Sectors’ % of stocks at 4w and 52w highs
post-image
wow @theunipcs
post-image
gm,
is a good day to have a good day. and to do something ridiculous.
🐸
post-image
Guys, bitcoin:native has touched 81,100 again.
The key isn’t the price level—it’s that it has climbed back above the 50-week moving average.
I’ve said before that this line is the dividing line between bulls and bears. If it can hold above it at the weekly close, buyers will have fully regained the initiative, and trend positions can be held. If it falls back below, don’t be stubborn—there’s still room to drop.
I placed a few small long positions a couple of days ago, betting that this week’s candle would close firmly.
Seriously, at a level like this, don’t listen to anyone calling trades—just
post-image
BTC+1.33%
U.S. Jobs Report Drops Today! Markets Expect Just 56K New Jobs in August!
live-cover
LIVE2,482
  • 1
After seeing the bearish news, I thought this move was completely dead, but it turned out to be better at putting on a show than I am. While everyone else was running, $ETHW quietly edged higher; volume failed to follow, and every push upward was just short of that final breath. I judged this to be the last bull trap, so I immediately went short, with an entry price of 0.2720. Now look at that—the current price is 0.268, the return is +26.78%, and this grind wasn't for nothing.

Those who got on board should be waking up laughing, while those who missed it shouldn't beat themselves up. Close
post-image
ETHW-2.31%
DOGE+1.89%
SOL+0.07%
Reclaiming $80k, can the next target be $90k?
After BTC reclaimed $80k, where exactly is the next stop?
BTC is back.
After quickly rebounding from around $77k, reclaiming $80k, and then pushing toward around $82k, market sentiment completed a clear shift in a short period of time. The latest market data shows that BTC briefly touched approximately $82,164, reaching a new high since May.
The most noteworthy aspect of this rally is that BTC has once again broken above the $80k area, which had repeatedly capped prices.
But if you ask me where the next stop is, I would view $83k as the real “water
NVDA+1.78%
  • 25
The consolidation before the nonfarm payrolls is the best short-term trading opportunity, and last month’s nonfarm payrolls were the same. The 4460–80 range will definitely break tonight, most likely to the upside. You can look for a low and position ahead of time tonight! $XAUUSD #Gate用户突破6000万 $BTC
XAUUSD-1.77%
BTC+1.32%
$XMR Signal】Multi-timeframe resonance on the upside, targeting the acceleration phase
$XMR 1H has continuously expanded volume and broken above the upper Bollinger Band, while the MACD fast line has expanded for a second time and the 4H bullish alignment remains intact. Buy-side bids in the order book are sparse, sell-order absorption is weak, and the price is still being firmly supported by capital in the upper range.
🎯Direction: long
⚡Entry/Limit order: 548.94 - 550.59
🛑Stop-loss: 545.08
🚀Target 1: 558.85
🚀Target 2: 562.98
🛡️Trade management:
- Execution strategy: After reaching Target
post-image
XMR+3.85%
BTC+1.33%
ETH+1.41%
SOL+0.19%
$CP showing strong bearish structure since the begining an just keeps falling.
Interesting part is long short ratio is still positive and there wasn't many liquidations yet, meaning lot of longs traped right now and waiting for reverse.
If reverse won't happen soon we can see a waterfall of liquidations.
post-image
CP-20.31%
The hand that set the stop-loss a few days ago trembled slightly; this morning I realized that was unnecessary filial piety😂 Before bed, my last glance showed clear resistance overhead, with volume becoming increasingly hollow as it rose—a strong bull-trap smell. I decided to short at 0.1481; I would exit if it broke through, and hold if it did not.
To be honest, enduring this move was worth it. The current price is 0.1091, and $ARKM surged to +258.5%—it feels really good😎 The short position delivered this much profit, already exceeding expectations.
Being out of the market is not a sin; ope
post-image
ARKM-4.11%
BNB+0.13%
ADA+2.73%
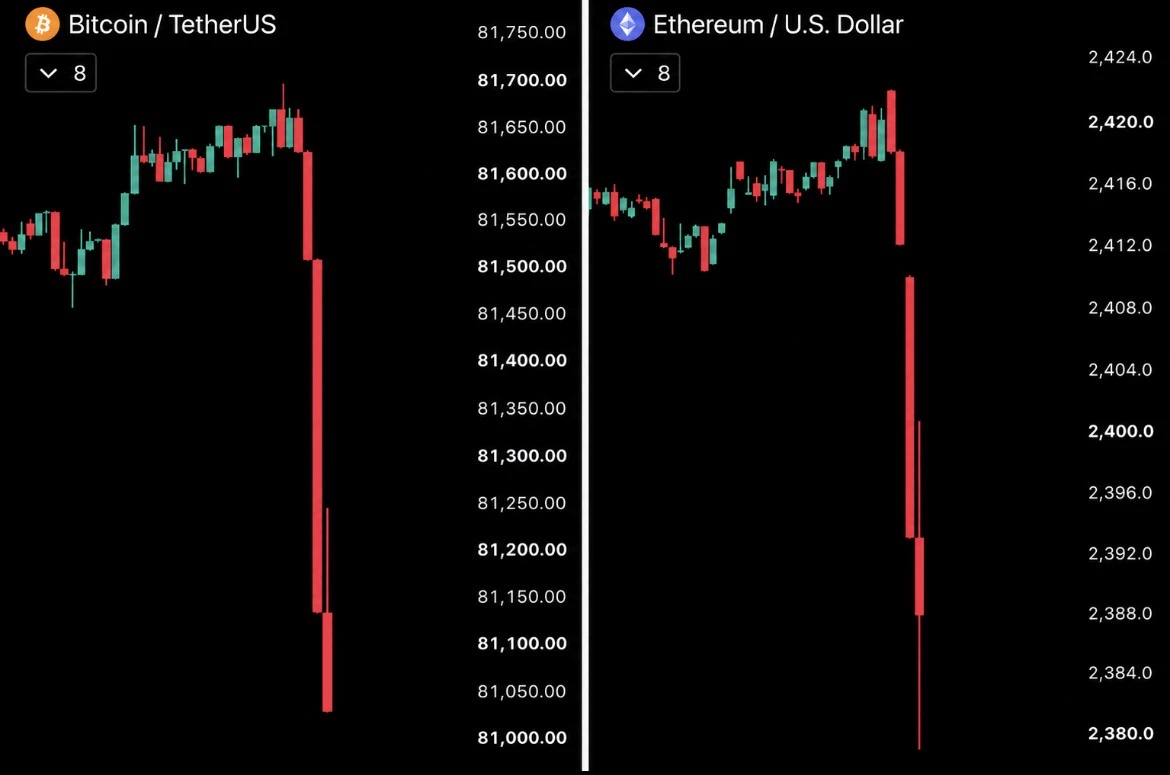
A revised data point actually caused massive market turmoil. U.S. stocks, crypto, and gold all dropped in one candle. Do you think this market is made up of people, or controlled by people?
post-image
GLDX-2.06%
PAXG-1.82%
XAU-1.94%
Fuck, when did this happen?
post-image
BREAKING: 🇺🇸 US unemployment came in at 4.1%, matching expectations exactly.
The real surprise is jobs. The economy added 162,000 in August, nearly 3x the 55,000 expected.
post-image
Sometimes, targeting more is less.
post-image
$AINVDA
1. K-Line Analysis (Current Snapshot)
· Trend: Bearish in the short term. Price is at 0.2509, down -13.30% today.
· Moving Averages: The price is below MA30 (0.2625) and trading just below MA5 (0.2514). This indicates the short-term trend is weak, and upside is capped near the MA5 level.
· MACD: Bearish signal. MACD line (-0.0009) is below the signal line (DEA: -0.0029), and both are negative. No divergence or reversal signal yet.
· Volume: Decreasing volume (MA5 Vol 26.5K vs MA10 45.2K), suggesting weakening selling pressure, but not enough buying to turn the trend.
· Key Levels:
post-image
AINVDA-13.84%
Load More

Join 40 M users in our growing community

⚡️ Join 40 M users in the crypto craze discussion

💬 Engage with your favorite top creators

👍 See what interests you

View More